Airline Revenue Management for Continuous Pricing:
Class-Based and Classless Methods
by
Nicholas James Liotta
B.S., Aeronautical Engineering, Clarkson University, 2017
Submitted to the Department of Civil and Environmental Engineering in
partial fulfillment of the requirements for the degree of
Master of Science in Transportation
at the
MASSACHUSETTS INSTITUTE OF TECHNOLOGY
June 2019
© Massachusetts Institute of Technology 2019. All rights reserved.
Author . . .
Department of Civil and Environmental Engineering
May 20, 2019
Certified by. . .
Peter P. Belobaba
Principal Research Scientist, Aeronautics and Astronautics
Thesis Supervisor
Accepted by . . .
Heidi Nepf
Donald and Martha Harleman Professor of Civil and Environmental Engineering
Chair, Graduate Program Committee
Airline Revenue Management for Continuous Pricing:
Class-Based and Classless Methods
by
Nicholas James Liotta
Submitted to the Department of Civil and Environmental Engineering on May 20, 2019 in Partial Fulfillment of the Requirements for the
Degree of Master of Science in Transportation
Abstract
The development of the New Distribution Capability for airlines has raised interest within the airline industry in “continuous pricing”, where fares offered to customers are not limited to a set of pre-determined price points.
This thesis provides an overview of experiments on four revenue management (RM) methods proposed for the practical implementation of continuous pricing. Two of these methods, termed class-based RM for continuous pricing, utilize existing forecasting and seat protection optimization methods to determine what fares to offer. The other two methods, termed classless RM, calculate optimal fares based on the maximization of expected revenue contribution at a given point in time during the booking process. This thesis examines the performance of probabilistic bidprice and unbucketed dynamic programming methods for both the class-based and the classless methods for continuous pricing.
The continuous pricing methods are compared with traditional class-based methods in unrestricted fare structures using the Passenger Origin Destination Simulator. Compared to a baseline with six fare classes, when two competing airlines both implement class-based continuous pricing, revenues can increase by up to 1%, and, when both airlines implement classless pricing, they can gain up to 2% in revenue. When only one airline implements continuous pricing in a competitive setting, revenue gains of 10–13% are possible over the six-fare class baseline. These larger gains mostly come at the expense of the competitor, which loses revenue and bookings. For all cases, as the number of fare classes in the baseline increases, the revenue gains of continuous pricing are diminished and may even become revenue losses under certain conditions.
The positive results of the continuous pricing methods are a result of the increased price granularity offered by continuous pricing. It is this price granularity that causes most of the revenue gains when a competitor airline does not switch to continuous pricing. The price granularity effect also explains why increasing the number of fare classes with the traditional class-based RM methods can generate as much and sometimes more revenue than the continuous pricing methods. Thesis Supervisor: Peter P. Belobaba
Acknowledgements
Firstly, I would like to thank Dr. Peter Belobaba, my thesis supervisor and academic advisor. His introduction to and guidance through revenue management greatly helped me better understand the field and produce the research contained in this thesis. His knowledge revenue management and the airline industry has been invaluable, and his funding made my attendance of MIT possible.
I would also like to thank and remember Craig Hopperstad, who programmed the versions of the Passenger Origin Destination Simulator (PODS) used in this thesis, before passing away in January of 2019. His helpfulness and responsiveness to requests and questions was greatly appreciated, and he will be missed.
Additionally I would like to thank Dr. Michael Wittman and Dr. Adam Bockelie for helping two other first-year graduate students and me through the learning curve of PODS research, despite having to work on their own doctoral dissertations at the same time (especially Adam, who mentored the three of us on his own for a year after Mike graduated).
I would like to also thank the rest of the PODS student research crew, Akash Raigangar, Alexander Papen, Kevin Wang, and Tim Lu, as well as William Lee who also worked in the research group. Thanks for making the lab an interesting and entertaining place to be.
I would like to thank my parents for supporting me throughout my education process. It is safe to say that I would not be at this point without their help, love, and support.
Lastly, I would like to dedicate this thesis to my grandfather, who passed away in October of 2018. He would have loved to see me graduate from MIT, and I will miss him greatly.
Table of Contents
Chapter 1: Introduction ... 19
1.1 Revenue Management ... 19
1.2 New Distribution Capability and Non-Static Pricing ... 21
1.3 Motivation for Research ... 22
1.4 Thesis Outline ... 23
Chapter 2: Literature Review... 25
2.1 Forecasting Methods ... 25
2.1.1 Pick-up Forecasting ... 25
2.1.2 Q-Forecasting ... 26
2.2 Fare Adjustment ... 28
2.3 Seat Protection Models... 28
2.3.1 Leg-Based Protection Methods ... 29
2.3.2 Origin-Destination RM Optimization Methods ... 31
2.3.3 Theoretical Optimality versus Practicality... 32
2.4 Fare Quote Generation ... 33
2.5 Summary ... 35
Chapter 3: Revenue Management Models for Continuous Pricing ... 36
3.1 Forecasting ... 36
3.1.1 Fare Restrictions ... 36
3.1.2 Q-Forecasting ... 37
3.1.3 Summary ... 39
3.2 Seat Protection Optimization ... 40
3.2.1 Fare Adjustment ... 40
3.2.3 Traditional Class-Based Unbucketed Dynamic Programming (UDP) ... 46
3.2.4 Class-Based ProBP and UDP for Continuous Pricing ... 48
3.2.5 Classless Revenue Management ... 50
3.3 Conclusion ... 55
Chapter 4: Simulation Methodology ... 56
4.1 PODS Software Overview ... 56
4.1.1 Passenger Choice Model ... 56
4.1.2 Simulation Process ... 59
4.2 Network D6 with an Unrestricted Fare Structure... 60
4.3 Summary ... 63
Chapter 5: Results of Continuous Pricing Simulations ... 64
5.1 ProBP Results ... 65
5.1.1 Traditional Class-Based ProBP in Symmetric Competition ... 65
5.1.2 Class-Based ProBP for Continuous Pricing in Symmetric Competition ... 69
5.1.3 Class-Based Continuous vs. Traditional Class-Based ProBP in Asymmetric Competition ... 79
5.1.4 Classless ProBP in Symmetric Competition ... 85
5.1.5 Classless vs. Traditional Class-Based ProBP in Asymmetric Competition ... 90
5.1.6 Summary of ProBP Continuous Pricing Experiments ... 92
5.2 UDP Results ... 93
5.2.1 Traditional Class-Based UDP in Symmetric Competition ... 93
5.2.2 Class-Based UDP for Continuous Pricing in Symmetric Competition ... 97
5.2.3 Class-Based Continuous vs. Traditional Class-Based UDP in Asymmetric Competition ... 104
5.2.6 Summary of UDP Results ... 115
5.3 Comparison of ProBP and UDP in Symmetric Competition ... 115
5.4 Summary ... 119
Chapter 6: Conclusions ... 121
6.1 Thesis Objectives and Models Overview ... 121
6.2 Results Summary... 124
List of Figures
Figure 1-1: Combinations of Pricing and Forecasting and Optimization Methods ... 23
Figure 2-1: Spiral-down (Tam, 2008) ... 27
Figure 2-2: Joint Protection (Cléaz-Savoyen, 2005)... 30
Figure 3-1: Classless ProBP Flow ... 53
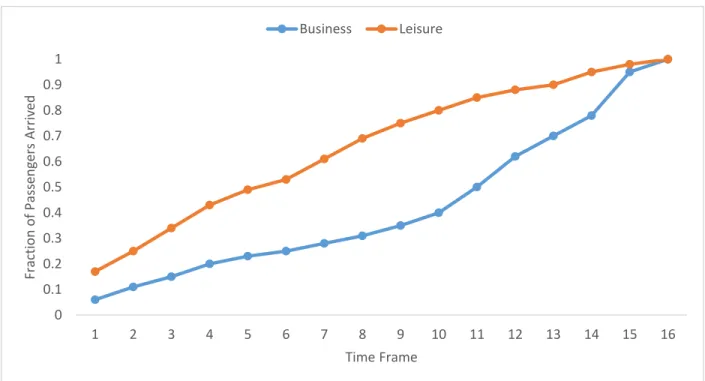
Figure 4-1: Arrival Rate of Business and Leisure Passengers over the Booking Process ... 57
Figure 4-2: Demonstration of Sample Business and Leisure WTP Curves ... 58
Figure 4-3: PODS Structure (PODS Primer) ... 60
Figure 4-4: Map of Network D6 ... 61
Figure 4-5: FRAT5 Curves Commonly Used for Network D6 ... 63
Figure 5-1: 6-Class Traditional Class-Based ProBP Revenue ... 66
Figure 5-2: Traditional Class-Based ProBP Revenue (percent change in revenue from 6-class experiment) ... 67
Figure 5-3: Airline 1 Traditional Class-Based ProBP Average Fares ... 68
Figure 5-4: Airline 1 Traditional Class-Based ProBP Bookings Difference from 6-Class Case . 68 Figure 5-5: Traditional Class-Based ProBP Time Frame 1 Forecast Bookings-to-come ... 69
Figure 5-6: Airline 1 Traditional Class-Based ProBP Bidprices ... 69
Figure 5-7: 6-Class Class-Based Continuous ProBP Revenue ... 70
Figure 5-8: Class-Based Continuous ProBP Revenue ... 71
Figure 5-9: Class-Based Continuous ProBP Time Frame 1 Forecast Bookings-to-come ... 72
Figure 5-10: Airline 1 Class-Based Continuous ProBP Bidprices ... 72
Figure 5-11: Airline 1 Class-Based Continuous ProBP Difference in Bookings from 6-Class Case ... 73
Figure 5-12: Airline 1 Traditional or Continuous Class-Based ProBP Revenue (percent change in
revenue from switching from traditional to continuous class-based) ... 74
Figure 5-13: Airline 1 Traditional or Continuous Class-Based ProBP Time Frame 1 Forecast Bookings-to-come ... 75
Figure 5-14: 6-Class Airline 1 Traditional or Continuous Class-Based ProBP Average Fare ... 76
Figure 5-15: 21-Class Airline 1 Traditional or Continuous Class-Based ProBP Average Fare ... 77
Figure 5-16: 6-Class Airline 1 Traditional or Continuous Class-Based ProBP Bookings ... 77
Figure 5-17: 21-Class Airline 1 Traditional or Continuous Class-Based ProBP Bookings ... 78
Figure 5-18: 6-Class Airline 1 Traditional or Continuous Class-Based ProBP Bidprices ... 78
Figure 5-19: 21-Class Airline 1 Traditional or Continuous Class-Based ProBP Bidprices ... 79
Figure 5-20: Continuous vs. Traditional Class-Based ProBP Revenue (percent change in revenue resulting from Airline 1 switching from traditional to class-based continuous) ... 80
Figure 5-21: Continuous vs. Traditional Class-Based ProBP Change in Airline Bookings from Symmetric to Asymmetric Experiments ... 81
Figure 5-22: Continuous vs. Traditional Class-Based ProBP Time Frame 1 Forecast Bookings-to-come ... 82
Figure 5-23: Continuous vs. Traditional Class-Based ProBP with Different FRAT5s Revenue (percent change in revenue resulting from Airline 2 switching FRAT5 curve from C to E) ... 83
Figure 5-24: Continuous vs. Traditional Class-Based ProBP Change in Bookings from the Traditional Class-Based Airline 2 Switching to FRAT5 E ... 84
Figure 5-25: Classless ProBP Revenue... 85
Figure 5-26: Traditional Class-Based or Classless ProBP Revenue (percent change in revenue from 6-class experiment) ... 86
Figure 5-28: Airline 1 Traditional Class-Based or Classless ProBP Bookings Difference from
6-Class Case ... 87
Figure 5-29: Traditional Class-Based or Classless ProBP Time Frame 1 Forecast Bookings-to-come ... 88
Figure 5-30: Class-Based Continuous or Classless ProBP Revenue (percent change in revenue from 6-class experiment) ... 89
Figure 5-31: Airline 1 Class-Based Continuous or Classless ProBP Average Fares ... 89
Figure 5-32: Airline 1 Class-Based Continuous or Classless ProBP Bookings Difference from 6-Class Case ... 90
Figure 5-33: Classless vs. Traditional Class-Based ProBP Revenue (percent change in revenue resulting from Airline 1 switching from traditional to classless) ... 91
Figure 5-34: Classless vs. Traditional Class-Based ProBP Change in Airline Bookings from Symmetric to Asymmetric Experiments ... 92
Figure 5-35: 6-Class Traditional Class-Based UDP Revenue ... 94
Figure 5-36: Traditional Class-Based UDP Revenue (percent change in revenue from 6-class experiment) ... 94
Figure 5-37: Airline 1 Traditional Class-Based UDP Average Fares... 95
Figure 5-38: Airline 1 Traditional Class-Based UDP Bookings Difference from 6-Class Case .. 95
Figure 5-39: Traditional Class-Based UDP Time Frame 1 Forecast Bookings-to-come ... 96
Figure 5-40: Airline 1 Traditional Class-Based UDP Bidprices ... 96
Figure 5-41: 6-Class Class-Based Continuous UDP Revenue ... 97
Figure 5-42: Class-Based Continuous UDP Revenue ... 98
Figure 5-43: Class-Based Continuous UDP Time Frame 1 Forecast Bookings-to-come ... 99
Figure 5-44: Airline 1 Class-Based Continuous UDP Bidprices ... 100 Figure 5-45: Airline 1 Traditional Class-Based UDP Bookings Difference from 6-Class Case 100
Figure 5-46: Airline 1 Traditional or Continuous Class-Based UDP Revenue: (percent change in revenue from switching from traditional to continuous class-based) ... 101 Figure 5-47: 6-Class Airline 1 Traditional or Continuous Class-Based UDP Average Fare ... 102 Figure 5-48: 21-Class Airline 1 Traditional or Continuous Class-Based UDP Average Fare ... 102 Figure 5-49: 6-Class Airline 1 Traditional or Continuous Class-Based UDP Bookings ... 103 Figure 5-50: 21-Class Airline 1 Traditional or Continuous Class-Based UDP Bookings ... 103 Figure 5-51: Continuous vs. Traditional Class-Based UDP Revenue (percent change in revenue resulting from Airline 1 switching from traditional to class-based continuous) ... 104 Figure 5-52: Continuous vs. Traditional Class-Based UDP Change in Airline Bookings from Symmetric to Asymmetric Experiments ... 105 Figure 5-53: Continuous vs. Traditional Class-Based UDP with Different FRAT5s Revenue (percent change in revenue resulting from Airline 2 switching FRAT5 curve from C to E) ... 106 Figure 5-54: Continuous vs. Traditional Class-Based UDP Change in Bookings from the Traditional Class-Based Airline 2 Switching to FRAT5 E ... 107 Figure 5-55: Classless UDP Revenue ... 108 Figure 5-56: Traditional Class-Based or Classless UDP Revenue (percent change in revenue from 6-class experiment) ... 109 Figure 5-57: Airline 1 Traditional Class-Based or Classless UDP Average Fares... 109 Figure 5-58: Airline 1 Traditional Class-Based or Classless UDP Bookings Difference from 6-Class Case ... 110 Figure 5-59: Traditional Class-Based or Classless UDP Time Frame 1 Forecast Bookings-to-come ... 110 Figure 5-60: Class-Based Continuous or Classless UDP Revenue (percent change in revenue from 6-class experiment) ... 111 Figure 5-61: Airline 1 Class-Based Continuous or Classless UDP Average Fares ... 112
Figure 5-62: Airline 1 Class-Based Continuous or Classless ProBP Bookings Difference from
6-Class Case ... 112
Figure 5-63: Airline 1 Class-Based Continuous or Classless UDP Bookings Difference from 6-Class Case ... 113
Figure 5-64: Classless vs. Traditional Class-Based UDP Revenue (percent change in revenue resulting from Airline 1 switching from traditional to classless) ... 114
Figure 5-65: Classless vs. Traditional Class-Based UDP Change in Airline Bookings from Symmetric to Asymmetric Experiments ... 114
Figure 5-66: Airline 1 ProBP or UDP Revenue (percent change in revenue from between ProBP and UDP) ... 115
Figure 5-67: 16-Class Airline 1 ProBP or UDP Revenue (percent change in revenue from between ProBP and UDP) ... 116
Figure 5-68: 16-Class Airline 1 ProBP or UDP Time Frame 1 Forecast Bookings-to-come... 117
Figure 5-69: 16-Class Airline 1 Average Fare Difference Between ProBP and UDP ... 118
List of Tables
Table 3-1: Q-Forecasting Example (Belobaba and Liotta, 2017) ... 39
Table 3-2: EMSRb Example (Belobaba et al., 2016, p. 111) ... 42
Table 3-3: Class-Based ProBP Fares ... 44
Table 3-4: Class-Based ProBP Q-Forecast Mean ... 44
Table 3-5: Class-Based ProBP Q-Forecast Standard Deviation ... 44
Table 3-6: Class-Based ProBP Adjusted Fares ... 44
Table 3-7: Class-Based ProBP Iteration 1 Prorated Fares ... 45
Table 3-8: Class-Based ProBP Iteration 2 Prorated Fares ... 45
Table 3-9: Class-Based ProBP Adjusted Fares Open and Closed ... 46
Table 3-10: Class-Based ProBP Original Fares Open and Closed ... 46
Table 3-11: Iteration 1 of Classless ProBP Example ... 52
Table 3-12: Iteration 2 of Classless ProBP Example ... 52
Table 3-13: Iteration 5 of Classless ProBP Example ... 52
Chapter 1: Introduction
The most recent seismic shift in commercial aviation was arguably the deregulation of the United States aviation market in 1978. Once separated from the relative stability of government control over routes and prices, airlines increasingly needed to find ways to increase revenue and cut costs. This led to many of the characteristics of air travel today, such as hub-and-spoke networks and revenue management systems. It is likely that the next great shift is upon the airline industry at this time. This shift is in the form of the arrival of the New Distribution Capability (NDC). With NDC, airlines anticipate being able to break free of many of the constraints that they have had in distributing their tickets. Among these constraints is the ability to increase the number of the fare classes (price points) that they sell, or, at the greatest extreme, eliminate fare classes altogether. There is hope that complete elimination of fare classes will allow for “continuous pricing” and increase revenue, as the theory is that allowing an airline to pick any price to offer will allow it to choose the exact one that maximizes revenue. However, there has not yet been a practical continuous pricing method proposed and tested.
1.1 Revenue Management
The inventory of seats on a flight is both constrained and perishable. Put in more accessible terms, the product which an airline sells, its seats, are both limited and must be sold by a certain point in time, departure, or else they go unsold and unused. The effect of this is that airlines have incentives to both refuse passengers who are not willing to pay higher fares, in order to save inventory for higher value passengers, as well as to accept those lower-valued passengers, in order not to have inventory be unused. It is in an attempt to perform this balancing act that revenue management becomes relevant.
The natural solution to the problem of trying to separate customers with a high willingness-to-pay from those with a low willingness-willingness-to-pay is to sell the same seats at different values. Traditionally, these values, also known as “fare classes” have been defined by the lower-priced classes have more rules and restrictions on them. For example, it may make sense to charge a lower fare paying passenger a fee to change what flight he or she is flying on, while allowing a higher fare passenger the ability to change flights with no extra charge. Other traditional restrictions have acted to separate business and leisure travelers, as business travelers tend to be more sensitive to time restrictions, such as when they fly or the duration of their trip, while being relatively
insensitive to price since they are generally not personally responsible for paying for their trip. The converse is true for leisure travelers, who tend to be more open to adapting the exact dates and times they travel, but will notice price more. Simply having differentiated fare classes would be sufficient if air travel inventory were not constrained by capacity, but this is clearly not the case. Revenue management methods, therefore, try to conserve the higher-value seats for those passengers willing to pay the higher fares, while also not letting the inventory perish.
The backbone of most revenue management methods has been the Expected Marginal Seat Revenue (EMSR) method first developed in Belobaba (1987). This method protects a seat for a higher-valued fare class if the expected marginal revenue of protecting the seat is higher than the value of the same seat in the next fare class. The expected marginal revenue value of a seat is the probability of the seat being sold according to a demand forecast multiplied by the fare for that class. Importantly, EMSR nests protections to match airline inventory structures such that every seat protected for a given class is also protected and available for all the classes more valuable than it.
Since the introduction of EMSR, there have been many additions to expand and improve upon it. EMSR is designed to optimize fare class protection levels on a single leg, and cannot be transferred simply to network-scale problems. Various methods have been devised to allow EMSR to work at the leg level with network fares adjusted to account for how they impact other legs. These mechanisms, such as displacement-adjusted virtual nesting (DAVN) and probabilistic bidprice proration (ProBP) have been designed to adjust multi-leg itinerary fares in the optimization process to account for the fact that multi-leg itinerary fares displace local traffic.
Recently, there has also been more interest in dynamic programming that optimizes protection levels taking into account arrival order of passengers, particularly in academic theory but also to some extent among airlines and commercial RM systems. The core fundamentals and purpose, however, have always remained in all of these revenue management methods: to sell seats to passengers at prices they will pay by simultaneously protecting enough seats for high-valued passengers while not allowing too many seats to go unsold.
While the development of more advanced revenue management methods has been occurring, there has also been another force that has pressured airlines to remove restrictions from
simplified fare structures. In the absence of restrictions and advance purchase requirements, revenue management methods must instead account for the fact that business passengers, who are generally willing to pay more, tend to book later than leisure passengers in order to separate the two passenger types. While the forecasting methods required changes to account for the lack of restrictions, the revenue management optimization methods themselves could remain.
A result of removing all restrictions and advance purchase requirements is that passengers will, without fail, always buy the lowest fare available. This effectively makes it so that there is one fare being offered at any given point in time. This has, in turn, raised the question if, rather than being bound to finite fare classes, an airline selling unrestricted fares could generate more revenue by offering fares from a continuous range of prices.
1.2 New Distribution Capability and Non-Static Pricing
For the last 30 years, the airline industry has relied on the same set of systems to sell its seats to passengers (Westermann, 2013). These systems, known as the Global Distribution Systems (GDSs), place on how airlines may sell their products. For example, the GDSs that an airline publish its fares in advance in fare classes, each of which must be represented by a letter (the result of this being that each airline only has 26 possible fare classes on a flight to split across all cabins and travel types), and each of which is associated with a fixed, published value for a given itinerary on a given day. This requirement has prevented any use of a continuous range of prices instead of fixed price points, and essentially requires airlines to use pricing methods that fall under the category of assortment optimization, where fares are selected from pre-defined price points (Wittman & Belobaba, 2018).
These limitations of GDSs have caused a push within the industry in recent years to develop a new system for distributing fares to passengers. The new standard that has been developed is known as New Distribution Capability (NDC). Information communicated by NDC is written in XML, which gives airlines far more flexibility in their offerings, and NDC also eliminates the need for advanced publishing of fares (Westermann, 2013). One major new ability of NDC, which is already being tested by some airlines, is the idea of dynamic price adjustment (Wittman & Belobaba, 2018). While dynamic price adjustment still relies on fare classes, it allows fares for these fare classes to be adjusted from their fixed points (Wittman, 2018). Beyond this, NDC also introduces the technical possibility of continuous pricing, where, as mentioned above, predefined
fare classes are eliminated entirely and replaced with a continuous range of possible fares. There are many technical challenges to the continuous method, such as needing different revenue management, reservation, and distribution systems (Westermann, 2013), but using it has remained a goal of some airlines.
1.3 Motivation for Research
As mentioned previously, one of the many challenges of implementing continuous pricing is the lack of revenue management models capable of correctly controlling the price of seats within the continuous range. Nearly every revenue management method developed to this point has been designed in such a way that it is reliant on the existence of fare classes. While there have been algorithms developed in academic research for continuous pricing, these methods often require critical assumptions that make them less than practical for use in the industry.
In order to use continuous pricing in a more practical setting, a revenue management method capable of taking a forecast and determining an optimal fare from that forecast is required. One way of doing this is to take pre-existing forecasting and optimization methods that use fare classes and adapt them so that they determine an optimal continuous fare instead of picking from a pre-defined price point. However, since moving away from predefined price points is the objective of continuous pricing, it would theoretically be more appealing to develop forecasting and optimization methods that are classless, i.e. they do not use fare classes at all. It is worth noting, though, that whatever revenue management methods are developed for use in continuous pricing structures could also be used in assortment optimization pricing structures to determine which fixed-price points to offer in unrestricted fare structures. This results in four different classifications from the two types of pricing discussed being combined with class-based and classless forecasting and optimization. A visual interpretation of this is shown in Figure 1-1.
This thesis will discuss the testing of practical revenue management methods for both continuous pricing and classless forecasting and optimization. To determine their feasibility in practical situations, the methods were tested in the Passenger Origin Destination Simulator (PODS). Compared to many other stochastic simulation methods used in academic literature, PODS has several advantages. It allows a user to see the effects of competition on a revenue management method, as passengers generated by the simulator decide whether to buy at all, on which airline and at what price. Another advantage is that, rather than allowing the revenue management method to know with complete accuracy the distribution parameters of the forecast, the simulated RM method is dependent on a forecaster that, similarly to the real world, will not determine the demand distribution with perfect accuracy. By incorporating these elements, it is possible to determine whether proposed revenue management methods for continuous pricing have robustness against competition and uncertain demand.
1.4 Thesis Outline
The remainder of this thesis will be divided into five chapters. Chapter 2 will cover the literature existing on topics relevant to this thesis in revenue management. Topics covered will include forecasting, seat protection optimization methods, and fare quotation methods that are relevant to testing continuous pricing methods. Chapter 3 detail the forecasting and optimization methods that will be examined in this thesis. Chapter 4 will discuss the PODS software
Forecasting and Optimization
Pr icin g/Dis tr ib u tion Class-Based Classless Fixe d Pr ice Poin ts
Traditional Class-Based RM Classless RM for Fixed Price Points
Contin
u
ou
s
Class-Based RM for Continuous Pricing
Classless RM for Continuous Pricing
methodology to be used for testing the proposed methods for continuous pricing as well as discussing the network primarily being used for testing in this thesis. Chapter 5 will then present the results of the tests as well as perform an analysis of those results. This chapter will compare traditional class-based, continuously priced class-based, and classless optimization methods. Lastly, Chapter 6 will summarize the thesis as well as discuss potential future work.
Chapter 2: Literature Review
This chapter will review the literature available concerning continuous pricing pertaining to this thesis. This chapter is split into three sections, each one pertaining to the major part of a revenue management system: forecasting, seat protection optimization, and fare quotation. Each section will discuss past research pertaining to topics discussed in this thesis in order to provide a framework to work within. The forecasting and seat protection optimization sections will discuss the literature that forms the framework for the forecasting and seat protection optimization methods for continuous pricing being discussed in this thesis. The fare quotation section will discuss the basis of the framework for dynamic pricing, of which continuous pricing is a component, as well as discussing literature on previous attempts at continuous pricing.
2.1 Forecasting Methods
Demand forecasting is a crucial component of nearly any revenue management system. While a great deal of work has been put into studying optimal seat protection methods, these methods depend heavily in practical application on an accurate demand forecasting method. The forecasting methods used for testing the continuous pricing methods in this thesis will be discussed in the following sub-sections.
2.1.1 Pick-up Forecasting
Pick-up forecasting is a simple but useful forecasting method. At each time frame during the booking process, pick-up forecasting combines two elements to generate an expected total forecast for each origin-destination itinerary fare class. The first element is the number of bookings currently made for each fare class at the time frame in question. The second element involves determining how much demand is still expected to come based on historical booking data. By summing these two values, a total forecast for a flight is generated. For a thorough explanation of pick-up forecasting, see Gorin (2000).
It is not possible to estimate demand still to come based strictly on the average number of bookings that are made from the current time frame until departure, since the number of such bookings made is often constrained by availability of fare classes. As a result, the historical booking data must be detruncated. The method used for the experiments discussed in this thesis is known as expectation maximization (EM).
EM is an iterative, statistical approach to detruncation. In each iteration, EM produces a new estimate of demand in each closed observation by calculating the mean of a truncated normal distribution with a normal mean and variance from the recorded open observation bookings and the previous iteration’s estimated closed observation demands. The lower tail of the distribution is truncated for each closed observation by the number of recorded bookings in said closed observation. After each iteration, the new estimates of demand for closed observations replace the previous iteration’s estimates in the normal distribution, and this process is repeated until the estimates converge. An in-depth analysis of EM and other detruncation processes can be found in Weatherford & Pölt (2002).
2.1.2 Q-Forecasting
Pick-up forecasting is an effective forecasting tool when demand is independent for each individual fare class. While, in a fully restricted fare structure, this assumption can be a good approximation for how demand actually behaves, once restrictions are removed, any semblance of independent fare class demand being a reality disappears. In fact, in a fully unrestricted fare structure, fare class demands are dependent, as, in the absence of restrictions, passengers will always buy the lowest fare. When pick-up forecasting interacts with an unrestricted fare structure, an effect known as spiral-down occurs.
Since, for pick-up forecasting, expected bookings for each individual fare class are based on historical bookings in that fare class, the fact that bookings in unrestricted fare structures will always trend to lower fare classes, even if passengers might be willing to pay more, causes pick-up forecasting to over-report forecasts in lower classes and under report in higher classes. This then leads to the seat protection method to allow greater availability of lower value seats, which causes more seats to be sold in the lower value fare classes. This drives the forecasts generated by the pick-up method even lower, which leads to even greater availability of lower value seats. This cycle of forecaster and seat protection method driving protection levels lower and lower is known as spiral-down, and is illustrated in Figure 2-1. For a more detailed look at spiral-down its effects, see Cooper et al. (2006) and Cléaz-Savoyen (2005).
In order to overcome spiral-down, forecasting methods for use in unrestricted fare structures need to consider not what passengers have paid in the past, but rather what passengers will be willing to pay. Q-Forecasting was developed by Belobaba & Hopperstad (2004) to fulfill this task. Q-Forecasting works by taking historical bookings, and converting all of the bookings in the forecast into an equivalent number of Q-equivalent, or lowest-class equivalent, bookings. This conversion takes into account the complete lack of independence of fare class demand in an unrestricted fare structure.
In order to convert a fare class booking into an equivalent number of Q-Bookings, the sell-up rate from the lowest class to a given class must be estimated. Essentially, the question being asked by the conversion is how many passengers willing to pay at least the lowest fare are there for every passenger willing to pay the higher fare. Once the sell-up rate is estimated, it is a simple matter of dividing the historical bookings forecast by the sell-up rate from the lowest fare class to determine the equivalent number of Q-Bookings. It is worth noting that this sell-up rate and willingness-to-pay generally increase as departure approaches as a result of business passengers, who generally have a higher willingness-to-pay, arriving later in the booking process. While there are several methods for modeling sell-up (Cléaz-Savoyen, 2005), the one used in this thesis’s Forecasting will be a negative exponential distribution. Once the equivalent number of Q-Bookings has been determined, the forecasts are then detruncated and are then partitioned back
into the original fare classes, once again using the sell-up rate, to determine a forecast that resists spiral-down. The algorithm for Q-Forecasting will be further discussed in Chapter 3 of this paper.
2.2 Fare Adjustment
Q-Forecasting is an effective counter against spiral-down, but it does nothing to counteract another issue that arises from the fact passengers will still only buy the lowest fare class available in an unrestricted fare structure. In addition to causing spiral-down, the non-independence of demand in unrestricted fare structures causes another issue that does not occur in fully restricted fare structures with independent demand.
When demand for each fare class is independent, there is sometimes reason to make some lower fare classes unavailable regardless of if they would typically be available according to the seat protection optimizer. On an aircraft with infinite capacity, it would only ever make sense to have all fare classes available in a restricted fare structure, as opening the lower fare classes would only accommodate more demand without impacting the demand with higher willingness-to-pay. Without the independence of demand afforded by a restricted fare structure, however, opening up lower fare classes, even on aircraft with infinite capacity, may actually lead to a decrease in revenue as a result of passengers who were willing to buy the higher class fares now buying down to the lowest available fare class.
As most seat protection models assume independent demand, it is necessary to have some way of accounting for this effect of non-independence of demand in an unrestricted fare structure, and Fiig et al. (2010) developed a method of “transforming the fare and the demand of a general discrete choice model to an equivalent independent choice model”. Fare adjustment, as developed by Fiig et al. (2010) counteracts the threat of buy-down by reducing the fares as input into the seat protection optimizer to account for the opportunity cost of selling the seat. This opportunity cost is modeled as the marginal revenue of said seat. Further details on the fare adjustment algorithm can be found in Chapter 3.
2.3 Seat Protection Models
After the forecasting component, next step in most revenue management systems is seat protection. The seat protection step is the step where a revenue management system decides what seats to make available at what fares.
Seat protection models can be divided into two types: booking limit and bidprice controls. Booking limit methods decide how many seats to assign as available for each fare class, while bidprice controls set a threshold price to decide whether or not a fare class is available. Bidprices, or the expected value of the last seat on an aircraft, are often used as the minimum fare in the latter method, in which case the method is often referred to as a bidprice control method.
Another, and perhaps more useful, way to divide seat protection methods is into leg-based and origin-destination models. Leg-based models are conceptually and algorithmically simpler than origin-destination models, since, as their name implies, they aim to determine the optimal seat protections for each leg. However, only focusing on individual legs causes issues when deciding on protection levels for passenger itineraries that traverse multiple legs, as leg-based models have no way of determining whether allowing a passenger to travel in one seat on each of two legs is more valuable than allowing two single-leg passenger to travel in those seats on each leg. More information about the potential downsides of leg-based seat protection methods in a connecting flight network can be found in Belobaba et al. (2016).
2.3.1 Leg-Based Protection Methods
Leg-based protection models are the framework for most seat protection methods, as network-based models, which will be discussed in the next section, are often adaptations of leg-based models to work in a multiple leg network. The first practical model for seat protection came from Littlewood (1972), who showed that the optimal level of availability could be determined for two fare classes by using the expected marginal revenue, which would be determined from the forecast demand for each class, of each seat strictly reserved for the higher-priced fare class. The model developed by Littlewood (1972), which is a booking limit model, is provably optimal for a two fare class structure where the lowest fare paying passengers arrive first, but has no provisions to handle fare structures with more than two classes.
In order to extend Littlewood (1972)’s solution to a general solution, Belobaba (1987) introduced the expected marginal seat revenue method (EMSR), a heuristic that can determine protection levels for any number of fare classes. EMSR was later improved by Belobaba (1992) to a variant known as EMSRb, also a heuristic, which has since become widely used for leg-based seat protection determination. The key feature of EMSRb is that seat allocations for a fare class 𝑛 are determined based on nested demands and fares for class 𝑛 and all classes with higher fares,
and then any seats protected for class 𝑛 are also available to any fare class with higher fares. The purpose of this joint protection is so that, in the event that a higher fare paying passenger arrives when a lower paying passenger was expected, the higher fare passenger is not turned away. A visualization of joint protection/allocation is provided in Figure 2-2.
While EMSRb is a popular leg-based seat protection method, it is also what might be considered a static method. The solution provided is only a heuristic for optimality, and assumes passengers arrive in the assumed order of lowest fare paying to highest fare paying. While this is in practice addressed through frequent re-optimization, rerunning the EMSRb algorithm throughout the booking process, dynamic programming (DP) methods, which could provide seat optimization solutions for any combination of time remaining until departure and passenger arrival order, might also be considered for the optimization step. Lautenbacher & Stidham (1999) provides just such a DP.
Lautenbacher’s DP, which can be applied as a bidprice control or seat allocation method, divides the booking window into a finite number of time slices, each of which is assumed to have no more than one arriving passenger. In each time slice, acceptance or rejection of a booking request is determined based on remaining time until departure and present capacity. By solving the DP recursively backwards from departure, seat protection allocations and bidprices for every capacity and time slice combination are determined. By having these allocations and bidprices, the
DP still provides a solution without reoptimization even if a high-paying passenger arrives earlier in the booking process than expected.
2.3.2 Origin-Destination RM Optimization Methods
As previously mentioned, the issue with attempting to strictly use leg-based protection methods is how to value an itinerary traversing two legs compared to two separate local itineraries on each leg. Most origin-destination methods developed, therefore, have tried to in some way account for this by reducing the optimization value of multi-leg itinerary fares to represent the fact that they take up space on multiple flights rather than just one. Williamson (1992) discusses many different methods of decrementing multi-leg itinerary fares, but a frequently used option is to solve a network linear program maximizing revenue for an entire network as if demand were deterministic.
While seat allocations obtained from doing so are unusable as controls in practice, the resulting shadow prices from the network LP are a decent estimation of how much one seat is worth on a capacity constrained flight. These shadow prices can then be used to decrement multi-leg itinerary fares to account for their extra displacement compared to multi-leg-based fares. With the decrements in place, leg-based seat protection methods, such as the aforementioned EMSRb or Lautenbacher DP become usable. Typically, however, demands for individual origin-destination itinerary fares are too small for EMSRb to generate useful seat protection levels. This can be handled by implementing a fare bucketing system such as the one developed by Smith & Penn in 1988, where fares are of similar network values are grouped together for the process of determining fare class availability.
As an alternative to decrementing multi-leg fares for optimization purposes, it is also possible to prorate them across the legs they traverse. Bratu (1998) developed a method of doing so, known as ProBP, where network fares are iteratively prorated across multiple legs using bidprices generated from the EMSRb method on each leg. Theoretically, one major advantage ProBP would have over the previously mentioned decrementing methods would be that the proration method accounts for the variability of demand in calculating its bidprices. The bidprices generated from this proration method can be used to decrement fares, similar to the shadow prices from the deterministic linear program, or, alternatively, these bidprices could be used directly in a
bidprice control method. It is the latter of the options, the bidprice control method, which will be used in this thesis.
2.3.3 Theoretical Optimality versus Practicality
It is worth noting that, for all of the theory about what theoretical advantages one method of seat protection has over another, these advantages often do not materialize when used in practical scenarios.
As one example of theory versus practice, while EMSRb is a heuristic solution, an optimal extension of Littlewood (1972) beyond two fare classes was determined around the same time as EMSR and EMSRb (Brumelle and McGill, 1993). However, in addition to being computationally difficult for its day when EMSRb was relatively simple, simulations showed that even the original EMSR method may be better than this method, known as OBL, in practical scenarios (Belobaba, 1992). Even though the OBL is theoretically better than EMSRb, it still makes some limiting assumptions. Like EMSRb, OBL assumes that the lowest fare class passengers arrive first and that willingness-to-pay then increases until the most expensive passengers arrive right before departure. This assumption, while based on general trends, is not strictly true in reality as some price-sensitive passengers will not look for a flight until very close to departure and some less price-sensitive passengers will finalize their plans long before departure, and, as a result, the advantage OBL had of being an optimal solution rather than a heuristic is lost. While situations such as higher paying passengers arriving earlier than expected during the booking process can and are generally addressed by rerunning the seat protection method, OBL required far too many re-optimizations to be considered usable. EMSRb was the more practical solution, even if it was not theoretically optimal.
A similar issue of theoretical optimality not transferring to practical performance has also been reported with DP-based revenue management. Since the Lautenbacher DP mentioned previously provides a solution for any arrival order of passengers, one might expect it to constantly outperform EMSRb for revenue. However, this has been shown to not necessarily be the case by Belobaba & Diwan (2010). In this case, the issue is two-fold. Firstly, the nature of the Lautenbacher DP is that it assumes a Poisson variance in its demand, which research has shown is not generally the case for demand variance in the real-world (Belobaba & Diwan, 2010). Secondly, and perhaps more importantly, the Lautenbacher DP is only provably optimal when the demand
profile is known. As will be shown later, in more realistic simulations, the forecast demand is generally not completely reflective of the actual true demand. This particular issue with assumed knowledge of demand in theoretical work is frequently a major barrier between theoretical revenue management and practical implementations.
2.4 Fare Quote Generation
The last component of a revenue management system is fare quote generation. This is the step where a revenue management system picks what price to offer to prospective passengers. This can be as simple as simply quoting the price from the filed fare to the passenger, or it can be a more complicated process.
“Dynamic pricing” has become a popular phrase in the airline industry, although there is no consensus on what the term actually means. For the purpose of this thesis, the following definition will be used: “Firms practice dynamic pricing when they charge different customers different prices for the same product, as a function of an observable state of nature” (Wittman & Belobaba, 2018). This definition extends the dynamic pricing term to encompass nearly any revenue management method that controls fare class availability. Even an incredibly basic method, like arbitrarily deciding that 50% of the seats on the aircraft should be reserved for one fare class and the other 50% to another would fall under dynamic pricing by this definition since the price being is different for the two sets of customers, the product is the same, and the differences are based on an observable state of nature, which is how full the aircraft is. In addition to defining dynamic pricing, Wittman & Belobaba (2018) also define three mechanisms to implement dynamic pricing: assortment optimization, dynamic price adjustment, and continuous pricing.
Assortment optimization, defined as firms selecting prices from a finite set of prices (Wittman & Belobaba, 2018), is the category under which the previously discussed revenue management mechanisms described fall. The nature of Global Distribution Systems (GDSs), with their limited capabilities, has largely constrained practical revenue management to using assortment optimization mechanisms (Westermann, 2013). As a result, most of the research into revenue management have been into methods with this type of fare quotation. The previously discussed EMSR and Lautenbacher DP are part of this category. The introduction of New Distribution Capability, however, has made possible the widespread use of revenue management methods reliant on other types of dynamic pricing.
Another mechanism of dynamic pricing is to take the set of price points from assortment optimization and then to adjust those prices based on the observable state of nature. This is the definition of dynamic price adjustment (Wittman & Belobaba, 2018). The concept behind dynamic price adjustment is to give airlines greater flexibility in the prices they can offer, while still working within the existing revenue management systems to some extent. The effects of this form of dynamic pricing have been researched, although much of the research has not considered practical scenarios with competition and unknown demand. Research into more practical scenarios has indicated that, by using conditional willingness-to-pay models, revenue can be increased through the implementation of dynamic price adjustment (Wittman, 2018).
The third type of dynamic pricing, continuous pricing, eliminates the finite set of possible prices altogether and instead selects fares from a continuous price range (Wittman & Belobaba, 2018). Conceptually, this is a “cleaner” mechanism than dynamic price adjustment. Allowing a continuous range of fares allows price to be adjusted freely with the observable state of nature, and it is in this category that the new revenue management methods being discussed in this thesis fall. The fare optimization solution that maximizes revenue for a single flight with no competition and undifferentiated products has been determined when demand is Poisson (Gallego & van Ryzin, 1994). This single leg solution was later extended into a network solution (Gallego & van Ryzin, 1997), although the network solution is impossible to solve for any cases other than deterministic ones owing to the rate at which the complexity of the solution would grow. The solution provided by Gallego and van Ryzin is a DP similar to the Lautenbacher DP.
While there has been a good deal of research into continuous pricing methods, there are several issues with transferring the theoretical research into a practical method. Similar to the aforementioned issues of seat protection algorithm optimality, the Gallego and van Ryzin papers make two critical assumptions. Firstly, they assume that the demand profile is known by the airline, and, secondly, they focus on an airline operating without competition in the market. Neither of those assumptions is very realistic, and, as previously discussed, theoretical models often do not perform as well as heuristics when key assumptions are removed In assortment optimization cases, dynamic-programs, which are theoretically better, often perform worse than a frequently re-optimized static solution. For continuous pricing, however, there is no research concerning optimal models and heuristics in more realistic scenarios, and there are very few sources with any
comparisons between a continuous pricing model and other fare quotation methods, even in the more idealized scenario.
One source that does compare continuous pricing with other methods is Zhang & Lu (2013). In addition to comparing multiple fare quotation strategies, Zhang & Lu (2013) also raises the issue of a network DP being too hard to solve by using a DP decomposition to approximate the DP. Zhang & Lu (2013)’s results do show that compared to several other methods, the continuous pricing model can increase revenue. However, like Gallego & van Ryzin (1994 & 1997) before it, Zhang & Lu (2013) still makes the two critical assumptions of known demand distribution parameters and non-competitive market scenarios.
2.5 Summary
This chapter documented the existing literature on three major parts of a revenue management system. It began by discussing forecasting, explaining pick-up forecasting and then discussing how Q-Forecasting and fare adjustment can be applied to pick-up forecasting to prevent spiral-down and buy-down. Next, seat protection methods were discussed. Both leg-based and origin-destination protection methods were examined, and it was discussed how theoretical optimality does not always yield a practical solution as result of assumptions made by the protection methods. Lastly, in a discussion of generating fare quotes, the idea of how nearly all revenue management involves some form of dynamic pricing, as defined by Wittman & Belobaba (2018) was established and previous attempts at continuous pricing were discussed in greater detail. In the next chapter, the forecasting and seat protection optimization algorithms that are used for the continuous pricing methods being examined in this thesis will be discussed in greater detail.
Chapter 3: Revenue Management Models for Continuous Pricing
In order to fulfil the purpose of this thesis, the analysis of several different new methods of revenue management (RM) for continuous pricing, it is necessary to review pertinent components of said RM methods. First, the forecasting methods relevant to the RM methods for continuous pricing will be described and explained. Second, the traditional class-based seat protection optimization models on which the RM methods for continuous pricing were based will be discussed, before then introducing the new methods of class-based and classless RM for continuous pricing.3.1 Forecasting
A key component of RM is demand forecasting. Forecasts are used by the optimizer to determine fare availability. Typically, forecasts are generated from historical booking data for each origin-destination itinerary fare class (ODIF) according to different parameters such as day of the week and season of the year. The challenge for forecasting is to accurately determine how passenger purchasing behavior will be distributed, something that is made more challenging in the restriction-free fare structures that the continuous pricing methods considered in this thesis rely on.
3.1.1 Fare Restrictions
Restrictions, which include rules such as requiring passengers to purchase a round-trip ticket or stay a minimum number of nights, are a fundamental part of most airline fare structures. By applying more restrictions to the lowest priced fare classes, airlines are able to encourage passengers for whom the restrictions have a higher disutility to purchase more expensive fare classes.
While restrictions are generally useful in RM, the methods for continuous pricing considered in this thesis are not capable of employing them. All of the methods to be discussed are designed to offer one fare calculated to be revenue optimizing at any given time. While it would, in theory, be possible to develop continuous pricing methods with multiple offered fares, the complexity of the algorithms needed to do so would be very high compared to the single-fare methods. A single-fare continuous pricing method only needs to optimize its price with respect to the demand and capacity at a given time, while a multiple-fare method would need to optimize its
prices with respect to not only the demand and capacity but with respect to each other. This necessary lack of restrictions for continuous pricing methods in turn influences the forecasting method used.
3.1.2 Q-Forecasting
A standard method for RM forecasting is to base forecasts on historical booking data. This is what the pick-up method of forecasting, used in the research for this thesis, uses. Put most simply, pick-up forecasting estimates how many bookings are expected from a given time frame to departure (L’Heureux, 1986). Pick-up forecasting does not take into account passengers who have already booked when projecting the number of expected remaining bookings-to-come.
In the absence of restrictions, the standard forecasting method does not function as effectively on its own. The standard forecasting model treats demand for each class as independent, and, while this is not entirely true in a restricted fare structure, the restrictions do separate the demand to some extent. Without the restrictions, any arriving demand will only ever purchase the lowest available fare, as there is no incentive for passengers to buy higher fares. Since forecasts are based on historical booking data, using standard forecasting will constantly see higher demand in lower fare classes and lower demand in higher fare classes. This causes the RM optimizer to allow greater lower class availability, which then in turn induces an even more skewed forecast. This feedback loop repeats until availability for lower fares is far higher than it should be and revenue is severely diminished. This effect is known as “spiral-down” (Cooper et al., 2006), and it requires a modification to the forecasting method to counter it.
One counter to spiral-down in unrestricted fare structures is known as Q-Forecasting (Belobaba & Hopperstad, 2004). On the broadest level, Q-Forecasting works by accounting for the fact that demands for each fare class are not independent (and, for completely unrestricted fare structures, there is no independence of demand for each fare class). Q-Forecasting converts historical bookings in each fare class into an equivalent number of bookings in the lowest fare class, which is denoted as “Class” in this thesis. Pick-up forecasting can then be used on the Q-Class bookings and the forecast detruncated to determine the forecast the lowest fare class. This forecast can then be partitioned into forecast bookings in higher fare classes.
The fare class conversions for Q-Forecasting are performed using sell-up estimations. The method of estimating sell-up that will be used in this thesis is an exponential distribution
constructed as follows. At a given time frame in the booking process, an estimate of the fare ratio between the lowest fare class fare and the fare which 50% of passengers will sell-up from the lowest fare to is input into the forecaster. This fare ratio estimate, known as the FRAT5 value, is typically user defined, although attempts have been made to estimate FRAT5 curves from data about passenger behavior. This FRAT5 value is then used to generate an estimate of the probability of sell-up from the lowest fare class (𝑄) to each fare class 𝑗, 𝑃Sup𝑗, in the following exponential distribution:
𝑃Sup𝑗 = 𝑒
ln(0.5)(fare𝑗−fare𝑄)
(FRAT5−1)(fare𝑄)
Q-Forecasting can then use this probability distribution to convert historical bookings for all fare classes into an equivalent number of Q-Bookings (Book𝑄𝑒𝑞):
Book𝑄𝑒𝑞 = ∑Book𝑗 𝑃Sup𝑗
𝑄
𝑗=1
It is sometimes desirable to, in practice, limit the amount any one booking may be scaled to eliminate outliers that may disproportionately affect the booking data. When this maximum scaling limit, known here as XSCL, is applied, the bookings conversion equation becomes:
Book𝑄𝑒𝑞 = ∑ min (Book𝑗
𝑃Sup𝑗 , Book𝑗∗ XSCL)
𝑄
𝑗=1
After applying detruncation and pick-up forecasting to the Q-bookings, a repartitioning step can then convert the volume of forecasted Q-Bookings for a specific future departure date back into the original fare classes. However, unlike the initial historical booking data, which was based on how passengers booked in the past, the repartitioning distributes the forecast based the willingness-to-pay (WTP) estimate.
Forecast𝑗 = Book𝑄𝑒𝑞(𝑃𝑆𝑢𝑝𝑗 − 𝑃𝑆𝑢𝑝𝑗−1) , ∀𝑓
An example of Q-Forecasting is shown in Table 3-1 (with a FRAT5 of 1.5 and without any maximum scaling limit):
Fare Avg. Bookings Sell-up Prob. Q-Bookings Partition Forecast $600 0.000 0.001 0.000 0.001 0.047 $500 0.000 0.004 0.000 0.003 0.141 $400 0.000 0.016 0.000 0.012 0.563 $325 0.000 0.044 0.000 0.029 1.371 $250 1.000 0.125 8.000 0.081 3.879 $200 3.000 0.250 12.000 0.125 6.000 $150 8.000 0.500 16.000 0.250 12.000 $100 12.000 1.000 12.000 0.500 24.000 Total 24.000 48.000
Table 3-1: Q-Forecasting Example (Belobaba and Liotta, 2017)
This repartitioning step is the critical element that makes Q-Forecasting resistant to spiral-down. As forecasts are based on how the bookings should be distributed based on an expected WTP estimate rather than how they are distributed, it prevents a skewing towards lower-value fares from occurring. It is possible to overestimate the WTP of passengers and instead make the higher-fare forecasts too high, but a good FRAT5 value will control the forecast scaling well. 3.1.2.1 FRAT5 Curves
A good general assumption, based on empirical observation, is that leisure passengers, who have lower WTPs, arrive earlier in the booking process and that business passengers, who have higher WTPs, arrive later. As a result, the overall WTP of the arriving passengers will increase as departure nears. In order to account for this, FRAT5 values should generally increase with each time frame as departure nears. This is achieved through the creation of FRAT5 curves, which specify the FRAT5 value for every time frame. In the simulation software used to test the continuous pricing methods, WTP varies with assumed network and passenger characteristics, and, as a result, FRAT5 curves are selected for the simulations through trial-and-error until which curve results in the most revenue is determined. The FRAT5 curves particular to the networks used to simulate the RM methods for continuous pricing will be discussed in Chapter 4.
3.1.3 Summary
Since the RM methods for continuous pricing to be presented require that only one price be offered at a time, all compatible fare structures must be unrestricted. As a result, forecasting for continuous pricing requires Q-Forecasting to prevent spiral-down. With the proper WTP estimation parameters, Q-Forecasting allows for better performance of the seat protection optimizer.
3.2 Seat Protection Optimization
After forecasting, the next step in RM is to use the forecasts to determine seat protection levels. Traditionally, this has been done by using pre-defined fare classes to determine which of those classes, each with pre-defined prices, will be offered. Recently, however, methods that use continuous pricing, where the prices that may be offered are taken from a continuous range rather than prescribed discrete points, and methods that are classless, where the optimization step is not based on individual fare classes, have been suggested.
Two examples of this traditional class-based optimization for network RM, probabilistic bidprice (ProBP) control and unbucketed dynamic programming (UDP), will be described, followed by descriptions of using Class-Based ProBP and UDP for continuous pricing, and then followed by classless versions of ProBP and UDP, which also use continuous pricing. However, before discussing the methods of optimization, it is necessary to discuss fare adjustment, a component used in the optimization process to account for the unrestricted fare structure necessary for the methods of continuous pricing being tested.
3.2.1 Fare Adjustment
While Q-Forecasting is a good technique to prevent spiral-down from occurring, there is one further feature of unrestricted fare structures that it does not resolve. Namely, Q-Forecasting does not completely take into account that passengers will still only buy the lowest available fare at a given time. The Q-Forecast might project greater demand for higher fare classes, but if the existing RM optimizer still allows empty seats to fall to the lowest fare class then there will be nothing to stop passengers from buying seats in the lowest fare class. As a result, it is possible to add a further component that accounts for the fact that, when passengers choose one fare, they are not buying another higher-value fare that they might have been willing to buy. The way of addressing this used in this thesis is known as fare adjustment (Fiig et al., 2010).
Marginal revenue fare adjustment modifies the fares as specified in the fare structure by subtracting the price elasticity cost of a seat from the filed price of the seat (i.e. the marginal revenue of selling a seat). The formula for this is as follows (Fiig et al., 2010):
fare𝑗′ = fare𝑗−
fare𝑄(FRAT5 − 1)
The adjusted fares (fare𝑗′) are then what are used by class-based seat protection optimizers
in the RM process (classless methods do not need fare adjustment as there are no classes to protect demand for). The optimizer then performs its optimizations on the Q-Forecasts with the adjusted fares. Availability of fare classes at their filed values is based on their fare-adjusted values. 3.2.2 Traditional Class-Based Probabilistic Bidprice Method (ProBP)
To discuss ProBP (Bratu, 1998), it is first necessary to discuss EMSRb (Belobaba, 1992). As previously mentioned in Chapter 2, EMSRb is a common method of calculating protection levels for a given fare structure and forecast on a single leg. EMSRb is a heuristic approach which optimizes expected revenue by determining the proper joint protection levels for fare classes. In a less abstract sense, any seat protected for a fare class is jointly protected for any higher fare classes. The protections, therefore, are only against the lower-value fare classes. The number of seats jointly protected for each class and the classes above it is determined by calculating the point at which the expected marginal value of protecting an additional seat for said fare classes is equal to the value of the next lowest fare class. In a fare structure with 𝜇𝑖 mean demand, 𝜎𝑖 demand standard
deviation, and fare 𝑓𝑖 for each fare class 𝑖, the expected marginal revenue from protecting the πth
seat for classes 1 to 𝑛 is calculated as follows:
𝜇1,𝑛 = ∑ 𝜇𝑖 𝑛 𝑖=1 𝜎1,𝑛 = √∑ 𝜎𝑖2 𝑛 𝑖=1 𝑃1,𝑛(𝜋𝑛) = NormCDF(𝜋𝑛, 𝜇1,𝑛, 𝜎1,𝑛) 𝑓1,𝑛 = ∑ (𝑓𝑖∗ 𝜇𝑖) 𝑛 𝑖=1 𝜇1,𝑖 EMSR1,𝑛(𝜋𝑛) = 𝑓1,𝑛∗ 𝑃1,𝑛(𝜋𝑛)
To determine the joint protection level for classes 1 through 𝑛, the expected marginal seat revenue from the incremental seat being protected should be equal to the next class’s fare:
This equation can then be rearranged to find the protection level 𝜋𝑖:
𝜋𝑛 = invNorm (
𝑓𝑛+1
𝑓1,𝑛 , 𝜇1,𝑛, 𝜎1,𝑛)
In order to translate the protection levels into something usable for an RM and seat inventory control system, the protection levels are subtracted from the capacity to determine the booking limits for each class:
Limit𝑛 = Capacity − 𝜋𝑛−1
An example of EMSRb is shown in Table 3-2.
CAPACITY 135
JOINT DEMAND
BOOKING JOINT BOOKING
CLASS FARE MEAN SIGMA PROTECT LIMIT MEAN SIGMA AVG FARE
1 $ 670 12 7 6 135 12 7 $670.00 2 $ 550 17 8 23 129 29 10.6 $599.66 3 $ 420 10 6 37 112 39 12.2 $553.59 4 $ 310 22 9 62 98 61 15.2 $465.74 5 $ 220 27 10 95 73 88 18.2 $390.34 6 $ 140 47 14 40 135 22.9 $303.19 FORECAST DEMAND
Table 3-2: EMSRb Example (Belobaba et al., 2016, p. 111)
In addition to determining protection levels, there is one additional value that can be found from EMSRb which is of particular use to ProBP. This is the “critical EMSR” value, EMSRc, which is the expected marginal seat revenue of the last available seat on the aircraft. For 𝑛Capacity
being the last class where Limit𝑛 > 0:
EMSRc = EMSR1,𝑛Capacity(Capacity)
In the example from Table 3-2, the EMSRc value can be found as:
EMSRc = (1 − NormCDF(135, 135, 22.9)) ∗ $303.19 = $151.60
EMSRb leg/class booking limits are a very robust method when it comes to optimizing protection levels on a single leg. However, in a larger network with connecting passengers, EMSRb does not account for passenger paths that involve more than one leg. Any network