HAL Id: hal-00576879
https://hal.archives-ouvertes.fr/hal-00576879
Submitted on 15 Mar 2011
HAL is a multi-disciplinary open access
archive for the deposit and dissemination of
sci-entific research documents, whether they are
pub-lished or not. The documents may come from
teaching and research institutions in France or
abroad, or from public or private research centers.
L’archive ouverte pluridisciplinaire HAL, est
destinée au dépôt et à la diffusion de documents
scientifiques de niveau recherche, publiés ou non,
émanant des établissements d’enseignement et de
recherche français ou étrangers, des laboratoires
publics ou privés.
Evolution of magma conduits during the 1998-2000
eruptions of Piton de la Fournaise volcano, Réunion
Island
Yo Fukushima, Valérie Cayol, Durand Philippe, Massonnet Didier
To cite this version:
Yo Fukushima, Valérie Cayol, Durand Philippe, Massonnet Didier. Evolution of magma conduits
dur-ing the 1998-2000 eruptions of Piton de la Fournaise volcano, Réunion Island. Journal of Geophysical
Research : Solid Earth, American Geophysical Union, 2010, pp.B10204. �10.1029/2009JB007023,2010�.
�hal-00576879�
Evolution of magma conduits during the 1998–2000 eruptions of
Piton de la Fournaise volcano, R´
eunion Island
Y. Fukushima,
1V. Cayol,
2P. Durand,
3and D. Massonnet
3Abstract. At basaltic volcanoes, magma is transported to the surface through dikes
(magma-filled fractures), but the evolution of these dikes as eruptions proceed is rarely documented. In March 1998, after five and a half years of quiescence, Piton de la Four-naise volcano (R´eunion Island) entered into a new eruptive phase characterized by in-tense eruptive activity. Co-eruptive displacements recorded by interferometric synthetic aperture radar (InSAR) for the first five eruptions of the cycle are analyzed using 3-D boundary element models combined with a Monte Carlo inversion method. We show that the eruptions are associated with the emplacement of lateral dikes rooted at depths of less than about 1000 m, except for the first March 1998 event where an additional deeper source is required. The dikes are located above pre-eruptive seismic swarms. This is con-sistent with nearly-isotropic stress due to repeated dike intrusions and low confining pres-sure enhanced by the presence of pores in the shallowest 1000 m of the edifice. The vol-umes of the modeled dikes represent 17% of the volume of emitted lava, showing that exogenous growth plays a major role in building the volcano. By taking into account the pre-eruptive seismicity and tilt data together with the results of InSAR data modeling, we find that dikes first propagate vertically from a source region below sea level before being injected laterally at shallow depth. This behavior is consistent with the presence of levels of neutral buoyancy at shallow depth in the edifice.
1. Introduction
At basaltic volcanoes, eruptions often start from tensile failure of a relatively shallow magma reservoir and the injec-tion of magma into dikes [Robson and Barr , 1964]. When the dike reaches the ground surface, magma erupts, gen-erally creating fire fountains. The activity then gradually shifts to a circular vent from which the eruption may con-tinue for days, weeks, months or even years [Bruce and
Hup-pert , 1989, 1990; Ida, 1992]. The path taken by magma as
eruptions proceed can only be determined indirectly from the interpretation of continuous ground displacements [e.g.
Owen et al., 2000; Peltier et al., 2007], the observation
of micro-earthquakes preceding eruptions [e.g. Klein et al., 1987], or field observations of eroded volcanoes [e.g. Walker , 1986]. Unraveling this problem is essential to improving our ability to forecast eruptions and to assessing the the factors involved in the evolution of volcanic edifices.
Dikes, after their emplacement, solidify in the shallower portions of the volcanic edifice, producing permanent de-formation that can be recorded by temporally discontin-uous measurement techniques such as interferometric syn-thetic aperture radar (InSAR) and GPS campaign surveys. InSAR measures ground displacements over areas of thou-sands of square kilometers, with high spatial resolution and centimeter-level precision, enabling the detailed geometry of newly solidified dikes to be constrained [e.g. Cervelli et al., 2002; Froger et al., 2004; Fukushima et al., 2005; J´onsson
1Disaster Prevention Research Institute, Kyoto
University, Uji, Kyoto, Japan. Also at Department of Geophysics, Stanford University, Stanford, California.
2Laboratoire Magmas et Volcans, Univ. B. Pascal, CNRS
UMR 6524, Clermont-Ferrand, France.
3Centre National d’Etudes Spatiales, Toulouse, France.
Copyright 2010 by the American Geophysical Union. 0148-0227/10/$9.00
et al., 1999]. Ground displacements are measured with a
typical repeat time of a month, thus InSAR is comple-mentary to continuous ground-based geodetic measurements such as tilt or GPS [e.g. Aoki et al., 1999; Cervelli et al., 2002; Battaglia and Bach`elery, 2003; Peltier et al., 2005],
and to seismic measurements that can be used to track the injection of magma during eruption [e.g. Battaglia et al., 2005; Klein et al., 1987; Ryan, 1987a].
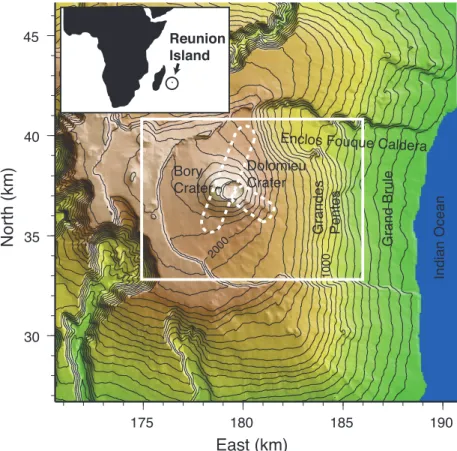
Piton de la Fournaise ((21.244◦S, 55.714◦E), Figure 1), a basaltic shield volcano located on R´eunion Island, is one of the most active volcanoes on Earth. In March 1998 an eruptive cycle started after five and a half years of unusual quiescence (see Peltier et al. [2009] for a summary). Since then, an average of 2.5 eruptions per year have occurred, including a voluminous eruption in April 2007 which culmi-nated in a 330 meter deep caldera collapse [Michon et al., 2007a]. This eruption might have ended this 10 year cy-cle. Most eruptions occur in the Enclos Fouqu´e caldera, an
8 km× 12 km U-shaped depression in which a 2600 m high
summit cone is located. The eruptive activity in the recent 1998–2007 period is characterized by fissure eruptions along two fracture zones having N25◦–30◦E and N120◦E trends [Michon et al., 2007b].
The volcano is very extensively monitored. The Observa-toire Volcanologique du Piton de la Fournaise (OVPF) oper-ated eight continuous tiltmeters, five extensometers and 19-20 seismometers between 1998 and 19-2000. The central area of the volcano is covered by recent lava flows, which favor the use of the InSAR technique, as this technique requires stable characteristics of the ground surface. The intense volcanic activity, together with the extensive monitoring, provide an excellent opportunity to study magma transport associated with fissure eruptions on this basaltic volcano.
Ground displacements are a linear function of the slip, or opening distribution, and a nonlinear function of the source (fracture) geometry. Therefore, the usual strategy for de-termining dike opening is to first determine the geometry and constant opening for a rectangular dike located in a homogeneous half space, and then to apply linear inversion techniques in order to determine the opening distribution of 1
30 35 40 45
N
o
rt
h
(km)
175 180 185 190East (km)
In d ia n O ce a n Dolomieu Crater G ra n d Bru le G ra n d e s Pe n te s 1 0 0 0 2000 Reunion IslandEnclos Fouque Caldera Bory
Crater
Figure 1. Location of R´eunion Island and geological features of Piton de la Fournaise volcano. The geographical coordinates of the summit are approximately (21.244◦S, 55.714◦E). Areas encircled with broken curves show N25◦–30◦E and N120◦E trends, along which most of the eruptive fissures appeared in the 1998–2007 eruptive cycle. Rectangle covers the areas shown in Figures 6 - 10. Contours are drawn every 100 m. Coordinates are given in kilometers and correspond to Gauss-Laborde R´eunion coordinates.
the previously determined dike [e.g. Amelung et al., 2000;
Aoki et al., 1999]. However, the fracture geometry is
gener-ally not independent of the opening distribution. Moreover, it is physically more appropriate to impose stresses rather than displacements [Zeller and Pollard , 1992]. Here, we use a boundary element method that takes into account a realis-tic topography. We assume that dikes have a quadrangular shape with nonuniform opening and shear dislocation distri-bution resulting from constant pressures (normal stresses) and null shear stresses imposed on the dike surfaces.
In this study, detailed characteristics of the dike-forming intrusions associated with the first five eruptions of the 1998 eruptive cycle are determined using the interferograms com-puted from SAR images recorded by the Canadian satellite RADARSAT-1. A method that combines a boundary ele-ment method and a Monte-Carlo and Bayesian inversion al-gorithm [Fukushima et al., 2005] is used to constrain and ap-praise the models. The results are interpreted together with pre-eruptive seismicity and tilt data, providing constraints on magma propagation both before and during eruption.
2. Data
Co-eruptive displacements associated with the first five eruptions of Piton de la Fournaise volcano since 1998 were mapped by 18 interferograms, computed from SAR images acquired by the RADARSAT-1 satellite, among which 10 were selected for this study (Table 1). The selection cri-teria were based on the altitude of ambiguity, which is an indicator of the relative sensitivity of interferometric phases to topography, and also of the spatial baseline phase decor-relation [e.g. Hanssen, 2001; Massonnet and Feigl , 1998]. For subtracting topographic phases, a 100 m× 100 m digi-tal elevation model (DEM) provided by the French Institut
G´eographique National was oversampled to 20 m× 20 m and used. The accuracy of this DEM is about two meters, which would produce no more than 2 mm of displacement artifact due to DEM errors for our interferometric pairs.
For two of the eruptions, images were acquired from more than two line-of-sight (LOS) directions, providing good constraints on the displacement field. The interferograms, shown below in section 4, indicate that the Piton de la Fournaise dike intrusions cause complex displacement pat-terns. We assume that the observed displacements are solely caused by dike intrusions. This assumption seems reason-able because interferometric signals are localized around the eruptive fissures so that any displacements due to magma reservoirs, if any, are much smaller, and because more than two interferograms (processed by using SAR data acquired on different dates) obtained for the same eruption show prac-tically identical displacement patterns within the noise level of a few centimeters.
We unwrapped the interferometric phases using the SNA-PHU software [Chen and Zebker , 2000]. When displacement gradients are large, fringes are narrow and normal appli-cation of the software leads to unsatisfactory results. To overcome this problem, an iterative unwrapping procedure based on SNAPHU was used [Fukushima et al., 2005]. Inter-ferograms of all the eruptions were successfully unwrapped except for that of the July 1999 eruption, which was of poor quality and was therefore unwrapped manually.
3. Methodology
To determine the characteristics of the dikes responsi-ble for the InSAR displacements, we used a method that
Table 1. Interferograms used in this study
Eruption Orbit* Period Line-of-Sight Vector Incidence Altitude of (DD.MM.YY) [East, North, Up] Angle (◦) Ambiguity (m) March 1998 D 30.04.97 – 30.07.98 [0.70, -0.19, 0.69] 47.1 348.0 July 1999 D 01.04.98 – 11.09.99 [0.70, -0.19, 0.69] 46.8 40.1 Sept. 1999 D 11.09.99 – 16.12.99 [0.70, -0.19, 0.69] 46.7 -162.6 Feb. 2000 A 07.02.00 – 13.05.00 [-0.63, -0.17, 0.76] 40.7 -272.9 A 14.12.99 – 19.03.00 [-0.69, -0.19, 0.70] 45.7 -130.4 D 22.10.99 – 25.05.00 [0.64, -0.17, 0.75] 41.8 -88.0 D 16.12.99 – 01.06.00 [0.70, -0.19, 0.69] 46.8 494.1 June 2000 A 13.05.00 – 30.06.00 [-0.63, -0.17, 0.76] 40.7 -190.4 A 19.03.00 – 03.09.00 [-0.69, -0.19, 0.70] 45.8 -55.2 D 08.05.00 – 25.06.00 [0.70, -0.19, 0.69] 46.6 53.8 *A: Ascending orbit, D: Descending orbit.
combines a mixed boundary element method (BEM) and a Monte Carlo inversion algorithm [Fukushima et al., 2005]. The mixed BEM [Cayol and Cornet , 1997] computes the three-dimensional displacements caused by sources such as tensile cracks, faults or reservoirs of arbitrary geometry located beneath realistic topography. The eastern flank of Piton de la Fournaise volcano has topographical slopes steeper than 20 degrees, and Fukushima et al. [2005] found that neglecting the topography resulted in poor modeling at depth and in overestimations of overpressure or opening, height (both about 30%), and volume (about 20%) of the modeled intrusion for their case study.
The medium is assumed to be linearly elastic, homo-geneous and isotropic. From seismic velocities [Brenguier
et al., 2007; Nercessian et al., 1996; Prˆono et al., 2009] and
in situ densities [Ran¸con et al., 1989], dynamic Young’s
mod-uli of 7.5 GPa and 25 GPa are calculated for depth ranges
Table 2. Dike model parameter names and definitions
P0 Overpressure (MPa)
δ Dip angle (◦)
ϕ Angle between the line connecting the top and bottom middle points and the dipping direction (◦)
h Elevation of the bottom middle point (m) ˜
L Length of the bottom side scaled to that of the top side
ψ Horizontal angle between the top and bottom sides (◦)
θ Vertical angle of the bottom side (◦)
d Along-dip height of the en echelon segments (m)
z z strike N E z
1
h
θ
d
L
~
Figure 2. Seven parameters that determine the dike model geometry. See Table 2 for the definitions of the parameters.
of 700–1300 m and 1300–1900 m respectively. Basaltic rocks are generally porous; Ryan [1987b] measured the porosity of basaltic rocks collected on the Big Island of Hawaii and found a range of 14.3–21.4%. The ratio of dynamic to static Young’s moduli is generally a function of porosity, and ex-periments performed by Cheng and Johnston [1981] predict the ratio to be from 0.1 to 0.4 for a depth range of 0– 2 km. Thus, an increase of the static Young’s modulus from 0.75 GPa (surface) to 10 GPa (2 km) would be expected. In this study, we assume the Young’s modulus to be 5 GPa, which is the mean value. While the homogeneous assump-tion (a constant Young’s modulus for all depths) imposes a bias on our results, this assumption makes BEM com-putations fast enough so that Monte-Carlo inversions, each of which requires thousands of forward computations, are manageable. The consequence of the homogenous
assump-N
Ground surface
Z
W
W
L
L
(X, Y, Z)
(X, Y)
(a)
(b)
Direction of
max. gradient
Figure 3. Parameters defining the geometry and loca-tion of a rectangular pressure source. See Table 3 for the definitions of the parameters. (a) Plane view. (b) Lateral view.
tion will be discussed later, in section 4.8. We also assume a Poisson’s ratio of 0.25.
A dike is assumed to be a quadrangle projected onto a curved plane. It is curved because eruptive fissures are, in general, not aligned in a straight line. The top is fixed for the moment to a smooth trajectory of en echelon eruptive fissures. The bottom can be a straight or curved line, and its position and geometry are determined by six parameters (Table 2, Figure 2). Three parameters, i.e., the dip angle δ, the angle between the line that connects the top and bottom middle points and the dipping direction ϕ, and the elevation of the bottom middle point h, determine the position of the bottom middle point. The other three parameters, i.e., the length of the bottom side scaled by that of the top side ˜L,
the horizontal angle between the top and bottom sides ψ, and the vertical angle of the bottom side θ, determine the position of the two end points of the bottom side. This pa-rameterization allows inversion searches to be restricted to mechanically plausible dike geometries.
Eruptive fissures associated with the five studied erup-tions have en echelon arrangements. Following Delaney and
Pollard [1981], we assume that the en echelon pattern is
caused by a rotation of the minimum principal stress close to the ground surface. We model the en echelon segments by dividing the basic quadrangle shape into a shallow and a deeper part, at a downdip distance d from the ground sur-face. The top of the en echelon segments is fixed at the location of the eruptive fissures observed and mapped by
Villeneuve [2000].
Dikes are further assumed to open in response to magma overpressure (the difference between the magma pressure and the normal stress exerted on the dike surface), which is assumed to be uniform over the whole dike surface. It is also assumed that there is no shear stress change on the dike surface. The BEM determines an opening distribution which meets these stress boundary conditions. While it may seem more reasonable to assume a depth-dependent or more complex overpressure model, we do not attempt to make such assumptions because; 1) an inversion (not presented in this paper) permitting a depth-gradient overpressure for the March 1998 northern dike resulted in a wide range of accept-able gradients from -0.013 to 0.010 MPa/m, indicating that the gradient can not be well constrained, and 2) we do not have a good a priori knowledge of the stress field, hence of the overpressure, of the shallowest part of the edifice.
Adding a constant overpressure to the seven geometrical parameters, we have a total of eight model parameters. This is comparable to the frequently-used rectangular dislocation model of Okada [1985], which has eight parameters (this re-duces to six if we fix the location of the intrusion as we do in our study). Yet, boundary element approaches have an advantage such that one can obtain opening distributions of dikes that are physically much more realistic [Cervelli et al., 2002; Fukushima et al., 2005; Zeller and Pollard , 1992].
For the analysis of the March 1998 eruption, we also use a rectangular intrusion model (Figure 3), which is described by nine parameters (Table 3). Three define the location
Table 3. Rectangular model parameter names and definitions
P0 Overpressure (MPa)
X East coordinate of the top middle point (km)
Y North coordinate of the top middle point (km)
Z Elevation of the top middle point (m)
δ Dip angle (◦)
α Strike angle (◦)
θ Vertical angle of the bottom side (◦)
L Length (m)
W Width (m)
(X, Y, Z), and five define the geometry (dip angle δ, strike angle α, vertical angle of the top and bottom sides θ, length
L, and width W ). The last parameter is a constant
over-pressure P0.
The topography mesh is constructed from the DEM used for the interferogram computations. The mesh is made fine close to the deformation sources and is coarsened in low deformation areas. To limit errors caused by the finite ex-tension of the ground surface mesh, its exex-tension is chosen to be five times the presumed deformation source dimensions. For inversions, dike meshing is automated.
We use the neighbourhood algorithm inversion method [Sambridge, 1999a, b], which consists of two stages: search and appraisal. In the search stage, good data-fitting regions of the model space are systematically explored, which al-lows for the identification of multiple minima. The data fit is evaluated through a misfit function written
χ2(m) = (uo− um)TCd−1(uo− um), (1) where uo and umare vectors of observed and modeled LOS displacements, respectively, and Cdis a data covariance ma-trix. When available, interferograms obtained for different LOS directions are simultaneously used in an inversion (see Table 1) by using the observed and modeled data vectors formed by concatenating the vectors for different interfero-grams.
The observed displacement vector uo is created by sub-sampling the unwrapped InSAR displacements. Subsam-pling is required in order to make the computations numeri-cally manageable. A previous study [Fukushima et al., 2005] compared several subsampling methods (a regular grid, a circular grid such that the point density is greatest close to the eruptive fissures, a quadtree type grid [e.g. J´onsson et al., 2002] and a grid where nodes correspond to ground
mesh modeling nodes) and concluded that an initial model can be equally well retrieved using these different methods when a full data covariance matrix was taken into account.
175 176 177 178 179 180 181 182 183 184 32 33 34 35 36 37 38 39 40 41 42 43 1 00 0 15 0 0 1500 1500 2000 2000 Mar 1998 Feb 2000 Jul 1999 Sep 1999 Jun 2000 Piton Kapor Hudson Crater East (km) N o rt h (km) Mar 1998 Mar 1998
Figure 4. Locations of the eruptive fissures for the five studied eruptions [Villeneuve, 2000]. Contour lines are drawn every 100 meters. Summit craters and Enclos Fouqu´e borders are outlined.
Fukushima et al. [2005] found that the random
fluctua-tion of atmospheric phase delay on Piton de la Fournaise can be appropriately modeled by an exponential autocorrelation function. The covariance of the i-th and j-th data points is therefore assumed to be
Cd(i, j) = Cd(j, i) = ϵ2exp (−
rij
a ). (2)
Here, ϵ2 and a are the variance and correlation distance,
respectively, and rij is the distance between the i-th and
j-th data points. The variance ϵ2 and correlation distance
a are set to plausible values based on the properties of the
residual data of preliminary inversion runs. If the residual data of an inversion have significantly different values of ϵ2
and a, then the parameters are adjusted and an inversion is rerun. The mean values of the variance and the correlation distance used by all the inversions presented in this paper are 5.5× 10⁻⁴ m2 and 826 m, respectively.
In the appraisal stage, the posterior probability den-sity function of the model parameters is computed by a Monte Carlo integration technique, using model misfit val-ues calculated in the search stage [Sambridge, 1999b]. Con-fidence intervals of model parameters can be obtained from one-dimensional marginal posterior probability density func-tions. More detailed description of the whole method is given in Fukushima et al. [2005]. The applicability of the method has been confirmed by synthetic tests [Fukushima
et al., 2005].
4. Applications to the 1998–2000 Eruptions
The five 1998-2000 eruptions occurred in an alternating spatial pattern (Figure 4), with eruptive fissures opening successively on the northern flank (March 1998), at the summit (July 1999), on the southern flank (Sept. 1999), returning to the northern flank (Feb. 2000), and then on the southeastern flank (June 2000). This section determines the models associated with these five eruptions using the method described in the previous section but with slight modifications to allow for adaptation to each problem. 4.1. Additional measures of model misfitsBecause the misfit function used in the inversions only gives an indication of the data fit of models relative to each other, we discuss the model fit using a more intuitive in-dicator, which is the percentage of explained data, defined as S(%) = { 1− ∑ i(u i o+ l− uim)2 ∑ i(u i o+ l)2 } × 100, (3)
where uio and uim are i-th elements of uo and um, respec-tively, l is a constant offset of interferometric data deter-mined in such a way that S is minimized.
We also use the Akaike’s Information Criterion (AIC) [Akaike, 1974] to compare different models explaining the same data set with different numbers of model parameters. From a statistical point of view, the model having the mini-mum AIC is the best model. The AIC for model m is defined by
AIC(m) =−2 log L(m) + 2n, (4) where L(m) and n are the likelihood for the model m and the number of model parameters, respectively. The likeli-hood can be written as
L(m) = (2π)−N/2|Cd|−1/2exp ( −χ2(m) 2 ) , (5)
where N is the number of data points and| · | denotes the determinant. Equations (4) and (5) leads to
AIC(m) = N log(2π) + log|Cd| + χ2(m) + 2n. (6)
4.2. Consideration of mechanical interactions When dikes intrude close to each other in space and time, they interact mechanically. A rule of thumb for mechanical interactions to be effective is that the distance between the sources is less than three times the greatest source dimen-sion [Jaeger et al., 2007]. The combined effect of the sources is treated in three different ways depending on the distance and time lag between the dike emplacements.
Case (a): Dikes intrude far from each other. In this case, the sources are assumed not to have mechanically interacted. An appropriate strategy is to then proceed using successive inversions, starting by first inverting displacements around one source, and next inverting the residuals for the other source (Figure 5a).
Case (b): Dikes are emplaced close to each other, but with a time lag long enough to allow the cooling and so-lidification of one source before the next one is emplaced. In this case, the second intrusion is influenced by the stress change due to the initial intrusion. Since we do not have a priori knowledge about the stress field, we assume here that the normal stress on the second dike surface is unper-turbed by the first one and neglect any stress interaction. We can not follow the strategy of Case (a), however, be-cause the displacements due to the two intrusions overlap. An appropriate inversion strategy for such a case is to gen-erate forward models by computing the contribution of each source independently and to sum the corresponding mod-eled displacements. Inversions are performed considering all source parameters simultaneously (Figure 5b).
Case (c): Dikes are close to each other and were em-placed shortly after one another. In this case, mechanical interactions probably took place. Inversions should be per-formed by simultaneously taking into account all sources in a single boundary element computation (Figure 5c).
(a) (b) (c)
Inversion 1st source
Inversion 2nd source using the residual
Simultaneous Inversion 1st BEM model 2nd BEM model Superimpose the displacements and compare with data
Simultaneous Inversion One BEM model taking into account the two sources
Figure 5. When several pressure sources are emplaced, different modeling strategies must be followed depending on the time lag between the emplacement of the different sources and their distances. (a) Pressure sources far from each other, (b) Sources are close to each other, but with sufficient time delay to allow the cooling of one source before the next is emplaced. (c) Sources close to each other and simultaneously emplaced.
The first case, where pressure sources are far from each other, allows the successive determination of a relatively large number of source model parameters, while the lat-ter two cases require either the number of paramelat-ters to be reduced or to tune the Monte-Carlo inversion search to be intense in a small area of the model space rather than a larger area. Intense exploration of a small area increases the risk for the solution to be caught in a local minimum. 4.3. The March 1998 Eruption
The March 1998 eruption occurred after five and a half years of quiescence and was the first of the new cycle of eruptions. Pre-eruptive micro-earthquakes, which started 36 hours before the onset of the eruption, clearly migrated from 5 km below sea level upward toward the summit [Battaglia
et al., 2005]. Summit deformation began about an hour
be-fore the eruption onset, when the hypocenters of the micro-earthquakes reached sea level. Lava was emitted from three sets of fissures (Figure 4). One of the northern flank fissures (the Piton Kapor vent) remained active for 6 months, until 21 September, and produced 6.0× 10⁷ m3 of lava making this eruption the second largest eruption of Piton de la Four-naise by volume in the 20th century. The two other sets of fissures opened on the southwestern flank (Hudson crater) and to the north, beyond the Enclos Fouqu´e. Geochemical analysis indicates that lava emitted on the south flank was rapidly transfered from mantle depths, whereas lava emitted on the northern flank had assimilated shallow level material [Vlast´elic et al., 2005].
Displacements associated with this eruption were mea-sured by one interferogram from the east (Table 1). At the time of the second image acquisition (30 July 1998), the eruption was still ongoing at Piton Kapor. However, an interferogram of the July 1999 event (Figure 8b), whose first image was taken on 1 April 1998, shows no global sig-nal corresponding to the eruptive vent of the 1998 eruption, indicating that most of the ground deformation associated with the 1998 eruption had occurred before 1 April 1998. No interferometric signal indicates deformation related to the eruptive fissures outside the Enclos Fouqu´e.
After testing different numbers of dikes with different ge-ometries, we have selected a model in which the displace-ments are caused by the sum of (1) an inflation of a deep sill-like body that accounts for the broad fringes located on the southern flank away from the eruptive fissures, (2) a dike beneath the northern eruptive fissures, and (3) a dike beneath the southwestern eruptive fissures. We assume that the sources are far enough from each other not to have in-teracted, and we follow the first inversion strategy (Figure 5a). Firstly, the sill source is modeled as a rectangle using the eight geometrical parameters given in Figure 3. The in-version search, using subsampled data in the broad-fringes region (white dots in Figure 6b), shows a sill dipping 30◦ to the southeast, located approximately 2000 m beneath the summit (Table 4, Figure 6a). Next, the residual data are subsampled around the northern dike, and are inverted for the northern dike (white dots in Figure 7b). The same pro-cedure is then applied to the southern dike (green dots in Figure 7b). The best-fit dikes are approximately 1 km high and dip eastward (seaward) at 36◦and 53◦for the northern and southwestern dikes, respectively (Table 4 and Figure 7a). Two to three residual fringes are present (Figure 7b), which suggests our model is oversimplified. The connection details between the sill and dikes are beyond the resolution of interferometric data.
This model is mechanically plausible. The broad inter-ferometric fringes are created by a sill-like inflating source at depth located above the magma source inferred from the analysis of inter-eruptive displacements [Peltier et al.,
2007, 2008]. The northern and southern dike heights are consistent with those determined for other eruptions, as ex-plained later. While we manage to obtain the same degree of data fit, and in fact a smaller AIC value (Table 5), with a two-dike model consisting of the northern and southwestern dikes only, the depth of the bottom of these dikes (-121 to 560 m and 51 to 926 m above sea level for the northern and southern dikes, respectively, at 90% confidence) is signifi-cantly greater than the dikes determined for the other tions. We attach importance to consistency with other erup-tions, rather than the number of model parameters needed to explain the data, and we prefer the three-source model as the model for this eruption.
Sigmundsson et al. [1999] and Battaglia and Bach`elery
[2003] applied a rectangular dislocation model of Okada [1985] to similar RADARSAT-1 interferometric data and continuous tilt data, respectively, and determined a dike model whose characteristics (dip, height and opening) were broadly consistent with our northern dike model. The sill-like inflation we determine is consistent with inversions of gravity data [Bonvalot et al., 2008], which showed the ob-servations could not be solely explained by the northern dike intrusion, but that an additional mass increase at sea level was required. None of these other models called for a dike at the location of the southwestern flank (Hudson Crater). Indeed, we determine that this dike corresponds to the small volume of magma of 0.3 Mm3, representing only 4% of the
volume intruded in the northern dike (3.2 Mm3) and the sea-level sill (4.9 Mm3). This explains why the data can be satisfactorily explained without this dike.
4.4. The July 1999 Eruption
On 19 July 1999, 50 minutes before the eruption onset, a seismic swarm at sea level as well as tilt and extensometric data anomalies, were detected by the OVPF monitoring net-work. En echelon eruptive fissures located within and east of the Dolomieu crater (Figure 4) emitted lava for three days. Then the activity paused for three days before new fissures formed 1 km farther to the southeast and emitted lava until 31 July.
Displacements associated with this eruption were mea-sured by one interferogram captured from the east of the volcano (Figure 8b). As the eruption proceeded in two steps, it is assumed that two dikes were emplaced during this eruption. Because dikes with thicknesses of one meter should solidify in three days [e.g. Parfitt and Wilson, 2008], we assume that the first dike had solidified by the time the second one was emplaced. Taking into account the fact that the dikes are close to each other, we adopt the second in-version strategy (Case (b), Figure 5b), i.e., a simultaneous inversion of two dikes with separate BEM computations for each dike. To make the inversion numerically feasible, we fix some parameters. Based on preliminary inversion results, the height of the segments connecting the summit dike to the surface (parameter d) is fixed to 200 m, resulting in seven parameters for this dike. The second dike geometry on the southeastern flank is assumed to be close to a rectangle with its top and bottom sides parallel to the topography, leaving four model parameters (dip angle δ, bottom elevation h, depth of the dike top d and overpressure P0) for this dike.
An inversion for all 11 parameters leads to a model that explains 96% of the data (Figure 8b). This model consists of a triangular dike, in which the width of the dike nar-rows with depth below the Dolomieu eruptive fissures and a 350 m high dike starting 254 m below the ground (Table 4 and Figure 8a).
4.5. The September 1999 Eruption
The 28 September 1999 eruption was characterized by an 80 minute long pre-eruptive seismic crisis and 50 minute long pre-eruptive deformation. Eruptive fissures opened from
the summit to the southern flank (Figure 4). The eruption ended 25 days later on 23 October, 1999.
Similar to the previous eruptions, displacements were only measured by one interferogram taken from the east of the volcano (Figure 9b). Based on preliminary inversions, the upper part of the quadrangle dike model is assumed to be entirely connected to the volcanic surface, and the bot-tom side of the dike is assumed to have the same curvature as the upper side, rather than being a straight line. The best-fit model explains 93% of the observed data. The dike has a mean hight of 250 m and is subvertical (Table 4).
As there are some residuals on the eastern side of the dike, and as the model-determined dike is about 1000 m above the pre-eruptive seismic swarm, the presence of a subverti-cal feeder dike is also investigated. It is found that a vertisubverti-cal dike (Figure 9a), whose bottom lies approximately 1000 m beneath the summit, slightly improves the data fit with 94% of the data explained (Figure 9b).
4.6. The February 2000 Eruption
The inversion results for the February 2000 eruption have already been published [Fukushima et al., 2005]. The loca-tion of the eruptive fissures is indicated on Figure 4. The inversion result is listed in Table 4. This eruption was asso-ciated with a single intrusion causing relatively less complex displacements, which allowed a straightforward application of the procedure described in section 3. The dike is inferred to be roughly trapezoidal, dipping seaward (61.0◦–67.3◦) with its bottom passing 800–1000 m beneath the summit. The model parameters were well constrained by using two interferograms from the west (ascending orbit) and two in-terferograms from the east (descending orbit).
4.7. The June 2000 Eruption
Unlike previous eruptions, increases in the seismicity rate and the deformation signal amplitudes started about two weeks before the eruption onset. On 23 June 2000, a seis-mic crisis occurred simultaneously with tilt changes. Both the seismicity and tilt changes indicated migration of an in-trusion toward the summit and the southeastern flank of the volcano, where two sets of eruptive fissures opened on 23 June. The activity quickly localized to the lower eruptive fissures and lasted until 30 July.
Three interferograms, two from the west and one from the east, captured the displacements associated with this erup-tion (Figure 10b). The original interferogram taken from the east shows altitude-correlated fringes, which are removed assuming an altitude-dependent phase model [Fukushima, 2005]. To simplify the modeling, each of the two sets of erup-tive fissures is approximated by continuous fissures. The three interferograms are first simultaneously inverted assum-ing a sassum-ingle dike model with the standard seven geometrical parameters and an overpressure. The best-fit dike model explains 74% of the data and its bottom is located 1300 m below the volcanic surface, parallel to the topography.
In order to improve the data fit, an along-dip curvature is additionally introduced in an inversion, resulting in nine parameters. The dike surface is assumed to be a parabola in the along-dip direction, and the curvature is defined by the angle between the line connecting top and bottom points and the tangential line of the parabola at the top and bot-tom points. This model explains 81% of the data, leaving four to five residual interferometric fringes for each direc-tion (Figure 10b). The geometry of the best-fit model is significantly curved in the along-dip direction (Figure 10a). Similar to the flat dike model, the bottom of the dike is lo-cated 1000–1300 m below the volcanic surface and is parallel to the topography. While curved dikes are not often found in the field, some have been identified in the exposure of the Cilaos dike complex at Piton des Neiges [Maillot , 1999], which is an older volcano located on the same island.
We have also tested a model with an additional curva-ture of the dike bottom in the direction normal to the dike surface as well as a two-dike model. The former model re-sults in practically the same inferred dike geometry as the “straight-bottom model” as is shown in Figure 10. The lat-ter model calls for our third inversion strategy (Figure 5c), i.e., a simultaneous inversion with dike interactions taken fully into account, resulting in a 14 parameter inversion (the full parametrization described in section 3 except for the height of the segmented part d which was fixed to zero for each dike). In order to achieve a solution convergence within an acceptable time, the number of models evaluated at each iteration n in the neighbourhood algorithm is set to five. The percentage of explained data (78%) is less than our single dike model. It should be noted that this two-dike inversion might have been caught in a local minimum be-cause of a small n, which still leaves open the possibility of having two dikes for this eruption.
The AIC value of the model with the along-dip curvature (Figure 10) is smaller than those of the standard quadran-gular shape and the two-dike model (Table 6), which leads us to select the single curved dike model as our preferred model. The relatively large residuals in Figure 10b suggest that the intrusion was more complex than we assumed. 4.8. Findings from the InSAR data inversions
Our inversion results commonly suggest laterally elon-gated shallow dikes (Figure 11). All the preferred dike mod-els are located shallower than 1300 m. The depth is gen-erally well constrained, with uncertainties (subscripts and superscripts for h in Table 4) within±300 m for most of the cases.
Even though we permitted an inclined bottom (deter-mined by θ; see Figure 2), our results indicate that the dike bottom is always parallel to the topographical slope. This seems reasonable because the stresses in the edifice are, in the first order, a function of depth. Indeed, for a ho-mogenous axisymmetrical edifice, gravitational stresses are strongly correlated to depth [Cayol and Cornet , 1998], rock density increases with depth as a result of increased contrac-tancy with confining pressure [Ryan, 1987a, b], and volcanic deposits are emplaced parallel to the edifice slope.
The observed interferograms for the March 1998 and June 2000 eruptions could not be fully explained. Among our as-sumptions, the homogeneity assumption is probably causing most of the unexplained fringes. Basaltic volcano edifices generally contain sizable pores and fractures that gradu-ally close as the depth increases because of increasing pres-sure [contractancy effect, Ryan, 1987a, b]. The contrac-tancy causes two similar effects; the effective Young’s mod-ulus at shallow depths, where porosity is large, is smaller than that at greater depths, and the confining pressure (hence the normal stress on the dike surface) increases non-linearly with depth in response to a gradual increase in den-sity with depth. Intrusions are more dilatant at shallower depths because of these two effects, i.e., the variation in the Young’s modulus [e.g. Bonafede and Rivalta, 1999; Brenner
and Gudmundsson, 2004; Morita et al., 1988; Rivalta et al.,
2005; Ryan, 1993] and the nonlinear increase in the confin-ing pressure [Morita et al., 1988; Ryan, 1993]. The fact that the residuals are larger for the deepest intrusions of March 1998 and June 2000 supports this speculation.
Best-fit values of overpressure estimated for the studied intrusions range from 0.7 to 6 MPa (Table 4). If we as-sume that these overpressure values are the consequence of the density difference between magma and rocks, the den-sity contrasts range from 70 to 600 kg/m3. This range is consistent with the density contrast expected between the fractured porous edifice (1600 kg/m3 [Gailler et al., 2009]
to 2300 kg/m3 [Rousset et al., 1989]), and basaltic mag-mas with densities ranging from 2200 kg/m3 (gas rich) to 2700 kg/m3 (degassed) [Bonvalot et al., 2008].
4.9. Contribution to the volcano growth
Table 7 shows a comparison of the erupted volumes
[Stau-dacher et al., 1998; Stau[Stau-dacher and Chemin´ee, 1999;
Stau-dacher et al., 1999, 2000] and intruded volumes estimated
from the preferred models determined for the March 1998 to June 2000 eruption. The total volume of the preferred dike models is 11.3× 10⁶ m3, representing 17% of the total vol-ume of erupted lava. This indicates that the growth of the volcano edifice was mainly exogenous during the 1998–2000 time period.
It would be expected, then, that the volcanic edifice would become relatively flat because of the dominant lava flows. However, the central cone of Piton de la Fournaise volcano has unusually steep slopes (exceeding 20◦) on its southeast-ern and eastsoutheast-ern flank. Michon et al. [2009] proposed that the central cone was initially built up as a strombolian cinder cone, and that repetitive dike intrusions later contributed to steepen the southeastern and eastern flank of the cone. In-deed, the slope changes (measured in the direction of max-imum gradient) predicted from our dike intrusion models (Figure 12) indicate that steepening of a few hundredth of a degree occurs east of the the N25◦–30◦E axis and north of the N120◦E axis, whereas the western part of the cone is hardly deformed.
The eruptions we analyzed occurred along the northern, southeastern and southern axes (Figures 1 and 4), and this is also the case for the other eruptions in the central cone in the past 30 years [Michon et al., 2009]. Repeated intru-sions along the same axes imply that the stress increases due to the intrusions are compensated by a process of stress relaxation. The U-shaped Enclos-Fouqu´e caldera as well as landslide deposits found on the submarine flank indicate that seaward movement of the eastern flank has taken place in a long timescale [e.g. Bach`elery , 1981; L´enat et al., 1989; Labazuy, 1996]. Recently, co-eruptive SAR interferograms
of the April 2007 eruption indicated seaward slips, of the order of a meter, along a subhorizontal decollement [Augier
et al., 2008]. It is likely that such episodic slips that occur
concurrently with eruptions (and hence with dike intrusions) relax normal stresses on the active axes so that subsequent dike intrusions can take place along them.
Observed
East (km)
N
o
rt
h
(km
)
176 178 180 182 184 34 36 38 40Modeled
East (km)
176 178 180 182 184Residual
East (km)
176 178 180 182 184(b)
34 35 36 37 38 39 40 41 0 2000 N o rt h (km) 176 178 180 182 −2000 −1000 0 1000 2000 East (km) 16 00 16 00 2000 20 00 24 00 2400 2000 Elevation (m)(a)
Figure 6. March 1998 eruption. (a) Geometry of the optimum rectangular pressure source obtained from inverting large-wavelength displacements, plotted with the relocated pre-eruption micro-earthquakes that occurred within the 36 hours preceeding the eruption onset (stars) [Battaglia, 2001]. (b) Observed, modeled and residual interferograms, corresponding to the model shown in (a). White dots indicate subsampled data points. One color cycle of white-yellow-blue-red-black corresponds to a displacement of 2.83 cm toward the satellite. Arrows indicate the surface projection of the LOS direction.
Observed
East (km)
N
o
rt
h
(km
)
176 178 180 182 184 34 36 38 40Modeled
East (km)
176 178 180 182 184Residual
East (km)
176 178 180 182 184(b)
(a)
176 178 180 182 −2000 −1000 0 1000 2000 East (km) 34 35 36 37 38 39 40 41 0 2000 1 60 0 16 00 2400 20 0 0 24 00 2000 2000 Elevation (m) N o rt h (km)Figure 7. March 1998 eruption. (a) Geometry of the optimum deep sill of Figure 6a and shallow dikes (Table 4) plotted with the relocated pre-eruptive micro-earthquakes that occurred within 36 hours be-fore the eruption onset (stars) [Battaglia, 2001]. (b)The modeled interferogram created from superposing the displacements associated with the three sources shown in (a) is compared with the observed data. White and green dots are the subsampled data points used to invert for the northern and southern dikes, respectively. See Figure 6b for the inverted data used to determine the sill.
Observed
East (km)
N
o
rt
h
(km
)
178 180 182 35 36 37 38 39Modeled
East (km)
178 180 182Residual
East (km)
178 180 182 35 36 37 38 39 1000 2000 177 178 179 180 181 182 183 0 1000 2000East (km)
1 60 0 20 00 24 00 24 00Elevation (m)
N
o
rt
h
(km)
(a)
(b)
Figure 8. July 1999 eruption. (a) Geometry of the optimum models obtained from a simultaneous inversion of the two dikes associated with the July 1999 eruption (Table 4). Stars are the relocated hypocenters of the pre-eruptive micro-earthquakes that occurred up to 50 minutes before the eruption onset [Battaglia, 2001]. (b) Observed, modeled and residual interferograms for the July 1999 eruption. The black lines indicate the eruptive fissures that are connected to the main dike below the Dolomieu crater, and the green line indicates the top of the second dike. White dots represent subsampled data points used in the inversion.
Observed
East (km)
N
o
rt
h
(km
)
176 178 180 182 34 36 38 40Modeled
East (km)
176 178 180 182Residual
East (km)
176 178 180 182(a)
(b)
176 178 180 182 0 1000 2000 East (km) 34 35 36 37 38 39 40 41 1000 2000 1 60 0 16 00 20 0 0 24 00 2000 2400 2000 N o rt h (km ) Elevation (m)Figure 9. September 1999 eruption. (a) Geometry of the optimum dike model and vertical feeding magma path rooted 1700 m above the sea level. Relocated pre-eruptive micro-earthquakes that occurred up to 80 minutes before the eruption onset [Battaglia, 2001] are shown as stars. (b) Observed, modeled and residual interferograms for the dike model shown in (a). The heart-shaped displacement pattern is well reproduced. White dots and black line indicate subsampled data points and the presumed eruptive fissure, respectively.
33 34 35 36 37 38 39 40 1000 2000 178 180 182 184 186 0 1000 2000 East (km) 16 0 0 20 00 24 00 2000 N o rt h (km) Elevation (m)
(a)
Asce
n
d
in
g
(4
5
.8
°)
D
e
sce
n
d
in
g
Asce
n
d
in
g
(4
0
.7
°)
N o rt h (km) 34 36 38 40 East (km) N o rt h (km) 178 180 182 184 186 34 36 38 40 East (km) 178 180 182 184 186 East (km) 178 180 182 184 186 Observed N o rt h (km ) 34 36 38 40 Modeled Residual(b)
Figure 10. June 2000 eruption. (a) Geometry of the optimum dike (Table 4). The bottom side lies sub-parallel to the topography at about 1000–1300 m beneath the ground. Stars are the relocated hypocenters of the pre-eruptive micro-earthquakes that occurred up to 14 days before the eruption onset [Battaglia, 2001]. (b) Observed, modeled and residual interferograms for the dike model shown in (a), corresponding to three observed interferograms. Four to five residual fringes for each satellite direction suggest that the intrusion was more complex than we assumed. White dots and black lines indicate subsampled data points and the presumed eruptive fissures, respectively.
Sea Level 1 km 2 km 3 km ★: preeruptive seismicity
Mar. 98 Jul. 99 Sep. 99
Feb. 00 Jun. 00
Figure 11. Geometry of magma intrusion models (red) that best explain the observed interferograms, seen horizontally from the direction perpendicular to the strike of the intrusions. Same scale for verti-cal and horizontal directions. Topographic meshes and pre-eruptive micro-earthquakes are indicated by dotted lines and stars, respectively.
5. Evolution of Magma Conduits
In this section, we constrain the temporal evolution of the geometry of magma conduits by combining the results obtained in the previous section with seismic, tilt and visual observations.
5.1. Lateral injection of magma in shallow dikes For the nine eruptions which occurred in 2000–2003, in-cluding two of the eruptions we studied, tilt vectors indicate that magma injection was associated with the migration of the center of inflation from the summit toward the future eruptive fissures [Peltier et al., 2005]. For four eruptions in 2003, more detailed modeling of continuous tilt data shows a lateral propagation of dikes at shallow depths [Peltier et al., 2007]. Where possible, visual observations of vent openings can confirm that eruptions start close to the summit and then shift downslope. These strong indications of magma propagating laterally in dikes at shallow depths are consis-tent with our laterally elongated shallow dikes (Figure 11). 5.2. Vertical injection of magma in deep dikes
While shallow laterally-directed magma transfer obvi-ously takes place via dikes, the deeper conduit that trans-ports magma from the source region can either be a dike created for each new eruption, or a cylindrical pipe filled with magma which is used for successive eruptions.
Pre-eruptive seismic swarms are vertically elongated and extend from sea level up to the base of the laterally elongated dikes (Figure 11), with the exception of the March 1998 pre-eruptive seismic swarm which extended down to 6 km below sea level. Thus, the deeper magma path is subvertical.
Tilt changes are typically detected simultaneously with, or minutes after, the onset of pre-eruption seismic swarms above sea level [Peltier et al., 2005, 2009]. The March 1998 eruption was an exception; a pre-eruption seismic swarm started 34 hours earlier than tilt changes, at a depth of 6 km below sea level [Battaglia and Bach`elery, 2003]. But similar
to other eruptions, tilt changes before the March 1998 erup-tion were detected simultaneously with the arrival of the seismic swarm at sea level. These observations indicate that tilt changes at this volcano only become detectable when magma reaches a position near sea level.
For the 1998–2007 period, tilt changes associated with the vertical injection of magma in the edifice were of the
order of tens to several hundreds of microradians [Peltier , 2007]. Assuming that the hypocenters of pre-eruptive micro-earthquakes are indicative of magma conduit extensions, we have compared the maximum tilt amplitudes generated by cylindrical and dike-like conduits in Appendix A. The re-sults show that a cylindrical pipe having a plausible geom-etry and overpressure can not explain the observed tilt am-plitudes of tens of microradians, while a plausible dike can. Thus, at least above sea level, magma is transported in ver-tically elongated dikes until, or just prior, to the onset of eruptions. This inference applies generally to all the erup-tions in the 1998–2007 cycle, because of the systematic pre-cursory tilt signals observed during this period.
5.3. The level of neutral buoyancy
The above considerations lead us to propose that magma is injected vertically before being injected laterally. The change in magma injection direction from vertical to lateral is consistent with the time series of tilt, GPS and seismic-ity data acquired at the volcano for the period 2000–2003 [Peltier et al., 2005, 2007] and for 2004–2005 [Peltier et al., 2008]. Such behavior at Piton de la Fournaise volcano has been proposed before by Peltier et al. [2005] from seismicity and tilt data only, and the present study imposes further constraints especially on the shallow lateral injection. The change in magma injection direction from vertical to lateral during an intrusive event has also been inferred in other tec-tonic settings based on geophysical [Morita et al., 2006] and geological data [Acocella et al., 2006; Poland et al., 2008], although the time scales may be different.
The shift from vertical to lateral dike propagation re-quires a level of neutral buoyancy around the depth of the center of the lateral dikes [Ryan, 1987a]. Indeed, a mathe-matical (analytical and numerical) investigation of Taisne
and Jaupart [2009] shows that a dike propagating from
depth will grow more in the lateral direction than the verti-cal direction when it encounters a layer with a lower density than the magma. Such a density structure would be ex-pected from contractancy [Ryan, 1987a, b]. Our preferred dike models are rooted shallower than 1300 m (Figure 11). Considering also that the uncertainties in the bottom depth are roughly within±300 m except for the poorly-constrained southern dike of the March 1998 eruption, we can infer that
−0.05
0.05
Steepen
Flatten
Degrees
East (km)
N
o
rt
h
(km)
176
178
180
182
184
33
34
35
36
37
38
39
40
Figure 12. Slope changes (change in the maximum gra-dient of the topography) predicted from the dike intru-sion models for the five eruptions studied (Figure 11). Thick curves are the borders of the Bory and Dolomieu craters and the Enclos-Fouqu´e caldera. Thin curves are the elevation contours at 100 m interval.
the levels of neutral buoyancy are, for the studied cases, shallower than 1000 m. For a lithostatic stress state, this implies that the densities of degassed magma and surround-ing rock should balance at levels shallower than 1000 m. A recent study of the gravity structure of the volcano [Gailler
et al., 2009] indicates that the shallowest part of the central
cone is associated with low densities (600–800 kg/m3 lower than the rocks below) that can be attributed to highly vesic-ulated rocks that constitute the central cone. The depth of this low density zone is consistent with the shallow levels of neutral buoyancy inferred from the present study. The variable depth of dikes obtained by our analysis indicates a variable level of neutral buoyancy, which may originate from the stress changes due to previous intrusions.
The fact that the deeper, vertical dike-type conduits are not indicated in the interferograms can either be attributed to the deeper conduit being too narrow to cause a signal distinguishable from the signal caused by the shallower con-duit [Amelung and Day , 2002; Cayol and Cornet , 1998;
Sig-mundsson et al., 1999], or to the closure of the deeper
con-duit after magma transport has ended. Both hypotheses are consistent with positive buoyancy of the deep dike. Indeed,
Traversa et al. [2010] estimated, from fluid dynamics
mod-els assuming constant influx, that the Piton de la Fournaise 2003 eruption was associated with a vertical propagation of a buoyant dike having a width of 100 m. Deformation as-sociated with such a dike would be hidden by the shallower lateral dike. Analytical models [Weertman, 1971], numer-ical models [Dahm, 2000] and laboratory experiments
[Ri-valta et al., 2005] show that when buoyant dikes are injected
vertically and magma input stops, they close at their lower tip. The fact that only the shallower dike is detectable with InSAR is consistent with the intrusion of that dike at the
level of neutral buoyancy which could correspond to a litho-logical discontinuity. Thus, at the level of neutral buoyancy, magma accumulates to make this part of the dike to be thicker than the deeper buoyant part [Ryan, 1994; Lister
and Kerr , 1991; Taisne and Jaupart , 2009; Traversa et al.,
2010]. Closure of the shallow dike is prevented by the posi-tive magma overpressure.
5.4. Relation between the depths of seismic swarms and dikes
At Piton de la Fournaise volcano, all laterally injected dikes are located above the pre-eruptive seismic swarms, which is consistent with the observations that the upward propagation of magma generates seismicity [Battaglia and
Bach`elery , 2003] and that the lateral injection of magma is
nearly aseismic [Peltier et al., 2005]. This behavior may be associated with different ambient differential stresses within the edifice [Rubin and Gillard , 1998]. Below the level of neu-tral buoyancy (1000 m below the ground surface), ambient differential stresses could be large enough for dike propa-gation to induce shear failure of the rock matrix, whereas around the level of neutral buoyancy, where the shallow lat-eral dikes are emplaced, ambient differential stresses could be too small to induce micro-earthquakes. The cause of the low differential stresses could be the repeated dike in-trusions. The intrusions are perpendicular to the mini-mum principal stress, thus increasing the stress normal to the dikes, eventually reducing the differential stresses and leading to an isotropic stress field [Chadwick and Dieterich, 1995]. This hypothesis is consistent with a previous study of the 1983–1984 Piton de la Fournaise eruption [Cayol and
Cornet , 1998], which showed that, at the lateral dike level,
stresses were close to isotropic.
5.5. Localization of eruption to a circular vent Hours after their onset, eruptions at Piton de la Fournaise localize to a vent located at the lowest point of the eruptive fissures, from which magma continues to flow for a few days or more. Such localization has also been frequently observed on other basaltic volcanoes in Hawaii [Richter et al., 1970;
Lockwood et al., 1987; Wolfe et al., 1987] and in Iceland
[Bj¨ornsson et al., 1979; Thorarinsson et al., 1973]. This
change in activity is indicative of a change in magma con-duit shapes from dike-like to pipe-like, and is consistent with the change of mechanical processes associated with erup-tion evoluerup-tion. Some small nonuniformity in the opening distribution along the eruptive fissure can cause localiza-tion of mechanical and thermal erosion [Ida, 1992] and pre-ferred solidification, i.e., shutoff, of narrower parts [Bruce
and Huppert , 1989, 1990]. The delivery of magma to the
surface is thermally and mechanically more efficient in cir-cular conduits than in dikes [Delaney and Pollard , 1981]. Using observed magma flow rates and plausible values for the driving pressure and viscosity, we estimate that the ra-dius of the pipe for typical Piton de la Fournaise eruptions is of the order of one meter (Appendix B).
5.6. Model of magma transfer in the Piton de la Fournaise volcano
Based on the above considerations, we propose a model of magma transport for typical eruptions of the Piton de la Fournaise volcano. Firstly, overpressured magma in the magma reservoir located at sea level, or deeper, is in-jected subvertically, driven by the positive buoyancy of gas-rich magma which segregated at the top of the reservoir [Vergniolle and Jaupart , 1990] and perhaps also by a gas pocket at the dike tip [Menand and Tait , 2001] (Figure 13a). The top of the dike may be so buoyant that it prop-agates subvertically until it erupts. However, the rest of
(a)
(b)
(c)
Figure 13. Proposed model of magma transfer and emplacement associated with typical eruptions in the central cone of Piton de la Fournaise volcano. (a) Overpressurized magma from the reservoir intrudes upward in a dike. The upward dike propagation can be driven by the buoyancy of the gas-rich magma and gas pocket at the tip of the dike. (b) At the eruption onset, the dike grows laterally in the downslope direction at depths shallower than 1000 m. The lateral propagation results from magma reaching its neutral buoyancy level. As the overpressure in the reservoir decreases, the subvertical dike-type conduit starts to close. (c) Hours after the onset, because of magma cooling, the eruption localizes. A cylindrical conduit having a radius of about one meter is developed and the eruption continues for days to weeks. Magma solidification leaves a laterally-elongated dike rooted at depths of less than about 1000 m.
the magma, which is more degassed, has its level of neutral buoyancy at a shallow depth (less than 1000 m) so that the dikes grow laterally in the downslope direction (Figure 13b). As the overpressure of the reservoir decreases, the deep sub-vertical dike which had a positive buoyancy starts closing, while the laterally elongated part, located around the level of neutral buoyancy, remains open because of the overpressure profile which is maximized at this level. Hours after their onset, eruptions localize to a vent located at the lowest point of the eruptive fissures, from which magma continues to flow for a few days or more (Figure 13c).
6. Conclusions
InSAR data show that most of the dikes formed during the five 1998–2000 eruptions of the Piton de la Fournaise volcano are laterally elongated and rooted at, or shallower than, 1300 m. Specifically, the bottom depth of our preferred models ranges from about 250 m (September 1999, except for the feeder part) to 1000–1300 m (June 2000) (Figure 11). Owing to the spatially dense InSAR data, the depths were generally well constrained with uncertainties smaller than
±300 m for most of the cases. It should be noted, however,
that the possibility of a deeper dike can not be ruled out for the March 1998 eruption. The total volume of the intruded dikes amounts to 17% of the total volume of lava emitted during the study period, indicating a predominantly exoge-nous growth of the volcano.
The laterally elongated dikes are located above the seis-mic swarms. This could be explained by low ambient dif-ferencial stresses [Rubin and Gillard , 1998] at the shallow depths where the lateral dikes are found, resulting from the numerous dike intrusions.
Tilt interpretations and visual observations indicate that magma is injected laterally in dikes from the summit area in the downslope direction. Pre-eruptive seismicity and our model calculations of tilt show that before the lateral dike injection, magma propagates vertically in dikes located be-low the volcano summit. This change in injection direction from vertical to lateral, as well as the lack of an interfero-metric signal associated with the deep vertical dike, indicate a level of neutral buoyancy located at less than 1000 m be-low the surface. Finally, magma flow localizes to a single vent which, from observed magma flow rates, is estimated to have a radius of the order of one meter.
Transport of magma into dikes at the onset of eruptions and in cylindrical pipes for sustained eruptions is
consis-tent with mechanical processes, which indicate that the em-placement of dikes requires less work than the emem-placement of cylindrical pipes, but that the delivery of magma to the surface is thermally and mechanically more efficient in cylin-drical pipes than in dikes [Delaney and Pollard , 1981].
Appendix A: Maximum Tilt Amplitudes
for a Cylindrical Pipe and Dike
The surface (z = 0) radial tilt change due to a vertical closed pipe located at a depth c1 < z < c2 in an elastic
half-space is given by [Bonaccorso and Davis, 1999, with correction by Segall [2010] for the case ν̸= 0.25],
∂U3 ∂r = a2∆P r(1 + ν) 2E [ 1 R3 { 2ν + 1−3r 2 R2 }]c2 c1 , (A1)
P = 0
Volcanic Surface
Cylindrical Conduit
Radius R
Length H
Magma Flow
Rate Q
H
Magma Chamber
m
ρ , η
r
ρ
P = ΔPc+ρ
rgh
0
z
Figure 14. Model for laminar magma flow through a cylindrical conduit. Magma flow is driven by the pres-sure gradient between the reservoir and the ground.


![Figure 7. March 1998 eruption. (a) Geometry of the optimum deep sill of Figure 6a and shallow dikes (Table 4) plotted with the relocated pre-eruptive micro-earthquakes that occurred within 36 hours be-fore the eruption onset (stars) [Battaglia, 2001]](https://thumb-eu.123doks.com/thumbv2/123doknet/14036313.458577/11.918.121.781.93.777/eruption-geometry-relocated-eruptive-earthquakes-occurred-eruption-battaglia.webp)


