Faculté des Sciences Economiques Avenue du 1er-Mars 26
CH-2000 Neuchâtel
www.unine.ch/seco
PhD Thesis submitted to the Faculty of Economics and Business Enterprise Institute, Chair for Production and Logistics Management
University of Neuchâtel
For the degree of PhD in Management by
Arda ALP
Accepted by the dissertation committee:
Prof. Gerald Reiner, University of Neuchâtel, thesis director Prof. Valéry Bezençon, University of Neuchâtel, Switzerland Prof. Ümit S. Bititci, Heriot Watt University, United Kingdom Prof. Andreas Größler, Radboud University Nijmegen, The Netherlands
Defended on 13th January 2014
Evaluation of the Dynamic Impacts of Customer Centered
Lead Time Reduction Improvements on
Customer-Oriented and Financial Performance
To my family,
Mother and Father; one out of many,
from the very beginning until the very end. Together forever.
i
Acknowledgements
I would like to express my sincere thanks to my supervisor Professor Gerald Reiner for his trust and all of his guidance, instructive comments during the supervision of this thesis and also, for all of the support he provided during my doctoral study.
I would like to express my special thanks and gratitude to the external committee members Professor Ümit S. Bititci, Professor Andreas Größler and the internal committee member Professor Valéry Bezençon for showing keen interest to the subject matter, for their remarks, recommendations and accepting to read and review my thesis as well as accepting being a member of the evaluation committee. I am honored of their joining to this committee.
I would like to thank all research partners along with companies, managers and all that I have had a chance to collaborate with; for providing their resources and time, as well as for having faith and being interested in this research.
In addition, I would like to give my sincere thanks to Işık Biçer for our joint research discussions; for his everlasting interest in this research; for all of his encouragement, moral support and friendship.
A special thanks to Chantal Gloudemans for her interest in my work and for all of the support she has provided.
Finally, I would like to express my gratitude to my family for their endless love and wisdom, for being my everlasting friends, for providing never-ending encouragement and moral support from the beginning until the bitter end. Together forever.
iii
Summary
Motivated by the strategic importance of reduced lead times in today’s competitive business environment, this doctoral dissertation analyzes the dynamic impacts of lead time reduction (LTR) improvements on customer satisfaction and related financial performance metrics. The core thesis is centered on development of an integrated dynamic performance measurement framework which covers operational, customer-oriented and financial performance dependencies over time. The framework is demonstrated through two empirical industrial cases.
Effective reduction of lead time is possible through understanding the relationship between lead time and lead time related factors, and the implications of these relations on system performance. Reducing lead time can have direct and indirect effects, improving overall company performance in short-term and long-term. Due to certain system interactions, not only does operational performance improve, but so do customer satisfaction and financial measures which are affected in terms of, e.g., reduced inventories and inventory carrying costs; improved service quality, diminished cancelled orders and reduced penalty costs; increased sales, improved market shares and profitability.
In particular, this research targets to identify which situational factors play a critical role between lead time reduction strategies and related effect on performance, and to understand how reduction of lead time impacts long-term performance compared to short-term effects.
In this direction, an integrated performance measurement framework has been developed by considering mathematical principles of lead time reduction and covering dynamic dependencies between financial and non-financial performance dimensions. The framework is comprehensive yet simple enough to consider trade-off characteristics among both time-based and
non-time-iv
based metrics. The application of the framework was based on hybrid use of two methods:
Queuing Theory Based Modeling (QTM) and System Dynamics Modeling (SD).
Illustration of the lead time reduction framework is provided through two interrelated studies based on industrial applications done collaboratively with two international manufacturing companies. In this regard, two studies summarize these stages:
The first study focuses on integrated analysis of some lead time reduction strategies on system performance (locating bottleneck capacity buffers, eliminating sources of waiting, setup time and reducing variability). In particular, we focus on the dynamic dependencies between bottleneck buffer configuration and station loading policies in order to analyze how those dependencies affect operational performance improvement: Throughput increase and reduction of lead time while considering various levels of demand variability. In particular, our analysis provides evidence for performance improvement without needing to invest to increase the bottleneck resource. Application of a particular station loading strategy and usage of multiple buffers (moving from a single common buffer to multi-buffers) yields better performance when variability increases.
The second study focuses on analyzing the dynamic impacts of lead time reduction approaches on customer satisfaction and financial performance based on an industrial case created in joint collaboration with a European-based international company operating under make-to-stock manufacturing strategy. Based on the system’s characteristics some lead time reduction strategies are selected (i.e. optimization of batch size, reallocation of system resources by pooling labor and improving the setup time) and the industrial production process is successfully improved without significant cost and time investments. Subsequently, related effects on customer-based performance and corresponding financials such as capacity investment (i.e. buying a new machine) are analyzed. Key cost figures, such as processing, inventory, labor costs and others were determined by evaluating the underlying cost accounting system. Later, motivated by the industrial application, the framework was further analyzed using sensitivity analysis. The insights gathered through industrial applications are used to present a sensitivity analysis based on short and long-term demand and lead time interaction. The sensitivity analysis is used for two main purposes: (i) to analyze the long-term performance impacts of lead time reduction under the extreme conditions of market demand; (ii) to question the conditions to maintain the long-term sustainability of lead time reduction. The sensitivity
v
analysis provided additional insight into the dynamic behavior of the demand and lead time interaction.
Keywords: Lead time reduction, integrated – dynamic performance measurement, system dynamics, rapid modeling
vii
“As a strategic weapon, time is the equivalent of money,
productivity, quality even innovation”
ix
Table of Contents
Acknowledgements i
Summary iii
1 Introduction 1
1.1 Background of the problem ... 1
1.2 Statement of the problem ... 3
1.3 Research purpose ... 5
1.4 Thesis outline ... 6
2 Theoretical Background 9
2.1 Lead time reduction literature ... 9
2.2 The theoretical frame of lead time reduction ... 14
2.3 Managerial behavior and lead time reduction ... 19
2.4 Performance measurement and management literature ... 21
2.5 Recent developments of integrated performance measurement systems ... 25
2.6 Future trends in performance measurement system development ... 45
3 Theoretical Framework 51
3.1 Theory foundation and perspective ... 51
3.2 Development of the theoretical framework ... 53
3.2.1 Operational performance measurement development ... 54
x
3.2.3 Financial performance measurement development ... 65
4 Methodology and Research Design 71
4.1 Ontology, epistemology and strategy of the research ... 71
4.2 Empirical quantitative modeling ... 77
4.2.1 Queuing Theory Based Modeling ... 83
4.2.2 System Dynamics Based Modeling... 86
4.2.3 A hybrid usage of Queuing Theory Based Modeling and System Dynamics Based Modeling ... 94
5 Lead time reduction strategies in the glass industry: Integrated analysis of buffer configuration and loading policies 97
5.1 Introduction ... 97
5.2 Theoretical background and analytical framework ... 100
5.3 Empirical problem illustration ... 101
5.4 Proposed solution ... 103
5.5 Experiment and results ... 107
5.5.1 Results of Scenario I ... 110
5.5.2 Results of Scenario II ... 110
5.5.3 Results of Scenario III ... 111
5.5.4 Effects of variability on system performance ... 111
5.6 Conclusion ... 114
6 Dynamic evaluation of lead time reduction improvements: Empirical illustration through a real-life industrial case and a theoretical study 117
6.1 Industrial application ... 118
6.1.1 Production process definition ... 118
6.1.2 Empirical data and data collection ... 119
6.1.3 Verification and validation of the model ... 120
6.1.4 Solution proposal ... 122
6.1.5 Lead time reduction scenarios ... 125
6.1.6 Results – I ... 129
xi
6.2 Sensitivity analysis based on demand and lead time interaction ... 135
6.3 Conclusion ... 147
7 Conclusion and further research ... 149
Appendix ... 155
List of Figures ... 157
List of Tables ... 161
1
Chapter 1
Introduction
1.1 Background of the problem
Today’s business world is driven by the needs of consumers (Fırat et al., 1995, pp. 46-49). Companies require low costs, shorter lead times and high customer service levels in order to be competitive (Gaither, 1994). Reduced lead times can provide quick response advantages while improving service levels and increasing customer satisfaction levels (Slack, 1998; Suri, 1998). Thus many companies have been putting significant efforts into reducing their lead times (Suri, 2010 and 1998; Askenazy et al., 2006; Stalk and Hout, 1990; Tersine and Hummingbird, 1995).
Until the early 1980s, low cost and high quality were believed to be the fundamental sources of competitive advantage (Kim and Tang, 1997). Following World War II, economically devastated industries used low wages and scale-based strategies as an advantage to penetrate new markets. Higher workforce productivity and lower labor costs provided companies with competitive power against their competitors (Stalk, 1998, p. 42).
During the 1970s, companies started shifting their strategies from low wages to variety-based strategies, and flexible manufacturing became a competitive advantage (Dangayach and Desmukh, 2001). Flexible factories achieved flexibility and reduced costs, and surpassed traditional factories in terms of offered product variety. In this regard, Toyota Production System was a pioneer. Toyota was able to radically cut their response time to one day, achieved a much better customer response level compared to western competitors, and drastically lowered costs (Monden, 1983; Ohno, 1988). Toyota’s success was inspirational for many companies.
2
Starting in 1980s, the popularity of strategies such as just-in-time, lean manufacturing, and kaizen increased. Toyota’s emphasis on the just-in-time concept inspired Honda and Yamaha; they successfully competed against Suzuki and Kawasaki by executing processes faster and responding to customers rapidly. Mitsubishi initiated a time-based strategy by rapidly introducing innovative features for their air-conditioners and left western competitors ten years behind (Stalk, 1998, pp. 43-48). Such successes initiated an intensive focus on these strategies.
In the early 1990s, increased product and producer diversity in the market triggered a customer demand for shorter lead times which can be easily fulfilled from any competitor. Customers became willing to pay a price premium for shorter response times (Blackburn, 1991). Companies were forced to provide new products and better services at rapid rates (Stalk, 1988). Engineers and managers of many Japanese and western companies started to abandon cost-based and quality-based strategies and capitalize on speed-based strategies (Holmström, 1995; Schmenner, 2001).
The result was that manufacturers shifted their interest to increasing efficiency and gaining response advantages by reducing lead times. Gradually, time-based improvements became even more critical than cost- and quality-based ones (Krupka, 1992; Ghalayini and Noble, 1996). Time-based improvements drove cost improvements in terms of reduced inventory and penalty costs and quality improvements in terms of diminished manufacturing defects and reduced customer complaints. Meanwhile, as responsiveness to customer orders improved, customer service levels and customer satisfaction increased which are connected to cost and revenue (Bockerstette and Shell, 1993). In this regard, higher productivity, increased effectiveness and efficiency are possible through effective management of lead time and related factors (De Treville et al., 2004, p. 618).
In today’s business environment, organizations that are responding to customers’ needs within shorter time frames are increasing their market shares, profits and enjoying competitive advantage (Ghalayini and Noble, 1996, p. 68; Woodruff, 1997). Toyota cut supply response time from 15 days to 1 and reduced delivery lead time of a custom built car from 30 to 60 days to within 5 days (Stalk, 1998; Simison, 1999). Matsushita cut washing machine production time from 360 hours to 2; Honda reduced motorcycle production time by 80% (Stalk, 1998). General Motors reduced lead time from 50 to 60 days to 10 days (Simchi-Levi et al., 2003). Nissan cut the order-to-delivery lead time from 40 days to 7 days with a saving of $3600 per vehicle (Ruderman, 2004).
3
Furthermore, firms started using short lead times as a marketing tool and advertising their response time. Pizza Hut and Dominos’ promotion campaigns are based on the speed of delivery; Zara, Benetton and Sony are dominating market trends by introducing a variety of new products rapidly and frequently (Bruce, 1987; Dapiran, 1992); Hewlett-Packard and Dell offer quick response guarantees for custom-product demands (Feitzinger and Lee, 1997).
Several firms have been using speed-based strategies as their key competitive priority and marketing strength. In addition to operational improvement, lead time reduction provides financial advances and quick response capabilities to quickly adopt to changes in the market. Hence, the focus of this thesis is lead time reduction and impact of lead time reduction improvements on customer satisfaction and financial performance.
1.2 Statement of the problem
Theoretical foundations of lead time reduction are well studied in the literature. There are several practical, inexpensive strategies proposed for reducing lead time (Suri, 1998 and 2010; Tersine and Hummingbird, 2005; De Treville and Ackere, 2006; De Treville et al., 2004; Hopp et al., 1990; Stalk and Hout, 1990; Reiner, 2009 and 2010).
These strategies mainly focus on improving effective use of system resources, minimizing time waste, delays and waiting times while reducing inventories, synchronizing the production, smoothing work flow and eliminating variability (Hopp and Spearman, 2006; Cattani and Schmidt, 2005; Hopp et al., 1990). As a result, reducing lead time improves the overall performance ‘in a multiplier fashion’ in the short- and long-term with direct and indirect effects (Ghalayini and Noble, 1996; Suri 1998 and 2010).
Operational performance is directly affected in terms of reduced work-in-process and finished goods inventories. As delivery time reduces, response time and service quality improves. As a result, customer satisfaction improves while the number of cancelled orders diminishes. In the long-term customer loyalties and market share improves (Reiner 2005; Reiner and Natter 2007). Financial measures are affected in terms of reduced inventory cost, improved delivery times and reduced penalty costs. Working capital, capital turnover and return on investment are also positively affected in the long-term (Ittner and Larcker, 1998).
Conversely, time inefficiencies can severely damage the system performance. As Stalk (1988, p. 48) highlighted, ‘what distorts the system so badly is time’; time can be easily wasted by poorly
4
managed operations, layout/workflow inefficiencies, misallocation of tasks (serialization of independent activities, non-synchronization of dependent activities) or reproduction of rejected parts due to low quality. Lengthy delays, non-value adding activities as well as variability distort the entire organizational performance in terms of process disruption, time waste and inefficiencies which are strategically linked with customers and satisfaction oriented value creation (Stalk, 1988, p. 48): ‘Any activity that consumes more time than is necessary but does
not add value to the production is a time inefficiency and should be an initial target for reduction or elimination of time waste’ (Tersine and Hummingbird, 1995, p. 10).
In fact, ‘managing time is the mirror image of managing related factors such as quality, cost,
profitability and productivity’ according to Tersine and Hummingbird (1995, p.10). Thus,
effective reduction of lead time is possible through understanding the dynamics of non-financial and financial factors which are in close connection with lead time (Ghalayini and Noble 1996; Ghalayini et al., 1997; Kaplan and Norton, 1997; Beamon, 1999; Neely, 1999; Li et al., 2007).
Unfortunately Operations Management and Performance Measurement/Management literatures are limited in terms of studies focusing on performance interactions and trade-off characteristics while considering system dynamics over time (Santos et al., 2002; Reiner et al., 2007; Reiner et
al., 2009). Most state-of-the-art measurement systems do not focus on how overall performance
will dynamically be influenced by lead time reduction in the short- and long-term.
The added value of lead time reduction is usually hindered by traditional performance measurement and cost allocation systems (Avanzi et al., 2004; De Treville and Ackere, 2006). Such systems provide incomplete and biased information to managers leading to poor operations management decisions (Avanzi et al., 2004 based on Ridgway, 1956). For instance, the impact of reduced lead times on manufacturing costs and further cost reductions are not considered (Suri, 1998); and related effects on quality, worker motivation, and learning are not covered (Hopp and Spearman, 1990). In fact, traditional systems fail to reflect complete dependencies of various dimensions of performance as their focus is far from providing insight on consumers’ needs, expectations and real drivers of customer satisfaction. Therefore, related businesses decisions are insufficient to reach complete financial and market related success (Kaplan, 1990; Kaplan and Norton, 1997; Neely, 1999; Ittner and Larcker, 1996 and 1998; Gupta and Zeithaml, 2006).
Managers are failing to understand real drivers of performance by ignoring performance interactions and lead time related dynamics (Suri, 1998; Repenning and Sterman, 2001; Maskell and Kennedy 2007) and business is still missing long-term effects of time-based improvement on
5
customer and financial performance as a part of their standard configuration. In fact, significant levels of productivity and profitability are achievable as long as time-based measures are integrated with financial performance and market requirements (Ittner and Larcker, 2003 and 1998; Banker et al., 2000; Ghalayini and Noble, 1996; Krupka, 1992; Li et al., 2007).
Today performance interactions and trade-off characteristics, and related system dynamics, are an undeniable part of improvement and evaluation processes (Bititci et al., 1997, 2000, 2002 and 2006; Grünberg, 2004; Ghalayini et al., 1997; Santos et al., 2002; Neely et al., 1995 and 2000; Neely, 1999). When companies invest more on understanding dynamics of time-based improvement strategies and multiple performance effects they may reinforce their decision making process and strengthen their competitive advantage compared to their rivals basing their strategies on less integrated, static performance measurement systems (Ittner and Larcker, 2003 and 1998; Banker et al., 2000 and Bourne et al., 2000). In today’s business environment companies are becoming more proactive and dependent on dynamic information (Aedo et al., 2010). Thus, integrated, dynamic, accurate, up-to-date performance information is more required in order to facilitate agility and responsiveness. In this regard, recent studies indicate the importance of dynamic, proactive and continuous use of performance information to deliver more value to customers and maintain the sustainability (Corona, 2009; Taticchi et al. 2010; Ostrom et
al., 2010; Nudurupati et al., 2011; Bititci et al., 2011a, 2011b and 2012).
1.3 Research purpose
The purpose of this thesis is to better understand the dynamic impacts of lead time reduction approaches over time while considering the dynamic interactions among three dimensions of performance: Operational, customer-oriented and financial dimensions.
In particular, this thesis focuses on finding answers for the following research questions:
I. What are the dynamic impacts of lead time reduction approaches on customer satisfaction and financial performance?
II. Which situational factors play a critical role between lead time reduction strategies and related effects on performance?
III. How does the reduction of lead time impact long-term performance compared to short-term effects?
6
To be able to answer these research questions, a System Dynamics-based performance evaluation framework is developed. This framework explores how the performance is dynamically affected by lead time reduction. In parallel, this will also help us to enrich our understanding on performance metrics interactions and related performance trade-offs. In the end, this provides a wider perspective to comprehend direct and indirect effects of lead time reduction, and short- and long-term performance influences in contrast to similar research results provided for a single period.
1.4 Thesis outline
Chapter 2 provides the theoretical background and detailed analysis of both the lead time reduction literature and performance measurement/management literature. Being in line with research objectives, particularly the focus is on the features and characteristics of the integrated performance measurement frameworks which became popular over recent years.
Chapter 3 focuses on theoretical foundations of the integrated dynamic performance measurement framework. Framework development is explained in detail for operational, customer-oriented and financial performance dimensions. For each dimension, the theoretical motivation is provided through a discussion of the related academic literature.
Chapter 4 highlights the motivation behind the methodology selection, focusing on two modeling approaches: Queuing Theory Based Modeling and System Dynamics Based Modeling. The motivation behind the hybrid usage of these methods is explained by discussing how these methods complement each other while providing a wide range of critical scenarios and strong analyzing capabilities. The chapter is concluded with related methodological contributions.
Chapters 5 through 6 present the illustration of the lead time reduction framework through interrelated studies based on industrial applications.
In particular, Chapter 5 focuses on integrated analysis of some lead time reduction strategies (locating bottleneck capacity buffers, eliminating sources of waiting, reducing variability) on system performance. In particular we analyze how bottleneck buffer configurations and station loading policies and related dependencies affect operational performance improvement.
Chapter 6 focuses on analyzing the dynamic impacts of lead time reduction approaches on customer-oriented and financial performance based on an industrial case. In particular, effects of
7
optimization of batch size, reallocation of system resources by pooling labor and improving the setup time on customer satisfaction and corresponding financials are analyzed. An additional sensitivity analysis is conducted in order to analyze dynamic impacts of lead time reduction on long-term performance compared to short-term effects.
Chapter 7 concludes by providing insights gathered through the industrial applications, and presenting related managerial implications and further research opportunities.
9
Chapter 2
Theoretical Background
2.1 Lead time reduction literature
In the 20th century, companies began to focus more on customers (Gaither, 1994). Recently, there is a growing managerial interest in customer satisfaction (Rust, et al., 2010). Organizations are much more focused on reducing their lead times, by responding to customers on time, improving service quality and thereby satisfying a greater number of customers (Anderson et al., 1997; Fornell, 1992; Gaither, 1994; Bielen and Demoulin, 2007) as high customer satisfaction ratings are linked to a company’s future success and profits (Anderson and Sullivan, 1993 and 1997). Today, effective lead time management is viewed as a competitive advantage (Tersine and Hummingbird, 1995; De Treville et al., 2004). Reducing lead time provides companies an advantage of producing and delivering products and providing services on time, in an efficient and cost-effective way compared to competitors (Stalk, 1988; Stalk et al., 1992; Stalk and Hout, 1990; Askenazy et al., 2006).
In the late 1970s and early 1980s, researchers started becoming interested in lead time reduction as a result of the rising popularity of JIT production (De Treville et al., 2004; Avanzi et al., 2004). During this period the western industry began to realize that the Japanese manufacturing methods far exceeded those of the European and American industries. The Japanese were able to achieve better quality, improve productivity and provide higher responsiveness using fewer resources (Womack and Jones, 1996 and 2003). The success of Japanese manufacturing systems motivated western companies to improve their operational efficiency using JIT principles and
10
lean philosophy (Askin and Goldenberg, 2002; De Treville and Antonakis, 1995). Researchers began focusing on exploring the elements of success by comparing the differences between Japanese and western manufacturing systems.
The Toyota Production System was seen as a major evolutionary step in terms of business efficiency and effectiveness (Liker, 2004). A production genius, Taiichi Ohno, located at Toyota, developed a manufacturing system, which was flexible, responsive and used less resources (Sohal and Egglestone, 1994), which far exceeded Western competitors (Ohno, 1988). Toyota’s success in achieving higher productivity, sharply reduced lead times, levels of responsiveness and cost advantages (Monden, 1983) motivated researchers to synthesize the success factors behind the Toyota Production System (Liker and Jeffrey, 2004). Toyota’s manufacturing philosophy and management principles initiated the foundations of lean production (see Krafcik, 1988 and Avanzi et al., 2004 for further discussion regarding the link between the Toyota Production System and lean production).
The increasing popularity of lean thinking, lean production and the just-in-time concept led to a growing academic interest in the lead time reduction (De Treville et al., 2004; Avanzi et al., 2004). Today, in the field of operations management, theory concerning lead time reduction is well developed (as mentioned by De Treville et al., 2006, p. 397). Various researchers have studied the theoretical foundations and practical implications of lead time reduction (Suri, 1998 and 2010; Tersine and Hummingbird, 2005; De Treville et al., 2004; De Treville and Ackere, 2006; Hopp et al., 1990; Stalk and Hout, 1990).
One of the pioneering articles of lead time literature titled, ‘Industrial Dynamics: A Major
Breakthrough For Decision Makers’, was published in 1958 in the Harvard Business Review by
Jay W. Forrester (Stalk, 1988, p. 47). In his article, Forrester analyzed the impact of time delays and decision rates on organizational performance using systems thinking methodology and industrial dynamics models (Forrester, 1961). Basically, Forrester showed how a slight increase in demand can significantly deteriorate system performance, thus, causing fluctuations in production (boosting ups and cutting backs); and the system then required a long period to return to stability. According to Forrester, a long cycle time and lengthy response time in the planning loop inevitably creates an inaccurate view of the market, leading to weak decisions and ever-growing deteriorations in overall performance. The longer the time it takes for the system to realize and respond to demand fluctuations, the more distortions, waste and inefficiencies (Forrester, 1958; Stalk, 1988, pp. 47-48).
11
Three decades after Forrester’s article, Sterman (1989b) noted that related performance disruption arises from misinterpreted feedback and neglected factor interaction; and Lee et al. (1997, p. 548) demonstrated that lead times are positively related to the distortion of demand fluctuations (De Treville et al., 2004, p. 616).
Goldratt and Cox (1984) focused on operational factors that have an effect on lead time. The authors draw specific attention to how resource utilization and lot sizing decisions affect lead times (De Treville et al., 2004). Karmarkar et al. (1985) and Karmarkar (1987) studied the systematic relationship between lot sizes and lead times. The authors demonstrated the impact of lot sizing decisions on manufacturing lead times and related in-progress inventories.
Hopp et al. (1990) studied the causes of long lead times and suggested key principles for reducing lead times. These principles are important to completely understand the relationship between processing times, waiting times, lead times, work-in-progress and finished goods inventories, as well as the effects of variations in lead time and process performance.
Steele and Shields (1993) studied the relationship between capacity, lead time, and inventories. The authors showed that, in addition to low cost advantages, capacity slacks also have a positive impact on various performance dimensions.
In another study, Karmarkar (1993) provided a detailed discussion as to how the production lead time affects the operational performance, which was provided by detailed literature in this area. The author especially highlighted the quantifiable negative effects of long lead times on safety stock inventories and the service level provided.
Bartezzaghi et al. (1994) focused on business processes and proposed a framework to model the lead time of any business process in order to support business process reengineering.
Vaughan (2004) studied the effects of lot sizing decisions on process lead time and safety stock inventories. In a similar study, Mikati (2010) analyzed the dependence of lead time on batch size using System Dynamics Modeling.
After the mid-1990s researchers began to address the lead time reduction concept for market mediation (Upton, 1995 and 1997; see De Treville, 2004). Articles in business press and lead time literature began to focus on the importance of speed-based advantages (Stalk, 1988; Schmenner, 1988; Stalk and Hout, 1990; Holmström, 1995; Schmenner, 2001). Stalk (1988, p.
12
42) named time to be the cutting edge advantage: ‘As a strategic weapon, time is the equivalent of
money, productivity, quality and even innovation’, and underscored how managing time has
enabled the Japanese industry not only reduce costs, but also to offer broad product lines and cover more market segments. Stalk (1988) also highlighted the possibility of establishing response time advantages as a winning competitive strategy based on success stories of the Japanese industry’s time-based strategies.
In his article, ‘The Merit of Making Things Fast’, Schmenner (1988) placed increasing importance on speed-based advantages. Later, Schmenner (2001) explained how emphasizing focus on management of flow and speed could provide companies with higher productivity, based upon his ‘Theory of Swift, Even Flow’ (De Treville et al., 2004, p. 618).
Later, a group of researchers led the academic interest on the concept of using speed and lead time reduction to gain competitive advantage. This initiated the emergence of speed business strategies and the time-based competition concept highlighted by several researchers (Stalk, 1988; Stalk and Hout, 1990; Blackburn, 1991; Suri, 1994 and 1998; De Treville et al., 2004).
Blackburn (1991) mentioned ‘time-based competition’ as the next battleground in industrial competition. In their book ‘Competing against time: How time-based competition is reshaping
global markets’ Stalk and Hout (1990) discussed the urgent need for time-based capabilities
based on the changing needs of a dynamic business environment. Later, Stalk et al. (1992) provided further discussion on the competitive power of speed-based strategies, which were based on the success stories of Wal-Mart, Kmart, and Canon (Stalk and Hout, 1990; Stalk et al., 1992). In a similar direction, Holmström (1995) highlighted the criticality of speed and efficiency for manufacturing industries. Kumar and Motwani (1995) proposed a strategic framework for assessing time-based competitive advantage in manufacturing firms.
Tersine and Hummingbird (1995) centered lead time reduction into the core of customer oriented competitive strategy. The researchers highlighted the paramount importance for customers and noted how reducing lead time can provide quick response advantages (e.g. improved customer service, reduced response times, satisfying customers’ expectations on time, delivering products/services faster than competitors and attracting new customers, etc.) to succeed in existing markets and to penetrate new markets.
One of the well-known comprehensive overviews of lead time reduction principles is Hopp and Spearman’s (2006) Factory Physics. Based on the principles of the queuing theory, Hopp and
13
Spearman (2006) defined a set of mathematical relationships, principles and rules that determine the lead time. Basically these sets of rules formalize relationships and interactions of bottleneck utilization, lot sizes and variability with lead time (De Treville et al., 2004). Based on these mathematical rules, Hopp and Spearman (2006) suggested practical, inexpensive and effective strategies for reducing lead times: Looking for WIP (the impact of buffer stocks vs. excess inventories), keeping things moving (i.e. splitting jobs, sharing transfer batches, queue control),
synchronizing production (i.e. dispatching rules), smoothing the work-flow (i.e. leveling work
release, establishing a uniform workflow and rationalizing line balancing) and elimination of
variability (i.e. reducing rework, improving machine reliability and planning for yield loses).
Following this, Suri (1994 and 1998) introduced a queuing theory-based manufacturing strategy:
‘Quick Response Manufacturing1’ (QRM). Suri developed QRM as a companywide strategy for reducing lead times and by providing rapid response to customers. According to Suri (1994), QRM is an efficient, competitive strategy for managing high variability, low-volume or custom-engineered products, helping to improve product and service quality, and providing significant cost advantages. Using the QRM concept, Suri successfully integrated factory physics and lead time reduction principles into numerous real-life manufacturing applications (e.g. the industrial cases of John Deere, Rockwell Collins, Danfuss, Varco Drilling, Trans-Coil, Inc., E.J. Basler Co., Suri, 1994 and 1998) (De Treville et al., 2004; Reiner, 2009 and 2010).
According to De Treville et al. (2004), by introducing Factory Physics and Quick Response Manufacturing principles Hopp and Spearman (2006) and Suri (1994 and 1998) represented ‘the first comprehensive application of lead time reduction principles (and underlying mathematical relationships) to the general theory of operations management’ (De Treville et al., 2004, p. 619). Today, lead time related mathematical relationships as wellas the queuing-theory based software has been widely used to better understand and master lead time reduction principles and underlying dynamics (Suri et al., 1986 and 1993; Suri et al., 1995; Rabta, 2009; Rabta et al., 2009). For the recent development of lead time literature reference is made to Reiner (2009) and Reiner (2010).
1
Quick Response Manufacturing should not to be confused with the supply chain strategy Quick Response (QR) which is a particular model for a particular market or industry (i.e. fashion market, apparel industry, textile industry; Hammond and Kelly, 1991). Quick Response Manufacturing is a companywide strategy which is applicable to wide range of business sectors.
14
2.2 The theoretical frame of lead time reduction
Reducing lead time is possible through understanding factors that determine the lead time. Primarily, three factors play a role in the average length of lead times: Bottleneck utilization, lot
sizes and variability (as mentioned by Avanzi et al., 2004, p. 3). System dynamics and factor
interactions (i.e. resource interactions) also have a considerable impact on lead time (based on the mathematical laws of Factory Physics, Hopp and Spearman, 2006; Sterman, 2000 and 2001).
i) Bottleneck utilization and lead time relation:
In a discrete production system the product units move through a sequence of stations where manufacturing/assembly operations are performed. Each station is responsible to perform a subset of tasks which are required to manufacture the entire product (Scholl and Klein, 1999, p. 721). Every station processes an item or a group of items within a given cycle time. Cycle time is defined as the time interval (average time) between completion of two successive units which is equal to the reciprocal value of the output rate. The utilization of a station is commonly defined as the long-run fraction of the average time the station is busy. Namely, utilization can be defined as the ratio of the average arrival rate over the average production rate of the system (system capacity). The station with the lowest throughput capacity (or whose capacity is equal to or less than the demand; Koo et al., 2007) is commonly defined as the bottleneck station. In Figure 2.1
(shown below) a simple production line is illustrated where each station (Si) performs a single task (Ti) by a unit processing time of ti seconds.
In this production line the Station 4 is the bottleneck station with the lowest throughput rate per hour. Performance at this station is critical, as system throughput is directly related to the capacity of the bottleneck station. Idle time, or time wasted in the bottleneck station, negatively impacts the entire system performance.
T3
T2 T4 T5 T6
t1=30 sec
S1 S2 S3 S4 S5 S6
product
t2=25 sec t1=15 sec t1=50 sec t1=15 sec t1=20 sec
raw material T1 Process capacity (hourly) Figure 2.1: A sample process with the bottleneck station.
15
Law of Utilization: If a station increases utilization without making any other changes, the average WIP and cycle time will increase in a highly nonlinear fashion (Factory
Physics, Hopp and Spearman, 2006).
Based on the law of utilization, increasing bottleneck utilization results in an exploded average lead time (Avanzi et al., 2004) and work-in-progress inventories (Little’s Law, Little, 1961) (see
Figure 2.2, shown below):
Figure 2.2: Bottleneck utilization – lead time relation (Source: Anupindi et al., 1999; Hopp and Sterman, 2006).
Suri (1998), Anupindi et al. (1999) and Hopp and Spearman (1990 and 2006) demonstrated that the significant levels of performance and improved productivity are achievable reducing utilization at the bottleneck station. This can be achieved by reducing the workload (demand) on that station, increasing capacity (i.e. adding more resources, such as labor or equipment) or adding a capacity buffer.
Installing a capacity buffer at the bottleneck station prevents long lead times (Avanzi et al., 2004). In this regard, buffers are not excessive inventory as having them is important to protect the throughput (Hopp et al., 1990, p. 79). In addition, preventing excessive capacity utilization helps to maintain short lead times; since keeping the utilization level high at non-bottleneck workstations will result in exploded bottleneck utilization. Therefore, avoiding over utilization and maintaining moderate utilization assists in reducing lead time (Avanzi et al., 2004). Conversely, cost allocation systems penalize capacity buffers and keeping utilization low at non-bottleneck stations (Avanzi et al., 2004; De Treville and Ackere, 2006).
Systematic and sequential elimination of bottlenecks optimizes throughput and increases capacity. Along with the improvement of lead time performance, the system is capable of
Bottleneck utilization 100 % Av er ag e lead ti m e, W IP
16
responding to more customer requests at a time. As new demands occur, new bottlenecks emerge as a new target for further improvements. The lead time reduction process continues as a loop, consistent with the continuous improvement concept (Tersine and Hummingbird, 1995) (see
Figure 2.3, shown below):
Figure 2.3: The continuous mechanic of bottleneck optimization based improvements (Source: Tersine and Hummingbird, 1995, Figure 3, p. 13).
In Section 5.2 to 5.5 (on pages 100 – 113), further theory on bottleneck optimization and related impacts on over performance will be explained along with an industrial example.
ii) Lot size and lead time relation:
The reason behind batching work is related to machine setups and transportation operations (Karmarkar, 1987; Karmarkar et al., 1985). Batching can be useful when multiple products are processed on the same machine and switching from one product type to the other necessitates the setup of the operation. On the other hand, batching is a source of variability, which has an impact on process flow time (Hopp and Spearman, 2006). For this reason, it is essential to understand the components of flow time:
flow time = run time + setup time + move time + queue time + wait-for-parts time + wait-to-move time (as defined by Hopp et al. 2, 1990).
While setup time and unit run time are independent of batch size; run time, queue time and waiting-for-parts time are batch size dependent. Relatively small batch sizes increase the number
2
Hopp et al. (1990, p. 80) defined sub-components of flow time as follows (in order keep the consistency, we use the same terminology as the authors used): run time: total processing time at work centers required to complete the job (all pieces in the batch); setup time: the sum total of all of the internal setups involved in processing the job; move time: time required to move the job between work centers; queue time: time spent waiting in queue for work center to become available; wait-for-parts time: time spent waiting for other subassemblies so that an assembly operation can begin, wait-to-move time: time spent waiting for other parts in a batch to be completed so that the batch can be moved to next work center.
17
of setups needed per batch; the total setup time is relatively high for small batch sizes. If proper batch sizes are selected, batching reduces the number of setups, setup time and setup costs.
Setup time reduction is important for increasing capacity and reducing flow time variance. According to Hopp et al. (1990) there may be cases where setup times cannot be reduced to insignificant levels and large batch sizes may be required to achieve the capacity needed. On the other hand, using very large lot sizes create more waiting; which results in an increase in queue time and waiting-for-parts time since pieces in the queue have to wait until the machine is available again. Furthermore, all pieces in a batch have to wait until the last item is processed. As a result, this forces the entire lot to wait, which is a significant increase in the wait time (Hopp and Spearman, 2006; Poiger et al., 2010). Lot size - flow time interaction is shown in Figure 2.4 (shown below):
Figure 2.4: Lot size – flow time interaction
(Based on Poiger et al., 2010, Figure 6, p. 294 and Mikati, 2010, Figure 3, p. 7).
Batch size selection is a trade-off between setup times and waiting (waiting-in-queues and waiting-in-batch for parts). Targeting improvement efforts to reduce the flow time associated with these components makes sense (Hopp et al., 1990). In fact, significant lead time improvements are achievable by optimizing the batch size (Mikati, 2010; Hopp and Spearman, 2006; Koo and Koh, 2007; Vaughan, 2004). In Section 6.1 (on page 118), further theory on batch size optimization and related performance impacts will be discussed along with an industrial example.
iii) Variability and lead time relation:
Increasing system variability always degrades lead time performance:
Law of Variability I: Increasing variability always degrades the performance of a production system (Factory Physics, Hopp and Spearman, 2006).
Lot size Flow time
18
In a production system variability is related to both production (processing rate) and arrival (demand; interarrival times) processes. As the coefficient of variation3 increases, either for processing or interarrival times, lead time increase4.
Quality issues, rework, machine down times, worker absenteeism and the inconsistency of production methods all have a considerable impact on the mean and variance of flow time (Hopp
et al., 1990). If variability in a production system cannot be reduced, it can be buffered by some
combination of inventory, capacity, and time (based on the second law of variability, Factory Physics). In this direction, strategies proposed for managing variability include reducing rework, improving machine reliability, better planning/scheduling, reduction of setup time, and pooling of customer demand or resources (Hopp and Spearman, 2006; Cattani and Schmidt, 2005; De Treville et al., 2004; Suri, 1998).
Quality controls could help to reduce rework, rejections and time consumption. Particularly quality checks performed before bottleneck station, lengthy operations or the processing of large lots help early detection of problems and prevent the loss of time. Improving machine reliability and reducing machine downtime also reduces flow time. Reducing machine unavailability at the bottleneck is especially critical in terms of the strong impact that bottleneck resources have on mean and variation of flow time (Christensen et al., 2007; Hopp et al., 1990). Improving machine reliability also prevents keeping more buffer stocks since long and frequent machine breakdowns require more buffer stocks compared to short and frequent ones.
Placing buffer inventories, especially at bottleneck stations, is one way to hedge the uncertainty (Shi and Men, 2003; Yamashita and Altiok, 1998). Carrying a safety inventory helps to reduce stock outs and assists in maintaining a certain service level and improves customer satisfaction (Battini et al., 2009). However, keeping an extra inventory is not free. Indeed this is a trade-off between the safety inventory level, related service level and stock keeping costs. Keeping fewer
3
Coefficient of variation is the most common measure for the variability of a random variable, which is defined by the ratio of its standard deviation to its mean; or equivalently the squared coefficient of variation.
4
This can be illustrated using a simple G/G/m-model (Bolch et al., 2006, pp. 244 and 269):
√
(2.1)
(2.2)
where is average flow time, is average waiting time, is average service time of a server, is the utilization, is interarrival time variation coefficient, is service time variation coefficient and m is number of servers.
19
inventories might be tempting in terms of reducing inventory costs; however, the stock out risk will also increase under long lead times, high demand and delivery variability5.
The pooling principle, pooling of customer demands or resources, allows better management of variability and aids the achievement of operational improvements (Cattani and Schmidt, 2005). The pooling of resources is used to reduce the number of workers (assigned to a task/station) by replacing this workforce with fewer but highly-skilled employees (can be assigned to several tasks/stations). In theory, the waiting time in the queues is expected to decrease. However, levels of specialization help hedge variability, but results in increased labor costs. Therefore, the extra investment would be needed for a highly-skilled workforce has to be compensated for with cost reductions and profit increases through lead time reductions.
2.3 Managerial behavior and lead time reduction
Although the relationships between lead time and related factors is well defined as a set of mathematical laws, either their application in a manufacturing environment is less emphasized or the implications of these rules are not very highly regarded (Suri, 1998).
According to Suri (1998), the principles of factory physics are less understood, along with a common belief that reducing lead time is costly or difficult. Managers tend to ignore the implications of related mathematical laws and pay less attention to the relationship between lead time and related factors. As a result, managers take counterproductive actions that result in an increase in lead time. Some of these mistakes increase utilization and keep resources as busy as possible, increase lot sizes, ignore variability and disregard resource interactions and system dynamics (Avanzi et al., 2004; De Treville and Ackere, 2006).
In addition, the cost allocation system and traditional performance measurement frameworks also play a great role in misguiding managers and shading lead time reduction initiatives (Bititci
et al., 2000 and 2002; Neely et al., 2005; Folan and Browne, 2005). Even though capital and
time investments are required for reducing lead time, such systems do not reward investing in the
5
This can be illustrated using reorder point (s) and the safety inventory (Is) formulas of Continuous Review Policy:
(2.3)
√ √ (2.4)
where L is replenishment lead time (delivery time); µL is mean delivery time, αL2 is delivery time variance; αD2 is
variance of demand (normally distributed N(µD, αD)); z is the safety factor: the threshold value prevents falling into
20
reduction of setup times or variability, and penalize for keeping extra capacity buffers or keeping utilization at moderate levels (Avanzi et al., 2004; De Treville and Ackere, 2006).
Such systems encourage managers to increase resource usage and boost utilization in order to hit production targets. For them, squeezing employees to work faster and harder is the correct strategy to accelerate production. Furthermore, most managers may choose to cut time and efforts for improving lead time in order to save time for extra work. High utilization and the cutting down of improvement efforts may secure the desired throughput increase, but this causes further and greater problems. In fact, by increasing utilization excess, capacity is wasted instead of being used to hedge uncertainties or make improvements, create growth, etc. The system becomes even less flexible and capacity and performance related problems begin to emerge (Repenning and Sterman, 2001; Sterman et al., 1997; Oliva and Sterman, 2001 and 2010).
Workers operating at high rates of utilization have less time and place less emphasis on flow are less motivated to eliminate delays, reduce quality issues, reduce the amount of rework, machine downtimes or setup times. In the long-term, overall performance is affected in terms of decreased capability, increased lead and response times, reduced labor motivation, the erosion of service quality, increased costs and turnover rate, reduced profitability and the gradual loss of customers and market shares. Distorted performance leads to even further capacity gaps creating further work pressure on capacity in a snowball effect (‘better-before-worse’ situation). Keating
et al. (1999), Repenning and Sterman (2001) and Oliva and Sterman (2001 and 2010) analyzed
the internal dynamics of this dilemma. Another wrong mindset is using large batch sizes in order to increase capacity and reduce setup costs. However, large batch sizes may lead to increased lead times and costs which reduces responsiveness (Karmarkar, 1987; Karmarkar et al., 1985; Suri, 1998). This type of mindset is contrary to the lean principles which favor creating and keeping capacity.
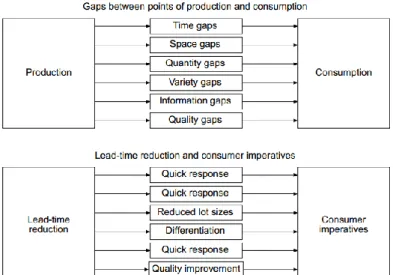
Managers ignore the long-term consequences of lead time reduction strategies; and their multiple effects on overall performance are usually disregarded. In fact, effective lead time reduction has an impact on market-oriented performance (Ittner and Larcker, 1998; Reiner, 2005). Actually, lead time reduction strategies provide several opportunities for responding to consumer imperatives as shown in Figure 2.5 (on page 21) (Tersine and Hummingbird, 1995):
21
Figure 2.5: The relation between lead time reduction and consumer imperatives (Source: Tersine and Hummingbird, 1995, Figure 43, p. 15).
Lead time reduction strategies target closing the gaps between production and consumer needs while improving the consumers’ satisfaction. For instance, providing a quick response to consumers’ needs through lead time reduction eliminates time, space and information gaps. Optimization of lot sizes and reduction of setup times permits variety in response to consumer needs while closing quantity and variety gaps. The elimination of scrap, rework, downtime and increasing machine reliability improves quality. Furthermore, improving lead time leaves more time and capacity for continuous improvement initiatives while closing quality gaps (Tersine and Hummingbird, 1995, pp. 14-15; Stalk and Hout, 1990).
2.4 Performance measurement and management literature
‘Performance measurement is the process of quantifying the efficiency and effectiveness of
actions; and a performance measurement system is the set of metrics used to quantify both the efficiency and effectiveness of these actions’ (based on a definition by Neely et al., 2005, p. 1229).
The origin of the literature covered here extends back to late 1980s where the need for
‘integrated, balanced, improvement-oriented and dynamic’ performance measurement systems
emerged (Bititci et al., 2000, p. 693; Kaplan, 1990; Russell, 1992).
Until the 1980s, traditional performance measurement systems were regularly used for monitoring, controlling and evaluation purposes. These systems intensively relied upon cost accounting systems. Thereby, these systems were primarily financially-oriented; as they were
22
heavily reliant upon cost and efficiency measures (Anderson and McAdam, 2004; Neely et al., 1995).
Following changes in the market, individual use of financial performance measures became insufficient to meet the needs of today’s manufacturing environment (Bititci, 1994, p. 16). Traditional measurement frameworks became insufficient to capture the real drivers of the business (Wongrassamee et al., 2003). Furthermore, traditional measures were misleading managers by providing the false impression of being useful and correct, but in fact, they were proving to provide a limited and misleading image of performance (Medori and Steeple, 2000). Several studies heavily criticized the inadequacy of traditional measures (Kaplan, 1988; Ghalayini et al., 1997; Medori and Steeple, 2000; Neely et al., 2005; Neely, 2005). The discussion of Bititci et al. (2006), Bititci (1994), Neely et al. (1995) and Ghalayini and Noble (1996) are also referred to regarding the deficiencies of traditional performance frameworks.
The limitations of traditional performance measures vary. One main disadvantage is their high dependency on classical ABC-based cost accounting measures, which can be insufficient to cover all drivers of cost (Ghalayini and Noble, 1996). According to Kaplan (1990, p. 35), such local performance measures or volume-based measures are harmful; as they conflict with attempts to improve quality, reduce lead times, reduce inventories and increase flexibility.
Traditional performance measures are also criticized and seen to be lagging metrics; for not being aligned with the corporate strategy and lacking strategic focus (Neely, 1999). Measures such as cost, profit or throughput may encourage short-termism, leading to myopic, sub-optimal solutions (Anderson and McAdam, 2004). For instance, profit without having the integration of other measures can lead to myopic interpretation of actual performance. As Globerson (1985) explained, profit alone does not necessarily indicate the source of problems or show where might be the fruitful areas to improve. Greedy cost reduction goals may gradually encourage managers to rely on short-term earnings; leading to weak decisions, causing more harm than good (Sterman
et al., 1997). This negatively impacts long-term improvement targets while distorting
responsiveness and flexibility (Neely et al., 2005); efficiency and effectives (Tung et al., 2011).
Another criticism surrounds the limited adaptability of traditional measures with the continuous improvement philosophy (Kaplan and Norton, 1992). According to Fisher (1992, p. 21), financial standards negatively affect employee motivation and the success of related improvement programs. Their relevance to practice is limited, as financial metrics can be insufficient to truly show the effects of improvement programs. As Suri (1998) mentioned, such measures are
23
insufficient to realistically reflect complete cost-based improvements achieved by the reduction of lead time. Furthermore, quantification of some non-financial improvements in terms of pure financial measures might be incorrect or impractical (i.e. evaluating the effect of kaizen improvements on internal satisfaction).
Traditional measures do not have an external customer-oriented focus; as in some cases it is impossible to evaluate and improve customer-oriented company strategies (Kaplan and Norton, 1992).
A final criticism of traditional measures is related to time-based performance. The popularity of time-based measures caused misperceptions. Some managers believed that the individual use of metrics such as cycle time, lead time or delivery time would be enough to improve performance. However, not integrating such measures with non-time based performance (i.e. service quality, customer satisfaction/dissatisfaction, related penalties/costs and related effects on future sales) may lead managers to have an incorrect overview of company performance. This highlights the importance of integrating the use of time-based and non-time based measures (Ghalayini and Noble, 1996).
Starting in late 1970s and early 1980s, the arrival of Japanese manufacturing systems (just-in-time, lean manufacturing and continuous improvement programs) initiated an increasing awareness of the performance measurement concept. Being customer focused became an important competitive power, as opposed to being cost-oriented (Fırat and Venkatesh, 1993; Fırat
et al., 1995). As the importance of customer satisfaction was raised (Rust and Zahorik, 1995;
Rust et al., 2010), providing a quick response to customer needs became a competitive drive. This has forced many organizations to differentiate themselves from their competitors by capturing more critical aspects of customers (Ittner and Larcker, 1998 and 2003). Companies started leaving low-cost production strategies and started shifting to advanced strategies in order to improve responsiveness, quality and customer services and provide higher quality customer satisfaction (Ittner and Larcker, 1998).
This motivated companies’ growing interest on customer and market oriented non-financial measures (i.e. service quality, service flexibility, order/delivery lead time, customer responsiveness, customer satisfaction, customer loyalty and many others; Neely, 1999; Ghalayini and Noble, 1996). As Medori and Steeple (2000) stated, there are several advantages to integrating non-financial measures into performance measurement. Compared to financial measures, non-financial measures are consistent with the long-term company strategy. They
24
provide more precise information for the management team while having a wider focus on both internal and external goals. They are flexible and adaptable to the changing needs of the market; and are compatible with the continuous improvement philosophy (Medori and Steeple, 2000, p. 521). Traditional and non-traditional performance measures are compared in Table 2.1 (shown
below):
Table 2.1: A comparison between traditional and non-traditional performance measures (*)
Characteristic Traditional performance measures Non-traditional performance measures
Basis of system Types of measures
Audience Frequency
Linkage with “reality”- real-life usage Acceptance - shop floor relevance Format
Local-Global relevance
Stability – (non)changing over time Purpose
Support for new improvement approaches (JIT, TQM, CIM, FMS, etc.)
Effect on continuous improvement
Outdated traditional accounting standards Mainly financial
Middle and top managers Lagging (weekly or monthly) Difficult, misleading, indirect Neglected at the shop floor Fixed
Static, non-varying Static, non-changing Monitoring and controlling Hard to adapt
Impedes / hinders
Company strategy
Mainly non-financial: operational, customer-oriented and financial;
All employees
Real-time (hourly or daily) – Dynamic Simple, easy to use, accurate, direct Frequently used at the shop floor Flexible/variable – depends on needs Dynamic, situation structure dependent Dynamic, change over time as the need change Supporting process/performance improvement Applicable
Supports
(*) Source: Ghalayini et al. (1997), Table 1, p. 210 and Ghalayini and Noble (1996), Table I, p. 68.
Following these changing needs, the classical performance measurement concept has shifted its focus from measuring and controlling to supporting continuity and the improvement of performance (Santos et al., 2007 and 2008). Thereby, functions such as being customer-oriented, having a long-term orientation and supporting continuous improvement became important. Performance frameworks were required to cover various aspects of the business needs (Wongrassamee et al., 2003; Ghalayini and Noble, 1996). Thus, having an integrated view of several performance dimensions became a necessary condition (Ghalayini et al., 1997). Neely et
al. (1995) highlighted this changing trend as shown in Table 2.2 (shown below). Gradually, this
led to an emerging need for improved performance measurement systems (Bititci and Turner, 2000). A new generation of performance frameworks was designed to facilitate interactions and causal relationships between elements of performance while addressing systems dynamically (Bititci et al., 2000; Neely et al., 1995).
Table 2.2: The main changes and trends in development of performance measurement systems (*)
Traditional performance measurement systems Innovative performance measurement systems Based on cost/efficiency
Trade-off between performances Profit-oriented
Short-term orientation
Prevalence of individual measures Prevalence of functional measures Comparison with standard Aim at evaluating
Value-based
Performance compatibility Customer-oriented Long-term orientation Prevalence of team measures Prevalence of transversal measures Improvement monitoring
Aim at evaluating and involving