pii: zsw060 http://dx.doi.org/10.1093/sleep/zsw060 ORIGINAL ARTICLE
Comparison Between Automatic and Visual Scorings of REM Sleep Without
Atonia for the Diagnosis of REM Sleep Behavior Disorder in Parkinson Disease
Michela Figorilli, MD1,2; Raffaele Ferri, MD3; Maurizio Zibetti, MD, PhD4; Patricia Beudin, MD5; Monica Puligheddu, MD, PhD2; Leonardo Lopiano, MD, PhD4; Alessandro Cicolin, MD6; Frank Durif, MD, PhD1,5; Ana Marques, MD1,5; Maria Livia Fantini, MD, PhD1,51EA 7280, Université Clermont Auvergne, Clermont-Ferrand, France; 2Sleep Disorders Center - Neurophysiology Unit, University of Cagliari, Cagliari, Italy; 3Department of
Neurology, Oasi Institute for Research on Mental Retardation and Brain Aging (IRCCS), Troina, Italy; 4Department of Neuroscience, University of Turin, Turin, Italy; 5Department of
Neurology, CHU Clermont-Ferrand, Clermont-Ferrand, France, 6Sleep Disorders Center, Department of Neuroscience, University of Turin, Turin, Italy
Study Objectives: To compare three different methods, two visual and one automatic, for the quantification of rapid eye movement (REM) sleep without atonia (RSWA) in the diagnosis of REM sleep behavior disorder (RBD) in Parkinson’s disease (PD) patients.
Methods: Sixty-two consecutive patients with idiopathic PD underwent video-polysomnographic recording and showed more than 5 minutes of REM sleep. The electromyogram during REM sleep was analyzed by means of two visual methods (Montréal and SINBAR) and one automatic analysis (REM Atonia Index or RAI). RBD was diagnosed according to standard criteria and a series of diagnostic accuracy measures were calculated for each method, as well as the agree-ment between them.
Results: RBD was diagnosed in 59.7% of patients. The accuracy (85.5%), receiver operating characteristic (ROC) area (0.833) and Cohen’s K coefficient (0.688) obtained with RAI were similar to those of the visual parameters. Visual tonic parameters, alone or in combination with phasic activity, showed high val-ues of accuracy (93.5–95.2%), ROC area (0.92–0.94), and Cohen’s K (0.862–0.933). Similarly, the agreement between the two visual methods was very high, and the agreement between each visual methods and RAI was substantial. Visual phasic measures alone performed worse than all the other measures. Conclusion: The diagnostic accuracy of RSWA obtained with both visual and automatic methods was high and there was a general agreement between meth-ods. RAI may be used as the first line method to detect RSWA in the diagnosis of RBD in PD, together with the visual inspection of video-recorded behaviors, while the visual analysis of RSWA might be used in doubtful cases.
Keywords: REM Sleep without Atonia, REM Sleep Behavior Disorder, Parkinson Disease, REM sleep atonia Index, Montréal method, SINBAR method.
INTRODUCTION
Rapid eye movement (REM) sleep behavior disorder (RBD) is a parasomnia characterized by partial or complete loss of nor-mal muscle atonia during REM sleep, associated with vivid dreams and dream-enacting behavior.1,2 RBD is very common in patients affected by neurodegenerative diseases, belonging to the group of alpha-synucleinopathies, namely Parkinson’s dis-ease (PD), Multiple System Atrophy, and Dementia with Lewy bodies.3–7 Several lines of evidence indicate that RBD in PD is a marker of a more widespread neurodegenerative process, par-ticularly associated to an increased risk for cognitive decline.8 Therefore, the correct identification of RBD in PD may bear important prognostic implications for patients and it might become critical when neuroprotective and disease modifying therapies will hopefully be available. REM sleep without atonia (RSWA) is the polysomnographic (PSG) hallmark for the diag-nosis of RBD, and consists of sustained (tonic) loss of normal muscle atonia during REM sleep, and/or intermittent (phasic) excessive electromyogram (EMG) activity during REM sleep.
A reliable quantification of RSWA is critical in order to diag-nose RBD, and various methods to assess motor activity during REM sleep have been developed. The first and widely accepted visual scoring method to quantify RSWA was originally devel-oped by Lapierre and Montplaisir9,10 (here referred to as the Montréal method) and subsequently validated in 2010 in a study
investigating a sample of eighty idiopathic RBD patients.10 Authors showed that the presence of >30% of 20-second epochs containing tonic EMG activity led to a correct classification of 82% of patients, while >15% of 2-second mini-epoch contain-ing phasic EMG activity led to a correct classification of 84% of them.9 The same method showed that most PD patients with RBD have >20% of 20-second epochs containing tonic EMG activity.11 The Montréal method has also been shown to perform similarly if 30-second epochs are used.12
Moreover, the Barcelona and Innsbruck groups, known as SINBAR group, performed a study comparing RSWA assessed in 11 different body muscles, and in different combinations, in a group of 30 RBD patients including 15 PD.13 Authors found that a montage including upper limb plus chin EMG derivations better differentiated RBD patients from control subjects than chin alone.13 Specifically, among other measures, a cut-off of >32% of 3-second REM sleep epochs containing the combina-tion of any (either tonic or phasic) chin EMG activity and bilat-eral Flexor Digitorum Superficialis (FDS) phasic EMG activity brought the best discriminative power.13
More recently, based on data published by the SINBAR group,13–16 a cut-off value of 27% of 30-second epochs of REM sleep containing any (either tonic or phasic) chin EMG activity combined with bilateral FDS EMG phasic activity, was indi-cated to be the most current evidence-based data for detecting Statement of Significance
The diagnosis of RBD in Parkinson’s disease is often challenging, because of subclinical forms, but it may bring prognostic and therapeutic implications. A reliable quantification of REM sleep without atonia (RSWA) is critical in order to diagnose RBD, and various methods, either visual or automatic, have been developed. Visual methods are time-consuming and require specialized expertise. We compared the diagnostic accuracy of two widely used visual meth-ods and one automatic, in the diagnosis of RBD in PD, finding a substantial agreement. The automatic method may be used as first line to detect RSWA in diagnosing RBD in PD, together with the inspection of video-recorded behaviors, while the visual analysis of RSWA might be used in doubtful cases.
RSWA in the diagnosis of RBD by the American Academy of Sleep Medicine (AASM), as mentioned in the International Classification of Sleep Disorders third edition (ICSD-3).17 However, manual-visual scoring is time consuming and requires specialized expertise, making it little convenient in the clinical practice. Additionally, these methods have been validated only in small cohorts of PD patients.
Recently, an automatic scoring algorithm, also known as the REM sleep Atonia Index (RAI), has been developed in order to overcome these limits.18,19 RAI showed a good sensitivity, specificity, and correct classification, with general agreement between methods and Cohen’s kappa values in the “good” range when compared with the Montréal method in a recent study including seventy-four idiopathic RBD patients.12 So far, no study has compared the accuracy, sensitivity, and specificity of RSWA measures obtained with the three methods, namely the automated and the manual-visual ones, in patients with PD.
Thus, the aims of this present study were: (1) to assess the con-cordance of the two visual scoring methods for RSWA, namely the Montréal10 and the SINBAR13 approaches, in patients with PD and (2) to compare the RAI automated method18 with the two visual scoring methods, in order to assess their correct clas-sification accuracy and reciprocal agreement, as well as their role in the clinical diagnosis of RBD in PD.
SUBJECTS AND METHODS Subjects
Seventy-three (44 male, 29 female, mean age 64.10 ± 8.47 years) non-demented PD patients, consecutively seen at two Movement Disorder Centers, namely the University Hospital in Clermont-Ferrand, France (n = 63), and the Le Molinette University Hospital in Turin, Italy (n = 10), for their routine evaluation, were recruited. The inclusion criterion was the diagnosis of idi-opathic PD based on the United Kingdom PD Society Brain Bank Criteria.20 Exclusion criteria were the presence of alterna-tive causes of parkinsonism, a concomitant dementia (defined by a score <26 in the Mini Mental State Examination, MMSE), the presence of a psychiatric disease according to the Diagnostic Statistical Manual (DSM-V), the use of device aided therapy, such as subcutaneous Apomorphine infusion, intra-duodenal gel infusion or deep brain stimulation. RDB was either diag-nosed or ruled out according to the ICSD-3 criteria.17 Patients were examined by a neurologist expert in Sleep Medicine (MLF, MZ) who conducted an in-depth interview, focused on RBD history and features. PD history and symptoms, as well as treatment data were collected by neurologist expert in move-ment disorders (AM, FD, MZ). The Total Levodopa Equivalent Daily Dose (LEDD), together with the Dopamine Agonist (DA) Levodopa Equivalent Daily Dose (DA-LEDD) were calculated according to Tomlinson et al.21 The Ethical committee of each center (Clermont-Ferrand, France; Turin, Italy) approved the study and all patients gave written informed consent, according to the Declaration of Helsinki.
PSG Recordings
All patients underwent one full-night attended video-polysom-nography (video-PSG) recording in sleep laboratory with digital
polysomnography according to the AASM recommendations.22 Video-PSG was performed with digitally synchronized vide-ography and the following montage was employed: electroen-cephalographic leads (F3-A2, F4-A1, C3-A2, C4-A1, O1-A2, O2-A1), left and right electrooculography (EOG) channels, bilateral surface EMG channels (submentalis, FDS on upper limbs, and tibialis anterior on lower limbs), and electrocardi-ography. The respiratory analysis included nasal airflow, which was recorded by both thermistor and nasal pressure sensor, thoracic, and abdominal respiratory effort, oxygen saturation recording by cutaneous finger pulse-oxymeter and microphone. Patients were asked to sleep uncovered in order to improve the detection of motor activity, but a light sheet could be allowed for their comfort.
Sleep stages were scored according to AASM criteria,22 with allowance to chin EMG muscle tone during REM sleep. The following sleep data were collected for descriptive purpose: total bed time, total sleep time, sleep efficiency, sleep latency, wake after sleep onset (W), number of REM sleep episode, per-centage of time in each sleep stage (N1, N2, N3, R), arousal index, periodic limb movements index, Apnea-hypopnea index, oxygen-desaturation index, arousal index.
Diagnosis of RBD
The diagnosis of RBD was made according to the ICSD-3,17 including a quantitative measure of RSWA, namely “any chin EMG activity, tonic and/or phasic, combined with bilateral pha-sic activity of the flexorum digitorum superficialis (FSD) mus-cle” in ≥27% of REM sleep scored in 30-second epochs. The rational to choose this cut-off, based on the SINBAR method,16 as reference standard, relies on the fact that the latter has been included in the ICSD-3 “as the most current evidence-based data for detecting RSWA in the evaluation of RBD, reliably distin-guishing RBD patients from controls.” Patients were excluded from the analysis if they had spent less than 5 minutes in REM sleep, since this REM duration was believed to be insufficient for a reliable assessment of RSWA. Each video-recorded REM sleep period was carefully analyzed in order to detect any motor behaviors or sleep vocalizations referable to RBD, such as vio-lent and non-viovio-lent motor complex activity.
RSWA Visual Scoring Methods
The manual-visual scoring of RSWA was performed accord-ing to two previously published methods, the Montréal,9,10 adapted to 30-second epochs,12 and the SINBAR method.13,14,16 The EMG activity of the chin and bilateral FDS were analyzed. REM sleep epochs were carefully examined for artifacts, and increases in EMG tone caused by respiratory arousal were excluded. The minimum amplitude of EMG activity during non-REM (NREM) sleep was considered as the background EMG activity for each patient. The EMG signal was analyzed with a notch filter at 50 Hz and rectified. Visual scoring was performed by a single sleep-specialist scorer (MF), who was blinded to RBD history.
The Montréal Method
According to the method described elsewhere,9,10 adapted to 30-second epochs, each epochs was scored as “tonic” when
the increased sustained EMG activity was present in more than 50% of the 30-second epoch duration, with an amplitude a least twice the background EMG muscle tone, or more than 10 µV; otherwise epochs were scored as atonic. Tonic EMG density represented the percentage of 30-second epoch scored as tonic. Phasic chin EMG activity was scored dividing each 30-second epoch into 2-second mini-epochs; the phasic EMG activity can be scored both in atonic and tonic epochs. Phasic chin EMG density represented the percentage of 2-second mini-epochs containing EMG events lasting 0.1–10 seconds, with amplitude exceeding four times the amplitude of background EMG activ-ity. According to previous findings, REM sleep chin EMG activity was considered to be abnormal when tonic chin EMG density was ≥30% and/or phasic chin EMG density was ≥15%.10
The SINBAR Method
The analysis was made according to previous published data by the SINBAR group,13,14,16 evaluating chin EMG activity, as tonic, phasic or “any” (either tonic or phasic), and phasic EMG activity at bilateral FDS muscle. Each epoch was scored as “tonic” when the increased sustained EMG activity was pres-ent in more than 50% of the 30-second epoch duration with an amplitude at least twice the background EMG muscle tone, or more than 10 µV. Phasic EMG activity was scored into 3-sec-ond mini-epochs, and was defined as any burst of EMG activ-ity lasting 0.1 to 5 seconds with amplitude exceeding twice the background EMG activity. Phasic chin EMG burst super-imposed on a background of tonic activity, during a 3-second mini-epoch, was required to have at least twice the amplitude of the background tonic EMG activity within the same 3-sec-ond mini-epoch. Each 3-sec3-sec-ond mini-epoch was scored hav-ing or not “any” EMG activity, when containhav-ing either tonic and/or phasic EMG activity within the same mini-epoch, in order to include EMG activity lasting from 5 to 15 seconds, that was not measured in previous method. The percentages of 3-second mini-epochs containing phasic chin EMG activ-ity as well as “any” chin EMG activactiv-ity, out of the total REM sleep mini-epochs, was calculated. The percentage of 3-sec-ond mini-epochs with “any chin EMG activity combined with bilateral phasic FDS EMG activity,” out of the total REM sleep 3-second mini-epochs, was also calculated. The percentage of 30-second epochs containing five or more 3-second mini-ep-ochs with “any chin EMG activity combined with bilateral phasic FDS EMG activity” out of the total REM sleep epochs was calculated. The SINBAR group found the best specificity and sensitivity with the following cut-off values: >16.3% of 3-second mini-epochs with phasic chin EMG activity, >18% of 3-second mini-epochs with any chin EMG activity, >32% of 3-second mini-epochs with any chin EMG activity combined with bilateral phasic EMG activity in the FDS, and >27% of 30-second epochs with any chin EMG activity combined with bilateral phasic EMG activity in the FDS.
RSWA Automatic Scoring (RAI)
The automatic quantification of chin EMG activity was made according to an established automatic scoring algorithm,18,19,23 by means of the HypnoLab software (SWS-Soft, Italy). The chin EMG signal was digitally band-pass filtered at 10–100
Hz, with a notch filter at 50 Hz and rectified. Each sleep epoch included in the analysis was divided into 1-second mini-epochs, and the average amplitude of the rectified chin EMG signal was obtained for each mini-epoch. After a noise reduction proce-dure,18 the values of the chin EMG signal amplitude in each 1-second mini-epoch were used to compute the percentage of values in the following 20 amplitude (amp) classes, expressed in µV: amp ≤ 1, 1 < amp ≤ 2, …, 18 < amp ≤ 19, amp > 19. Muscle atonia is revealed by high values of the first class (amp ≤ 1) whereas phasic and tonic activations are expected to increase the value of the other classes.18,19 An index summarizing in a single value the degree of preponderance of the first class was used in REM sleep: RAI = amp ≤ 1/(100–1 < amp ≤ 2). RAI can vary from 0 (absence of mini-epochs with amp ≤ 1 that is complete absence of EMG atonia) to 1 (all mini-epochs with amp ≤ 1 or stable EMG atonia in the epoch). RAI values < 0.8 are strongly indicative of altered (reduced) chin EMG atonia during REM sleep; while values of RAI between 0.8 and 0.9 indicate a less evident alteration of atonia, and values above 0.9 are characteristic of normal recordings.18 RAI was computed completely blinded to the results of the manual scoring methods and to the RBD status of the patients.
Statistical Analysis
Between-group differences on clinical, demographic, and video-PSG features were assessed with the Student’s t test. Specificity, sensitivity, positive predictive value (PPV), neg-ative predictive value (NPV), and correct classification of RBD were assessed for the following parameters: RAI < 0.8, tonic chin EMG density ≥ 30%, phasic chin EMG density ≥ 15% (scored in 2-second mini-epoch) and ≥ 16.3% (scored in 3-second mini-epoch), any chin EMG activity scored in 3-sec-ond mini-epoch ≥ 18%, any 3-sec3-sec-ond mini-epoch chin EMG combined with bilateral phasic FDS EMG activity ≥ 32% and any 30-second epoch chin EMG combined with bilateral pha-sic FDS EMG activity ≥ 27%. The accuracy of the different parameters to discriminate RBD from no-RBD patients was evaluated using receiver operating characteristic (ROC) curve analysis and the calculation of the area under the curve (AUC). Additionally, the weighted comparison (WC) measure24 was calculated for any chin EMG combined with bilateral phasic FDS EMG activity ≥ 27% in 30-second epoch versus all other methods; WC is an index weighting the difference in sensitivity and difference in specificity of two tests, taking into account the relative clinical cost (misclassification costs) of a false positive compared with a false negative diagnosis and disease preva-lence. WC was then converted into an equivalent increase in true positive patients per 1000 (if all the benefit is focused into true positive patients) by calculating WC × prevalence × 1000. Finally, the extent of the agreement of the different methods was quantified by means of Cohen’s K coefficient.
RESULTS Subjects
Of the original 73 patients, four did not have any REM sleep during video-PSG and seven had REM sleep duration shorter than 5 minutes, therefore they were excluded from the study.
The comparison of the three methods was then possible in 62 PD patients (35 male, 27 female, mean age 64.7 ± 8.72 years). RBD was diagnosed in 37 out of 62 of our PD patients (PD-RBD; 59.7%), according to the ICSD-3 criteria,17 including the pres-ence of ≥27% of 30-second epochs of REM sleep containing any chin EMG activity or bilateral FDS phasic EMG activity. The remaining 25 patients constituted the PD-noRBD group. The clinical and demographic features of our patients are shown
in Table 1. There were no significant between-group differences,
in age, gender, duration, and severity of PD (assessed by Hoehn & Yahr stage and Unified Parkinson Disease Rating Scale). All patients were taking dopamine replacement therapy (n = 61 lev-odopa, n = 34 DA), and no difference in LEDD and DA-LEDD was found between the two groups. A total of nine patients were taking drugs known to potentially increase RSWA. More specifically five patients were taking antidepressants (selective serotonin re-uptake inhibitor, SSRI). Among them, three had RBD (two of them developed RBD prior to starting antidepres-sant therapy) while two didn’t have RBD. Four patients (three PD-RBD) were taking beta-blockers, and RBD preceded the initiation of this treatment in two cases. On the other hand, five (three PD-RBD) out of 62 patients were receiving clonazepam, and none was taking melatonin.
PSG Results
The PSG features are reported in Table 2. There were no sig-nificant differences between PD patients with or without RBD for sleep architecture, periodic leg movements index, and apnea/hypopnea index. Only the amount of REM sleep was
significantly lower in the group of PD-RBD patients compared to PD-noRBD.
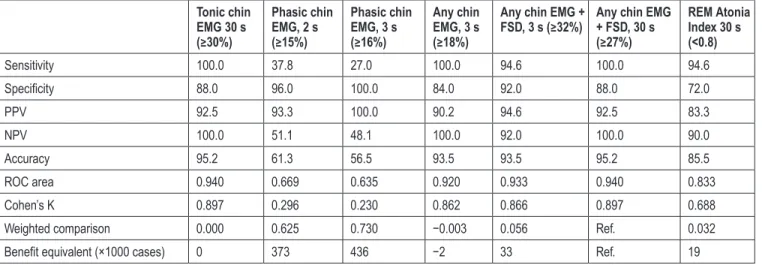
Comparison of the Different RSWA Scoring Methods
For the visual scoring, a total of 4777 30-second epochs of REM sleep have been obtained, leading to 47 770 3-second mini-ep-ochs and 71 655 2-second mini-epmini-ep-ochs, respectively. Of these, 178 (0.37%) 3-second mini-epochs and 275 (0.38%) 2-second mini-epochs containing arousal-related both EMG activity or movement artifacts were excluded from the analysis. For the automated scoring, a total of 64 (1.34%) 30-second epochs of REM sleep containing artifacts were excluded. Data about EMG tone parameters obtained in PD patients with or without RBD are shown in Table 3. Table 4 summarizes the analysis of the performance of the three methods, one automatic (RAI) and two visual (Montréal, SINBAR), to evaluate RSWA versus the clinical diagnosis of RBD in our patients with PD. The accu-racy of both visual methods was high and very similar for those parameters including measures of tonic activities (alone or in combination with phasic activities) that we will call here “tonic” for simplicity. The same was not true for parameters taking into consideration only phasic activities. In particular, the 30-second tonic chin EMG density showed an accuracy of 95.2, an AUC of 0.940, and Cohen’s K coefficient of 0.897, as well as the percentage of “any chin EMG activity combined with bilateral phasic EMG activity at FDS,” scored in 30-second epoch. Both of these parameters showed the highest PPV (92.5), NPV (100), sensitivity (100%), and specificity (88%). The percentage of 3-second mini-epochs with “any chin EMG activity” showed an accuracy of 93.5, an AUC of 0.920, a Cohen’s K coefficient of 0.862, a sensitivity of 100%, and a specificity of 84%. The per-centage of 3-second mini-epochs with “any chin EMG activity Table 1—Clinical and Demographic Features of PD Patients With and
Without RBD. PD-RBD (n = 37) PD-noRBD (n = 25) p Males 24 (64.9) 11 (44.0) NSa Age, y 66.0 ± 7.5 62.7 ± 10.1 NS Bed partner 17 (45.9) 11 (44.0) NSa PD duration, y 8.2 ± 4.3 8.0 ± 5.0 NS H&Y stage 2.2 ± 0.5 2.1 ± 0.6 NS UPDRS III 18.1 ± 11.1 16.2 ± 9.5 NS UPDRS-tot 35.5 ± 18.3 31.4 ± 19.4 NS LEDD, mg 796.2 ± 486.0 704.4 ± 421.9 NS DA-LEDD, mg 106.9 ± 125.9 123.9 ± 139.3 NS SSRI 3 (8.1) 2 (8.0) NSa Clonazepam 2 (5.4) 3 (12.0) NSa
DA-EDD = Dopamine-agonist equivalent daily dose; H&Y = Hoehn and Yahr; LEDD = Levodopa equivalent daily dose; PD = Parkinson’s dis-ease; RBD = REM sleep behavior disorder; SSRI = selective serotonin re-uptake inhibitor; UPDRS III = Unified Parkinson’s disease rating scale III. Data are expressed as mean ± standard deviation or number(per-centage of total).
aFisher-test.45
Table 2—Polysomnographic Features of PD patients with and without RBD.
PD-RBD
(n = 37) PD-noRBD (n = 25) p
Total sleep time, min 321.5 ± 82.9 326.7 ± 81.0 NS Sleep efficiency, % 72.8 ± 17.3 72.1 ± 18.3 NS W, min 90.5 ± 79.5 96.5 ± 77.6 NS N1, % 10.4 ± 8.4 8.5 ± 6.2 NS N2, % 58.0 ± 12.3 58.6 ± 15.7 NS N3, % 21.04 ± 13.0 19.1 ± 11.7 NS R, % 10.5 ± 5.5 13.7 ± 8.2 NS R, min 34.1 ± 21.4 45.0 ± 29.8 .01 PLMS, number 123.5 ± 143.8 113.0 ± 183.0 NS PLMS index 23.8 ± 25.7 24.5 ± 44.5 NS Apnea/hypopnea index 5.5 ± 9.2 2.9 ± 3.9 NS PD = Parkinson’s disease; PLMS = Periodic leg movements during sleep; RBD = REM sleep behavior disorder. Data are expressed as mean ± standard deviation.
combined with bilateral phasic EMG activity at FDS” showed an accuracy of 93.5, a ROC area of 0.933, a Cohen’s K coeffi-cient of 0.866, a sensitivity of 94.6%, and a specificity of 92%. Finally, the percentage of phasic chin EMG activity scored in 2-second mini-epoch and 3-second mini-epoch showed, respec-tively, an accuracy of 61.3 and 56.5, a ROC area of 0.669 and 0.635, a Cohen’s K coefficient of 0.296 and 0.230, a sensitiv-ity of 37.8% and 27%, and specificsensitiv-ity respectively of 96% and 100%. The PPV and the NPV values for the phasic chin EMG activity scored in 2-second mini-epoch were 93.3 and 51.1
respectively, while for the phasic chin EMG activity scored in 3-second mini-epoch was 100 and 48.1 respectively. RAI, with a cut-off value < 0.8, showed an accuracy of 85.5, a ROC area of 0.833, a Cohen’s K coefficient of 0.688, high sensitivity (94.6%), and good specificity (72%), with a PPV of 83.3 and NPV of 90.
Table 4 also reports the WC between the results obtained by
the reference method (ie, SINBAR 30-second epochs of REM sleep containing any chin EMG activity or bilateral FDS phasic EMG activity ≥ 27%) and all the other methods. A very good agreement with the above measures was found, indicating a substantial equivalence between the reference and the Montréal tonic chin EMG density ≥ 30%, as well as the SINBAR any chin EMG activity scored in 3-second mini-epochs ≥ 18%. Surprisingly, the latter seemed to perform slightly better than the reference method using WC, translating into a benefit equiv-alent of 2 additional true positives × 1000 cases. Moreover, the reference method showed only a relatively small advantage compared to the RAI, which could be translated into a benefit equivalent of 19 true positives × 1000 cases.
Table 5 illustrates the agreement (Cohen’s K coefficient)
between all possible pairs of measures of RSWA used in this study. The agreement between tonic chin EMG density and the visual parameter “any chin EMG activity combined with bilateral phasic FDS EMG activity in 30-second” was perfect (K = 1.000), while the agreement between tonic chin EMG den-sity and the visual parameters “any chin EMG activity, scored in 3-second” and “any chin EMG activity combined with bilat-eral phasic FDS EMG activity in 3-second” was almost per-fect25 (respectively, K = 0.964 and K = 0.897). The agreement between RAI < 0.8 and all visual parameters was substantial (K = 0.784 with tonic chin EMG density, K = 0.745 with any chin EMG activity, scored in 3-second, K = 0.688 any chin EMG activity combined with bilateral phasic FDS EMG activ-ity in 3-second, K = 0.784 any chin EMG activactiv-ity combined with bilateral phasic FDS EMG activity in 30-second), except Table 3—EMG Tone Parameters in PD Patients With or Without RBD.
PD-RBD
(n = 37) PD-noRBD (n = 25) p
Tonic EMG chin 30 s, % 58.5 ± 20.1 10.0 ± 7.9 .00001 Phasic EMG 2 s, % 8.9 ± 6.3 2.5 ± 1.5 .00001 Phasic EMG chin 3 s, % 11.8 ± 8.1 3.6 ± 2.3 .00001 Any EMG Chin 3 s, % 50.6 ± 18.1 12.2 ± 5.9 .00001 Any EMG chin + FSD 3 s, % 53.5 ± 16.6 15.0 ± 6.1 .00001 Any EMG chin + FSD 30 s, % 60.4 ± 19.6 11.1 ± 7.2 .00001 REM atonia index 0.442 ± 0.2 0.830 ± 0.2 .00001 Tonic EMG chin 30 s, % 58.5 ± 20.1 10.0 ± 7.9 .00001 Phasic EMG 2 s, % 8.9 ± 6.3 2.5 ± 1.5 .00001 Phasic EMG chin 3 s, % 11.8 ± 8.1 3.6 ± 2.3 .00001 Any EMG Chin 3 s, % 50.6 ± 18.1 12.2 ± 5.9 .00001 EMG = electromyography; FSD = flexorum digitorum superficialis; PD = Parkinson’s disease; RBD = REM Sleep Behavior Disorder; REM = Rapid Eye Movements; 30-s = 30 seconds epoch; 2-s = 2 sec-onds mini-epochs; 3-s = 3 secsec-onds mini-epochs. Data are expressed as mean ± standard deviation.
Table 4—Accuracy of Measures of RSWA, Based on Their Suggested cut-offs, for the Clinical Diagnosis of RBD in PD Patients. Tonic chin EMG 30 s (≥30%) Phasic chin EMG, 2 s (≥15%) Phasic chin EMG, 3 s (≥16%) Any chin EMG, 3 s (≥18%)
Any chin EMG +
FSD, 3 s (≥32%) Any chin EMG + FSD, 30 s (≥27%) REM Atonia Index 30 s (<0.8) Sensitivity 100.0 37.8 27.0 100.0 94.6 100.0 94.6 Specificity 88.0 96.0 100.0 84.0 92.0 88.0 72.0 PPV 92.5 93.3 100.0 90.2 94.6 92.5 83.3 NPV 100.0 51.1 48.1 100.0 92.0 100.0 90.0 Accuracy 95.2 61.3 56.5 93.5 93.5 95.2 85.5 ROC area 0.940 0.669 0.635 0.920 0.933 0.940 0.833 Cohen’s K 0.897 0.296 0.230 0.862 0.866 0.897 0.688
Weighted comparison 0.000 0.625 0.730 −0.003 0.056 Ref. 0.032
Benefit equivalent (×1000 cases) 0 373 436 −2 33 Ref. 19
EMG = electromyography; FSD = flexorum digitorum superficialis; NPV = negative predictive value; PD = Parkinson’s disease; PPV = positive predic-tive value; RBD = REM Sleep Behavior Disorder; Ref. = Reference method; REM = Rapid Eye Movements; ROC = receiver operating characteristic; RSWA = REM sleep Without Atonia.
for phasic parameters. The percentages of 3-second or 2-second mini-epochs containing phasic EMG activity performed worse than the other parameters, showing lowest sensitivity, accuracy, AUC area, and the Cohen’s K coefficient, whereas they showed good specificity and good positive predictive value. Also WC between the reference method and the phasic parameters was greatly in favor of the reference method.
DISCUSSION
The diagnosis of RBD relies on the presence of an excessive muscle tone during REM sleep but the definition of RSWA is still mostly qualitative, based on the scorer’s subjective impres-sion, rather than on a clear cut-off value. Recently published ICSD-3 criteria have specified to quantify RSWA “as defined by the guidelines for scoring PSG features of RBD in the most recent version of the AASM Manual for the Scoring of Sleep and Associated Events,”22 but the latter does not indicate an uni-vocal way to quantify RSWA.17 However, several methods have been developed to measure EMG activity during REM sleep and detect RSWA, showing good sensitivity and specificity to discriminate RBD from no-RBD patients.9,10,13,23,26–32 Among them, the ICSD-317 indicates the SINBAR13 method (>27% of 30-second epochs containing any chin EMG activity combined with bilateral phasic EMG activity in the FDS) as one of the most current evidence-based approaches for detecting RSWA in the evaluation of RBD and, for this reason, we used as the reference method for the subsequent comparison with other methods.
In this study, all three scoring methods assessing RSWA in PD, two visual and one automatic, showed high sensitivity, specificity and accuracy, especially “tonic” or “any EMG activ-ity” parameters, while visual parameters considering only “pha-sic” EMG activities were associated to lower sensitivity and accuracy. First, this study found perfect or almost perfect agree-ment between the two visual scoring methods, Montréal and SINBAR, when they consider tonic EMG activities alone or in combination with phasic activities, but not when they measure only phasic activities. Moreover, we found a substantial agree-ment between the automatic scoring method, for example, the RAI, and the Montréal and SINBAR visual scoring methods, when they consider tonic EMG activities alone or in combi-nation with phasic activities, but not when they measure only
phasic activities. These findings confirm previous published data suggesting a good correlation between Montréal method and RAI in patients with idiopathic RBD,12,19 multiple system atrophy,19 or narcolepsy.23
Visual and automated assessment may differ in some technical aspects, namely the standard of rejection of periods containing artifacts. Indeed, in visual assessment, only mini-epochs con-taining arousal-related EMG activity are eliminated, while in RAI, 30-second epochs containing major artifacts are excluded, leading to a potential increase in artifact time rejection when assessing RAI that may represent a limitation. However, it has to be pointed out that, in this study, the percentage of rejection was very narrow for both visual and automatic methods (0.4% and 1.3% respectively), making unlikely that this difference would have a significant impact on the results.
It should be pointed out that the diagnosis of RBD was per-formed according to the ICSD-3 criteria that encompass one of the measures derived from the SINBAR method (namely the percentage of 30-second epochs with any chin EMG activ-ity combined with bilateral phasic FDS EMG activactiv-ity, with a cut-off value of 27%). Thus, the sensitivity of this particular parameter is necessarily equal to 100% and its performance in accuracy is maximal by definition because of this choice; conversely all the other parameters may be penalized to some extent.
Diagnosing RBD in PD is not a simple task, because of many reasons. First, PD patients with RBD may often have PSG abnormalities either alone (RSWA) or with mild non-clinical behaviors in sleep, such as limb twitching or jerking or sim-ple vocalizations that may go unnoticed by the patient himself, particularly if sleeping alone, or by bed-partners (subclinical RBD2,33,34). Moreover, video-behavioral episodes recorded in the sleep lab are often less elaborated and violent compared to those occurring at home, and the minimum amount or duration of video-recorded REM sleep motor behavior required to diag-nose RBD is not currently defined.
However, since RBD in PD appears to be associated to a more widespread degenerative process,35 with a particular increased risk for cognitive decline,36 the diagnosis of RBD in PD may bear important prognostic and perhaps therapeutic implications in the next future, when disease modifying therapies would hopefully be available. Indeed, at that point, costs and benefits Table 5—Cohen’s K (agreement) Between All Possible Pairs of Measures of RSWA.
Phasic chin
EMG, %2 s Phasic chin EMG, %3 s Any chin EMG, %3 s Any chin EMG + FSD, %3 s Any chin EMG + FSD, %30 s REM atonia index <0.8
0.299 0.191 0.964** 0.897** 1.000*** 0.784* Tonic chin EMG, % 30 s
0.752* 0.281 0.355 0.299 0.264 Phasic chin EMG, % 2 s
0.179 0.230 0.191 0.168 Phasic chin EMG, % 3 s
0.862** 0.964** 0.745* Any chin EMG, % 3 s
0.897** 0.688* Any chin EMG + FSD, % 3 s 0.784* Any chin EMG + FSD, % 30 s EMG = electromyography; FSD = flexorum digitorum superficialis; REM = Rapid Eye Movements; RSWA = REM sleep Without Atonia.
should be weighted, especially in case of potential severe side effects, and the presence of RBD would represent a strong argu-ment in favor of an eventual disease-modifying strategy.
It has been suggested that the chin EMG alone does not dis-criminate sufficiently patients from controls. Indeed, in a study on idiopathic RBD, no phasic chin EMG activation was found in 35.5% of the behavioral events observed by video-monitor-ing, while the simultaneous recording of the mentalis, FDS and extensor digitorum brevis EMG activity was able to detect the highest rates of REM sleep phasic EMG activity, as well as the majority (94.4%) of the motor and vocal manifestations occurring in RBD.16 The authors thus recommended a montage including both chin and bilateral FDS muscles for the detection of RBD. Following this study, the ICSD-3 indicates a percent-age ≥32% of 30-second epochs containing any tonic or phasic chin EMG activity and/or bilateral phasic FDS activity as a reli-able way to define RSWA in RBD.
The addition of FDS metrics, in the present study, did not seem to provide an enhanced diagnostic power compared to the assessment of the chin EMG activity alone. Including FSD channels within the routine full PSG montage in PD patients may be time-consuming and add discomfort to the patient. Unless a clear diagnostic benefit is demonstrated from further studies performed by different groups,13,15 the quantification of FDS activity in the clinical work-up may be questionable, as our findings in patients with PD seem to indicate. On the other hand, recording FDS appears to be of great help in identifying video behavioral episodes when increased phasic EMG activity is observed in these leads on PSG recording.
Our data confirm that the automatic detection of RSWA is highly correlated with manual-visual measures in PD patients. This result is consistent with previous study comparing the RAI with the Montréal visual scoring method.12 Other studies showed an excellent comparability of the RAI to one visual chin analysis similar to the SINBAR method, assessing directly phasic burst, in PD patients with RBD,27 or RBD patients with depression,37 and normal aging.38 Quantification of RSWA is time-consuming and often unavailable in the clinical prac-tice, while automatic analysis is fast and highly replicable. Furthermore, a limitation of both Montreal and SINBAR visual methods is that they rely on binary measures (ie, posi-tive or negaposi-tive), while the RAI method, as well as other visual scoring approach,27 rely on more continuous measures, being more suitable for assessing biological activity like RSWA. On the other hand, the automatic analysis may have some disad-vantages, such as incomplete sensitivity in detecting large arti-facts, and is not included in most commercial sleep analysis software packages. However, in light of these results, it can be reasonably recommended that, in the clinical practice, auto-matic assessment of RSWA might be used first, with visual analysis employed when the automatic analysis cannot be applied for technical reasons, or in doubtful cases, together with the visual inspection of video recorded behaviors.
In the present study we found that PD-RBD patients have more “tonic” rather than phasic EMG activity alteration dur-ing REM sleep, suggestdur-ing a peculiar RBD phenotype in PD. The latter appears to be different from the idiopathic phenotype and from RBD associated with narcolepsy,23,39 and it seems to be more similar to that found in patients with multiple system
atrophy,19,40 but perhaps with a lower degree of tonic alteration. Indeed, PD patients with RBD may have milder motor behav-iors according to previous findings.40–43 This may be related to the neurodegenerative process itself, perhaps leading to an impairment of brain structures involved in muscle phasic activ-ity generation. On the other hand, idiopathic RBD patients seeking medical attention are likely to be those with the most violent motor behaviors, and the prevalence of subclinical RBD in the general population is largely unknown. Further studies are warranted to ascertain whether PD patients have a reduced phasic EMG activity or an increased tonic EMG activity, or both, compared to idiopathic RBD.
Our study has some potential limitations. As in a previous paper,12 we adapted the original “Montreal method” from 20-second to 30-second epochs, according to the current American Sleep Disorders Association (ASDA) recommenda-tions for scoring sleep stages, but we choose to maintain the 2-second mini-epoch approach to score phasic activity. First, one must bear in mind that the choice of epochs length (30-sec-ond vs. 20-sec(30-sec-ond) may impact on the tonic metrics, since more than 15 seconds rather than 10 seconds of tonic activity are required to score the whole epoch as “tonic,” potentially leading to lower scores in the tonic activity using 30-second epoch windows compared to 20-second epochs. This has been shown by the works of the SINBAR groups.13 Second, pha-sic activity consists in the ratio between the number of phapha-sic mini-epochs and the total number of REM sleep mini-epochs and would not be affected by the epoch length. However, it may be argued than the total amount of 2-second mini-epochs, using 30-second epochs window, may be slightly higher than the one found using 20-second epoch window (because of the possible inclusion of NREM mini-epochs within REM sleep mini-epochs), leading to possible small differences in the 2-sec mini-epochs phasic metrics. Nevertheless, the difference was shown to be negligible and not to affect the correct classifica-tion of patients and controls in a previous study.12 On the other hand, it is known that the two different visual methods implying the use of 2-second mini-epochs rather than 3-sec, may poten-tially lead to differences in phasic EMG activity assessment, for example when the same burst of EMG activity overlaps two consecutive mini-epochs in one case and falls within one only mini-epoch in the other case. Indeed, in our study, the percent-age of phasic EMG chin activity assessed in 3-second mini-ep-ochs was slightly higher than that of 2-second, as it is illustrated
in Table 3. The same can be evicted from past works,10,13,39,44
although no genuine comparisons can be made between the two methods because of the heterogeneity of the RBD populations included in these studies.
In conclusion, we found a substantial agreement between the automatic method (RAI) and the “tonic” parameters of the two visual methods (Montréal, SINBAR). Therefore, the auto-matic evaluation of EMG activity during REM sleep, together with visual inspection of video recorded behaviors, may be the first-line method to detect RSWA in PD patients, while visual scoring of RSWA may be useful in doubtful cases. Moreover, a peculiar pattern of REM sleep muscle tone alteration, mainly characterized by an increased tonic, rather than phasic, activity, seems to characterize RBD in PD, in contrast to what observed in both idiopathic and narcolepsy-related RBD.
REFERENCES
1. Schenck CH, Bundlie SR, Ettinger MG, Mahowald MW. Chronic behav-ioral disorders of human REM sleep: a new category of parasomnia. Sleep. 1986; 9(2): 293–308.
2. Schenck CH, Mahowald MW. REM sleep behavior disorder: clinical, developmental, and neuroscience perspectives 16 years after its formal identification in SLEEP. Sleep. 2002; 25(2): 120–138.
3. Boeve BF, Silber MH, Saper CB, et al. Pathophysiology of REM sleep behaviour disorder and relevance to neurodegenerative disease. Brain. 2007; 130(pt 11): 2770–2788.
4. Postuma RB, Gagnon JF, Vendette M, Montplaisir JY. Markers of neuro-degeneration in idiopathic rapid eye movement sleep behaviour disorder and Parkinson’s disease. Brain. 2009; 132(pt 12): 3298–3307.
5. Boeve BF. REM sleep behavior disorder: updated review of the core features, the REM sleep behavior disorder-neurodegenerative disease association, evolving concepts, controversies, and future directions. Ann N Y Acad Sci. 2010; 1184: 15–54.
6. Iranzo A, Fernández-Arcos A, Tolosa E, et al. Neurodegenerative dis-order risk in idiopathic REM sleep behavior disdis-order: study in 174 patients. PLoS One. 2014; 9(2): e89741.
7. Iranzo A, Tolosa E, Gelpi E, et al. Neurodegenerative disease status and post-mortem pathology in idiopathic rapid-eye-movement sleep behav-iour disorder: an observational cohort study. Lancet Neurol. 2013; 12(5): 443–453.
8. Postuma RB, Gagnon JF, Vendette M, Montplaisir JY. Idiopathic REM sleep behavior disorder in the transition to degenerative disease. Mov Disord. 2009; 24(15): 2225–2232.
9. Lapierre O, Montplaisir J. Polysomnographic features of REM sleep behavior disorder: development of a scoring method. Neurology. 1992; 42(7): 1371–1374.
10. Montplaisir J, Gagnon JF, Fantini ML, et al. Polysomnographic diagnosis of idiopathic REM sleep behavior disorder. Mov Disord. 2010; 25(13): 2044–2051.
11. Gagnon JF, Bédard MA, Fantini ML, et al. REM sleep behavior disorder and REM sleep without atonia in Parkinson’s disease. Neurology. 2002; 59(4): 585–589.
12. Ferri R, Gagnon JF, Postuma RB, Rundo F, Montplaisir JY. Comparison between an automatic and a visual scoring method of the chin muscle tone during rapid eye movement sleep. Sleep Med. 2014; 15(6): 661–665. 13. Frauscher B, Iranzo A, Gaig C, et al.; SINBAR (Sleep Innsbruck
Barcelona) Group. Normative EMG values during REM sleep for the diagnosis of REM sleep behavior disorder. Sleep. 2012; 35(6): 835–847. 14. Frauscher B, Iranzo A, Högl B, et al.; SINBAR (Sleep Innsbruck
Barcelona group). Quantification of electromyographic activity during REM sleep in multiple muscles in REM sleep behavior disorder. Sleep. 2008; 31(5): 724–731.
15. Iranzo A, Frauscher B, Santos H, et al.; SINBAR (Sleep Innsbruck Barcelona) Group. Usefulness of the SINBAR electromyographic mon-tage to detect the motor and vocal manifestations occurring in REM sleep behavior disorder. Sleep Med. 2011; 12(3): 284–288.
16. Frauscher B, Ehrmann L, Högl B. Defining muscle activities for assess-ment of rapid eye moveassess-ment sleep behavior disorder: from a qualitative to a quantitative diagnostic level. Sleep Med. 2013; 14(8): 729–733. 17. International Classification of Sleep Disorders. 3rd ed. Darien, IL: 2014. 18. Ferri R, Rundo F, Manconi M, et al. Improved computation of the atonia index in normal controls and patients with REM sleep behavior disorder. Sleep Med. 2010; 11(9): 947–949.
19. Ferri R, Manconi M, Plazzi G, et al. A quantitative statistical analysis of the submentalis muscle EMG amplitude during sleep in normal con-trols and patients with REM sleep behavior disorder. J Sleep Res. 2008; 17(1): 89–100.
20. Hughes AJ, Daniel SE, Kilford L, Lees AJ. Accuracy of clinical diagno-sis of idiopathic Parkinson’s disease: a clinico-pathological study of 100 cases. J Neurol Neurosurg Psychiatry. 1992; 55(3): 181–184.
21. Tomlinson CL, Stowe R, Patel S, Rick C, Gray R, Clarke CE.
Systematic review of levodopa dose equivalency reporting in Parkinson’s disease. Mov Disord. 2010; 25(15): 2649–2653.
22. Berry RB, Brooks R, Gamaldo CE, Hardling SM, Marcus CL, Vaughn BV. The AASM manual for the scoring of sleep and associated events. Rules Terminol Tech Specif Darien Ill Am Acad Sleep Med. 2012.
23. Ferri R, Franceschini C, Zucconi M, et al. Searching for a marker of REM sleep behavior disorder: submentalis muscle EMG amplitude analysis during sleep in patients with narcolepsy/cataplexy. Sleep. 2008; 31(10): 1409–1417.
24. Mallett S, Halligan S, Thompson M, Collins GS, Altman DG. Interpreting diagnostic accuracy studies for patient care. BMJ. 2012; 345: e3999.
25. Landis JR, Koch GG. The measurement of observer agreement for cate-gorical data. Biometrics. 1977; 33(1): 159–174.
26. Bliwise DL, He L, Ansari FP, Rye DB. Quantification of electromyo-graphic activity during sleep: a phasic electromyoelectromyo-graphic metric. J Clin Neurophysiol. 2006; 23(1): 59–67.
27. McCarter SJ, St Louis EK, Duwell EJ, et al. Diagnostic thresholds for quantitative REM sleep phasic burst duration, phasic and tonic muscle activity, and REM atonia index in REM sleep behavior disorder with and without comorbid obstructive sleep apnea. Sleep. 2014; 37(10): 1649–1662.
28. Mayer G, Kesper K, Ploch T, et al. Quantification of tonic and phasic muscle activity in REM sleep behavior disorder. J Clin Neurophysiol. 2008; 25(1): 48–55.
29. Bliwise DL, Rye DB. Elevated PEM (phasic electromyographic metric) rates identify rapid eye movement behavior disorder patients on nights without behavioral abnormalities. Sleep. 2008; 31(6): 853–857. 30. Consens FB, Chervin RD, Koeppe RA, et al. Validation of a
polysom-nographic score for REM sleep behavior disorder. Sleep. 2005; 28(8): 993–997.
31. Fulda S, Plazzi G, Ferri R. Scoring atonia during normal and pathologi-cal rapid eye movement sleep: visual and automatic quantification meth-ods: Quantification of REM sleep atonia. Sleep Biol Rhythms 2013; 11: 40–51.
32. Burns JW, Consens FB, Little RJ, Angell KJ, Gilman S, Chervin RD. EMG variance during polysomnography as an assessment for REM sleep behavior disorder. Sleep. 2007; 30(12): 1771–1778.
33. Nomura T, Inoue Y, Miyake M, Yasui K, Nakashima K. Prevalence and clinical characteristics of restless legs syndrome in Japanese patients with Parkinson’s disease. Mov Disord. 2006; 21(3): 380–384. 34. Schenck CH, Mahowald MW. Subclinical REM sleep behavior
dis-order and its clinical and research implications. Sleep. 2008; 31(12): 1627.
35. Ferri R, Cosentino FI, Pizza F, Aricò D, Plazzi G. The timing between REM sleep behavior disorder and Parkinson’s disease. Sleep Breath. 2014; 18(2): 319–323.
36. Anang JB, Gagnon JF, Bertrand JA, et al. Predictors of dementia in Parkinson disease: a prospective cohort study. Neurology. 2014; 83(14): 1253–1260.
37. McCarter SJ, St Louis EK, Sandness DJ, et al. Antidepressants increase REM sleep muscle tone in patients with and without REM sleep behav-ior disorder. Sleep. 2015; 38(6): 907–917.
38. McCarter SJ, St Louis EK, Boeve BF, Sandness DJ, Silber MH. Greatest rapid eye movement sleep atonia loss in men and older age. Ann Clin Transl Neurol. 2014; 1(9): 733–738.
39. Dauvilliers Y, Rompré S, Gagnon JF, Vendette M, Petit D, Montplaisir J. REM sleep characteristics in narcolepsy and REM sleep behavior disor-der. Sleep. 2007; 30(7): 844–849.
40. Iranzo A, Santamaría J, Rye DB, et al. Characteristics of idiopathic REM sleep behavior disorder and that associated with MSA and PD. Neurology. 2005; 65(2): 247–252.
41. Frauscher B, Gschliesser V, Brandauer E, et al. Video analysis of motor events in REM sleep behavior disorder. Mov Disord. 2007; 22(10): 1464–1470.
42. Sixel-Döring F, Schweitzer M, Mollenhauer B, Trenkwalder C. Intraindividual variability of REM sleep behavior disorder in Parkinson’s disease: a comparative assessment using a new REM sleep behavior disorder severity scale (RBDSS) for clinical routine. J Clin Sleep Med. 2011; 7(1): 75–80.
43. Arnulf I. REM sleep behavior disorder: motor manifestations and patho-physiology. Mov Disord. 2012; 27(6): 677–689.
44. Iranzo A, Molinuevo JL, Santamaría J, et al. Rapid-eye-movement sleep behaviour disorder as an early marker for a neurodegenerative disorder: a descriptive study. Lancet Neurol. 2006; 5(7): 572–577.
45. Fisher, RA. On the Interpretation of χ2 from Contingency Tables, and the Calculation of P. J Royal Stat Soc. 1922; 85: 87–94.
FUNDING
The study had no financial support. ACKNOWLEDGMENTS
This work was performed at the CHU Clermont-Ferrand, Clermont-Ferrand, France, the Sleep Center, Neurophysiology Unit, University of Cagliari, Monserrato (CA), Italy, the Department of Neurology, Oasi Institute for Research on Mental Retardation and Brain Aging (IRCCS), Troina, Italy, and the Department of Neuroscience, University of Turin, Turin.
SUBMISSION & CORRESPONDENCE INFORMATION Submitted for publication January, 2016
Submitted in final revised form November, 2016 Accepted for publication November, 2016
Address correspondence to: Maria Livia Fantini, MD, PhD, EEG and Sleep Unit, Neurology Service, CHU Clermont Ferrand, 58 rue Montalembert, 63000 Clermont-Ferrand, France. Telephone: 33-4-73-75-16-66; Fax: 33-4-73-75-16-68;
E-mail: mfantini@chu-clermontferrand.fr
DISCLOSURE STATEMENT
MF, PB, MP, AC, FD, AM, and MLF have indicated no financial conflicts of interest. LL and MZ received honoraria from Medtronics, Abbvie and Lundbeck, not related to the present article. RF consulted for EB Neuro, with potential relationship with the present paper.