HAL Id: ird-00455426
https://hal.ird.fr/ird-00455426
Submitted on 10 Feb 2010
HAL is a multi-disciplinary open access archive for the deposit and dissemination of sci-entific research documents, whether they are pub-lished or not. The documents may come from teaching and research institutions in France or abroad, or from public or private research centers.
L’archive ouverte pluridisciplinaire HAL, est destinée au dépôt et à la diffusion de documents scientifiques de niveau recherche, publiés ou non, émanant des établissements d’enseignement et de recherche français ou étrangers, des laboratoires publics ou privés.
exploitation in two West African reservoirs
Justin Kantoussan, Jean-Marc Ecoutin, G. Fontenelle, O. T. Thiaw, Luis Tito
de Morais, Raymond Laë
To cite this version:
Justin Kantoussan, Jean-Marc Ecoutin, G. Fontenelle, O. T. Thiaw, Luis Tito de Morais, et al.. The relevance of size parameters as indicators of fishery exploitation in two West African reservoirs. Aquatic Ecology, Springer Verlag, 2009, 43 (4), pp.1167-1178. �10.1007/s10452-009-9236-9�. �ird-00455426�
1 2 3 4 5 6 7 8 9 10 11 12 13 14 15 16 17 18 19 20 21 22 23 24 25 26 27 28 29 30 31 32 33 34 35 36 37 38 39 40 41 42 43 44 45 46 47 48 49 50 51 52 53 54 55 56 57 58 59 60 1
The relevance of size parameters as indicators of fishery exploitation in two West African reservoirs
Justin Kantoussan1,3; Jean Marc Ecoutin5; Guy Fontenelle2; Omar Thiom Thiaw3; Luis Tito de Morais1; Raymond Laë4
1IRD, BP 1386 Dakar, Sénégal
2Agrocampus Ouest, Pôle halieutique, 65 rue StBrieuc CS 84215, France 3 IUPA Université Cheikh A. Diop, BP 5005 Dakar, Sénégal
4IRD de Bretagne, BP 70, 29280 Plouzané, France
5Centre de Recherches Halieutiques, Avenue J. Monnet, BP 171, 34203, Sète, France
Running title: Size-based indicators of fishing pressure
Key words: Fish length/ Size-based indicators/ Fish community/ Small-scale fisheries/ African reservoirs.
Corresponding author : Raymond.Lae@ird.fr/ IRD de Bretagne, BP 70, 29 280 Plouzané, France, Tel: + 33 (0)2 98 22 45 11 / Fax: + 33 (0)2 98 22 44 34
3 4 5 6 7 8 9 10 11 12 13 14 15 16 17 18 19 20 21 22 23 24 25 26 27 28 29 30 31 32 33 34 35 36 37 38 39 40 41 42 43 44 45 46 47 48 49 50 51 52 53 54 55 56 57 58 59 60 61 ABSTRACT
Fish communities living within the artificial reservoirs of Manantali and Selingue in Mali are compared after monitoring of small-scale fishery landings over 13 months (May 2002 - June 2003). The fishing pressure constitutes the main difference of these two similar reservoirs. The effects of fishing on the structure of the fish communities are analyzed by using fish size spectra and derived indicators. In Selingue Reservoir, the fishing gears mostly target smaller species (mean length of 165 mm) than in Manantali Reservoir (mean length of 210 mm). Unlike in Selingue, the size structure does not change between seasons in Manantali. In Selingue, fishing practices that target the fish recruitment of the year constitute a structuring factor of the fish sizes observed in the catches. In spite of similar values of the slopes of the global fish communities’ size spectra between the two reservoirs, they clearly display an intense exploitation at Selingue. Then, size-based spectra indicators represent a potential tool for assessing the impact of fishing on fish communities in small-scale fisheries.
3 4 5 6 7 8 9 10 11 12 13 14 15 16 17 18 19 20 21 22 23 24 25 26 27 28 29 30 31 32 33 34 35 36 37 38 39 40 41 42 43 44 45 46 47 48 49 50 51 52 53 54 55 56 57 58 59 60 INTRODUCTION
The effects of fishing on fish assemblages can lead to selectively remove large individuals or species, usually of higher trophic levels, and reduce the abundance of the most vulnerable species. Hence, fish biomass, species composition, and size structure may change (Bianchi et al. 2000). As a result, the fish assemblage often becomes dominated by fast-growing, small species at lower trophic levels that have low biomasses and short lifespans (Pauly et al. 1998; Pinnegar et al. 2002). When intensive exploitation impact ecosystems, the most resilient fish species usually survive, and dominate the fish community and most of the biomass (Albaret and Laë 2003). Thus, removing larger species with the highest commercial value appears to be a major factor affecting the organization and structure of fish communities. As a result of such fishing effects, the majority of fish stocks throughout the world become highly-exploited or overexploited (Hall 1999).
Hence, various types of indicators (Rochet and Trenkel 2003; Trenkel and Rochet 2003) or combined indicators (Bellail et al., 2003), have been developed to improve the evaluation of the impacts of ecosystem perturbations at different levels of biological organization (Adams 2002). The value of indicators as tools for such evaluations is based on their simplicity and easy estimation (Gascuel et al. 2005). Most previous studies dealing with the relevance of biological indicators come from experimental or scientific fishing surveys. As few studies have used data from commercial fisheries, we decided to test the relevance of biological indicators calculated from small-scale fishery catches, which are more common in developing countries (multi-species and multi-gears) where fewer reliable data are available and scientific fishing surveys seldom carried out. When the fishing effort is intensive, some researchers view such data as suitable for this type of investigation (Albaret and Laë 2003,
3 4 5 6 7 8 9 10 11 12 13 14 15 16 17 18 19 20 21 22 23 24 25 26 27 28 29 30 31 32 33 34 35 36 37 38 39 40 41 42 43 44 45 46 47 48 49 50 51 52 53 54 55 56 57 58 59 60 61
Easy to determine in the field, fish length constitutes a relevant ecological parameter because it can be related to features such as weight and fecundity (Fagade and Olaniyan 1972; Scheffers 1973). In addition, species interactions such as the prey-predator relationship also depend on length (Shin et al. 2005). Size is a critical parameter in fish removal by fishing. Usually, fishing strategies in ecosystems start by removing top predators, which modifies the assemblage structure as described in the previous paragraph. As a consequence, using size spectra as exploitation indicators to assess the effects of fishing on ecosystems has become relatively common in the literature (Pope et al. 1988; Rice and Gislason 1996; Gislason and Rice 1998). The theoretical basis of this biological indicator is that fishing alters the size structure of fish assemblages through direct effects such as selection of more profitable bigger fish as well as indirect effects that lead smaller species to increase. For this reason, size spectra and derived indicators are often considered to be suitable indicators of the impact of fishing on fish communities.
This study aims at comparing a weakly exploited reference site (Manantali Reservoir) with a highly exploited study site (Selingue Reservoir) (Laë et al. 2004a). In both reservoirs, fish species composition, fishing practices and other important factors are similar. They only differ by the fishing effort. The comparison method is based on revisiting size-based spectra indicators and testing their relevance from landed catches as a tool for measuring fishing impact in small-scale fisheries. Considering the different fishing activities on both reservoirs, we assume that Selingue Reservoir should show smaller fish sizes, a steeper slope and a higher intercept of the linear regression of the logarithm of the number of measured fish by size class than Manantali Reservoir.
METHODS
3 4 5 6 7 8 9 10 11 12 13 14 15 16 17 18 19 20 21 22 23 24 25 26 27 28 29 30 31 32 33 34 35 36 37 38 39 40 41 42 43 44 45 46 47 48 49 50 51 52 53 54 55 56 57 58 59 60
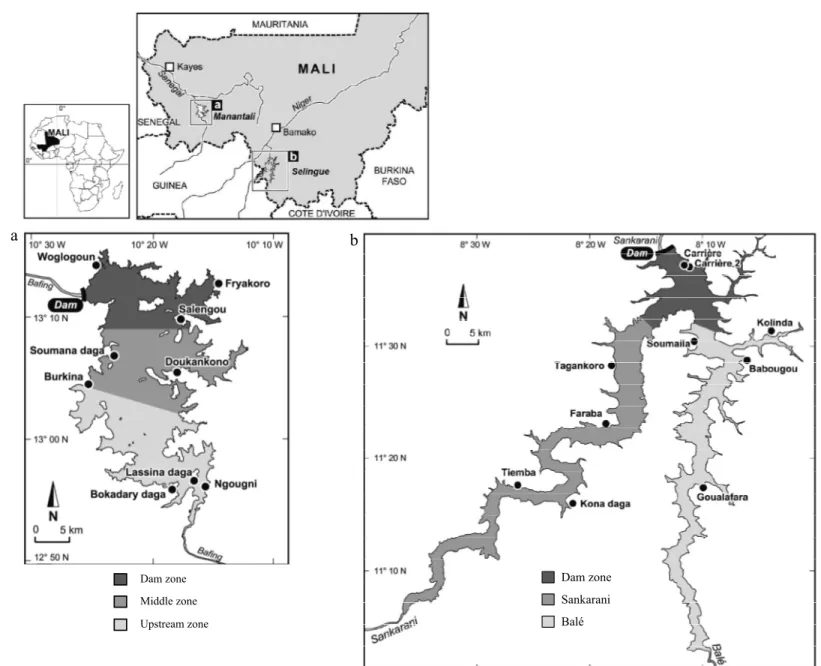
Close to Bamako (Mali capital), Selingue Reservoir was created in 1980 after the construction of a hydroelectric dam on the Sankarani River, the main tributary of the Niger River. Similarly, another hydroelectric dam on the Bafing, a tributary of the Senegal River, led to the formation of the remote Manantali Reservoir that was firstly flooded in 1987 (Fig. 1). These two rivers rise on the same place, in the Fouta Djalon Mountains in Guinea Republic. According to Laë et al. (2004a), the reservoirs are very similar: 80 kms length, 3-8 kms width and 400 km2 area (Table 1). The water level changes between wet and dry seasons, the annual average air temperature, the rainfall range, the evaporation rate and the water pH also are similar (Alhousseini 1999; Arfi 2003). In Selingue, the average temperature of the surface water (0-12 m deep) fluctuates between 29.5°C for high-water and 28.9°C for low-water periods. In Manantali, the average water temperature is comparable over the same periods to those of Selingue: 29.1°C for high-water and 27.2°C for low-water periods. Both reservoirs exhibit a thermal stratification: between March and May in Selingue and between April and October in Manantali. The thermal differences between the surface and bottom waters in these two reservoirs are significant, and can reach 9°C near the dam in Selingue and 7°C in Manantali (Alhousseini 1999; Arfi 2005). The homogenization of the temperature in the water column takes place in January-February in both reservoirs, coinciding with the arrival of the continental Harmattan wind. During the periods of thermal stratification, the deep-water layers become anoxic (Alhousseini 1999; Arfi 2005). Selingue and Manantali Reservoirs also exhibit the same hydrological regime, with water levels that increase in August to reach a peak in November (Kantoussan et al. 2007). In December, the water levels start decreasing until their lowest levels in June-July, when the electricity demand is at its highest. Three seasons can be distinguished with respect to the hydrological cycle: (i) a high-water season (HWS), from August to November; (ii) a season of falling-water level (FWS), from
3 4 5 6 7 8 9 10 11 12 13 14 15 16 17 18 19 20 21 22 23 24 25 26 27 28 29 30 31 32 33 34 35 36 37 38 39 40 41 42 43 44 45 46 47 48 49 50 51 52 53 54 55 56 57 58 59 60 61
December to March; and (iii) a low-water season (LWS) from April to July. Concerning their fish compositions, both reservoirs also look similar (Table 2).
Nevertheless, some differences do exist. Two tributaries feed Selingue Reservoir, while only one goes to Manantali Reservoir. Manantali is deeper than Selingue (21 m vs 5 m). According to some authors (Prepas 1983; Marshall 1984), the depth difference could explain higher fish production in Selingue. However, the morphoedaphic index, which corresponds to the ratio of conductivity to mean lake depth (Ryder 1965), did not predict different fish landings in both reservoirs (Kantoussan et al. 2007). Then, during one part of the year, the trophic status of the two reservoirs differs: oligo-mesotrophic for Selingue and oligotrophic for Manantali (Alhousseini 1999; Arfi 2005). Accordingly, we concluded that Manantali and Selingue Reservoirs, in spite of some differences, display similar characteristics and could support a comparative study.
2) Sampling and extrapolation Sampling design
Fishing activities in the two reservoirs were monitored for 13 months (May 2002 to June 2003). A structured, non-random sampling design was used, taking into account their morphological and hydrological features together with the spatial-temporal changes in fishing pressure. The latter justified the categorization of each reservoir into three uniform zones. An average of three villages was selected within each zone to conduct surveys of fishing activities. The surveyed villages were selected according to: (i) the geographical stratification of the reservoirs; (ii) the fishing techniques used; and (iii) the need to survey a large number of fishing units (FU: given that one FU corresponds to one canoe), while also considering seasonal variations.
Surveys were conducted for 10 days per month in each village. Each survey consisted of three operations, as follows: i) monthly counts of active FUs to assess the fishing potential of each
3 4 5 6 7 8 9 10 11 12 13 14 15 16 17 18 19 20 21 22 23 24 25 26 27 28 29 30 31 32 33 34 35 36 37 38 39 40 41 42 43 44 45 46 47 48 49 50 51 52 53 54 55 56 57 58 59 60
surveyed village; ii) surveys of landed catch in order to determine the species composition and size structure of fish; iii) surveys of fishing activity performed every evening (10 days month–1) at fishers’ homes, among a random sample of 20 FUs, to estimate the fishing effort. In both reservoirs, the fishers use several types of fishing gear simultaneously or sequentially. All fishing gears were pooled into categories depending on the technique and the mesh size. For gillnets, three categories of mesh sizes were distinguished: small-mesh gillnets (< 30 mm); medium-mesh (30 to 50 mm); large mesh (> 50 mm).
3) Size and trophic spectra
To study the impact of fishing on the fish assemblages, size structures are analysed in both reservoirs. Size-classes are defined, with each class represented by its mid-value. Logarithmic transformations are used to normalize fish length distributions. As each fishing technique has its characteristic species and size selectivity, the oversampling of one type of gear can lead to biased data. Hence, before processing, this potential bias must be reduced to give each type of gear its correct weight in the catches on the basis of the various spatial and temporal strata. As size spectrum can be biased by the selectivity of the gear used during the sampling period, an adjustment is applied to the sampling sizes by each type of gear using the relationship:
)' / ( *f f Ls Lc
Given Lcthe adjusted size, Lsis the sampling size, f is the total extrapolated fishing effort, and
f’ is the sampling effort. The ratio between f and f’ is the raising factor of either 1 or 6
depending on the fishing pressure exerted in each reservoir. In the intensively-exploited Reservoir Selingue, a higher raising factor is observed.
The total extrapolated fishing effort was obtained by the formula (Laë et al 2004b):
1 1 2 1 3 1 )] * / ( * * [( G G G d u t D U f3 4 5 6 7 8 9 10 11 12 13 14 15 16 17 18 19 20 21 22 23 24 25 26 27 28 29 30 31 32 33 34 35 36 37 38 39 40 41 42 43 44 45 46 47 48 49 50 51 52 53 54 55 56 57 58 59 60 61
Where f = total fishing effort; U = number of fishing units in the zone; D = number of days in the month; t = number of fishing trips during the survey period; u = number of fishing units sampled; d = number of days sampled; G1= number of zones; G2= number of categories of gear; and G3= number of months.
The species trophic levels (pooled by class of 0.5) are borrowed from the metabase “Fishbase (Froese and Pauly 2007) to study the trophic structures of catches.
4) Statistical tests
Four statistical tests are used to determine whether any differences observed between the samples are significant at a probability of 0.05: i) the differences in fishing effort according to the seasons in each reservoir on the one hand, and between reservoirs on the other hand are tested from the data of total fishing effort by gear per month and zone. The mean lengths and mean number of hooks by gear are also tested between both reservoirs. The homogeneity of the variances was initially tested by a Bartlett test. The fishing effort distribution is found not homogeneous because of its variability according to the gear and to the spatial and temporal scales. Logically, the non-parametric Mann-Whitney U-test was preferred. This test was also used for the data of the measured fish sizes in order to test the mean landed sizes; ii) the covariance analysis (ANCOVA) was applied from the logarithmic data of the number of individuals by size class to test the slopes and intercepts of the size spectra on both reservoirs. In theory, the slope should be steeper and the intercept higher for highly exploited ecosystems, which should show in the landed catches a reduction in the abundance of large individuals and a relative increase in the abundance of smaller individuals (Laë et al. 2004a). Hence, any change in the size spectrum slope should be proportional to fishing effort (Rice and Gislason 1996; Gislason and Rice 1998); iii) the Kolmogorov-Smirnov test for two independent samples was used to test differences of fish size distribution between the two reservoirs. Data of measured fish were pooled in numbers by size class; iv) a comparative test
3 4 5 6 7 8 9 10 11 12 13 14 15 16 17 18 19 20 21 22 23 24 25 26 27 28 29 30 31 32 33 34 35 36 37 38 39 40 41 42 43 44 45 46 47 48 49 50 51 52 53 54 55 56 57 58 59 60
of two observed proportions was used from the number of fish longer than 500 mm in the measured fish size to compare these proportions between both reservoirs (Scherrer 1984).
RESULTS
1) Fishing effort
The most frequently encountered types of fishing gear used to exploit the two reservoirs were gillnets (with large-, medium- or small- mesh, depending on the reservoir), traps used as keep nets, and longlines with baited or unbaited multiple hooks. However, fishing efforts between the reservoirs differed at three levels:
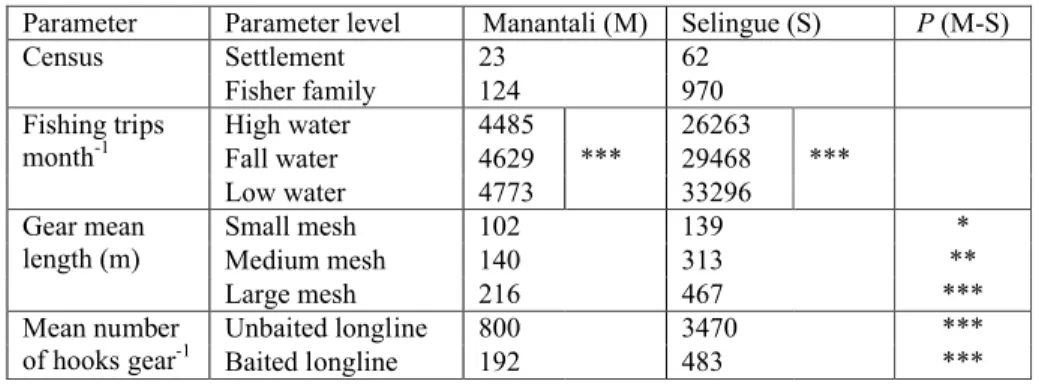
1. The fishing potential expressed as FUs and the fishing effort. This potential directly depended on the number of fishers that was 10 times denser at Selingue than at Manantali (6 km–2 vs 0.6 km–2). The fishing effort, expressed as the number of fishing trips per month, significantly differed between the reservoirs: six times higher in Selingue than in Manantali (p < 0.001; Mann-Whitney test). In Manantali, the fishing effort did not change substantially according to the seasons (Table 3). By contrast, in Selingue, the fishing effort showed significant seasonal variations. The highest fishing effort was observed at low-waters.
2. Different sizes of fishing gear (Table 3). The average fishing effort per fishing trip was much higher for Selingue than for Manantali. Globally, the average length of small-, medium-and large-mesh gillnets in Selingue was twice the observed value in Manantali. Similarly, there were 4 times more hooks used in Selingue for unbaited longlines and 2.5 times for baited ones than in Manantali. The mean lengths and mean number of hooks by gear were significantly different between Selingue and Manantali (p < 0.05; Mann-Whitney test).
3. Targeted fish. In Manantali, the main fishing gears (large-, medium-mesh gillnets, and baited long lines) primarily targeted high market-value fish, usually large species. In Selingue, however, the use of purse seine nets and small beach seines, unbaited longlines,
3 4 5 6 7 8 9 10 11 12 13 14 15 16 17 18 19 20 21 22 23 24 25 26 27 28 29 30 31 32 33 34 35 36 37 38 39 40 41 42 43 44 45 46 47 48 49 50 51 52 53 54 55 56 57 58 59 60 61
small-mesh gillnets, and traps operated from the shore, already reflected a change in fishing efforts that target smaller species, usually of lower market value.
2) Size structures in reservoirs
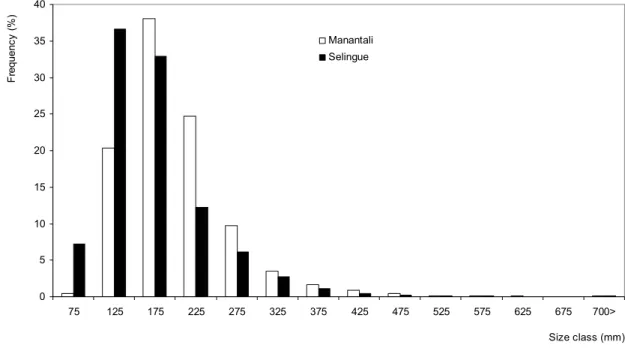
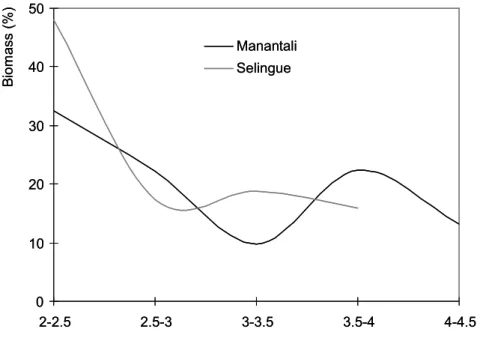
In Manantali and Selingue Reservoirs, large numbers of fishes were individually measured (256,644 and 223,313 respectively) during the sampling period. The analysis of the fish size distributions observed in the overall catches (or global size spectra) caught in both reservoirs showed that the modal classes in Selingue and Manantali Reservoirs were 125 mm and 175 mm, respectively (Fig. 2). In Manantali Reservoir, the fish size ranged from 73 mm to 1365 mm, while in Selingue, the range of landing sizes was much broader (70 mm - 1655 mm). The size distributions also were significantly different (p = 0.02; Kolmogorov-Smirnov test). Nevertheless, the mean size of the total landing catches looked higher in Manantali than in Selingue (210 mm and 165 mm, respectively; p = 0.01, Mann-Whitney test). In both reservoirs, the size spectra displayed unimodal distributions. In Manantali, the high proportion of the large size individuals was accompanied by high trophic levels. Moreover, the individuals of low trophic levels constituted almost 50% of the total catches made in Selingue. In this reservoir, the high trophic levels fishes were little represented or absent (Fig. 3). With respect to the common species caught in both reservoirs, the size spectrum was globally narrower in Manantali than in Selingue (Table 2).
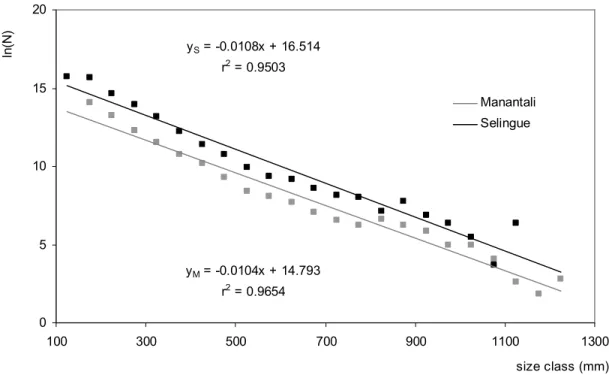
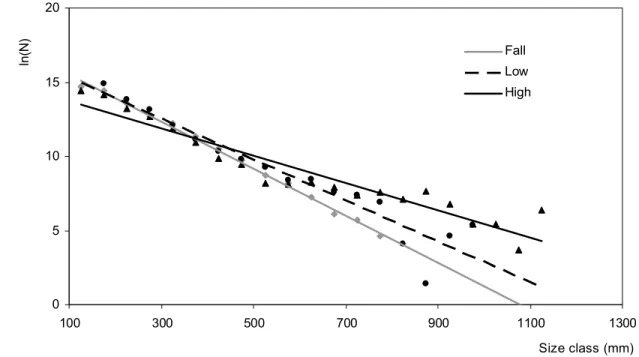
The linear models of both reservoirs (Fig. 4), fitted from the size distributions of the total catches, showed that the slopes did not significantly differ (p = 0.54, Ancova test). In contrast, the intercepts values were lower in Manantali than in Selingue (p 0.001, Ancova test). Finally, the proportion of large individuals (> 500 mm) was 0.5% at Manantali versus 0.3% at Selingue. Although narrow, the difference of large individuals in both reservoirs remained significant (p < 0.05, test-two-%). Hence, the proportions of large individuals in these two
3 4 5 6 7 8 9 10 11 12 13 14 15 16 17 18 19 20 21 22 23 24 25 26 27 28 29 30 31 32 33 34 35 36 37 38 39 40 41 42 43 44 45 46 47 48 49 50 51 52 53 54 55 56 57 58 59 60
reservoirs showed that the broad size spectra observed in Selingue mostly depended on occasional catches of scarce large individuals.
3) Seasonal distribution of sizes
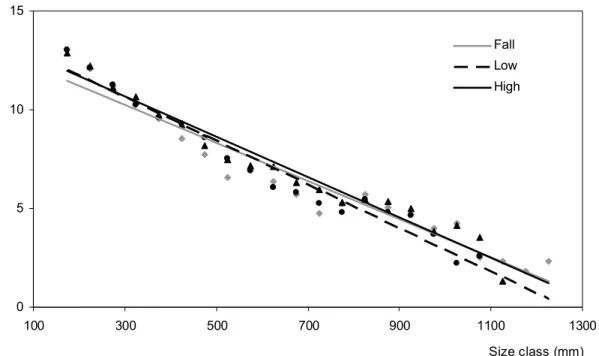
Seasonal size distributions during the falling-, low-, and high-water seasons in Manantali Reservoir showed similar length ranges, with a modal value of 175 mm. During the high – waters, the proportion of bigger fish got higher, but this increase was not significant compared with the other two hydrological seasons. The slopes and intercepts values remained similar (Fig. 5) (slopes: p = 0.19; intercepts: p = 0.13, Ancova test).
In Selingue Reservoir, the size spectrum distributions for the LWS and HWS displayed the same modal size class (125 mm). This modal class was greater during the FWS (175 mm). The slopes of the size spectra also differed according to the seasons. Significant differences existed between the FWS and HWS (p 0.001, Ancova test) and between the LWS and HWS (p 0.001, Ancova test). By contrast, the slopes values for the FSW and LWS were similar (p = 0.17, Ancova test; Fig. 6). During the FWS and LWS, the large fishes became less abundant in the fishers' catches, while they increased considerably during the HWS.
DISCUSSION
Size spectra as an indicator of fishery exploitation
The global size spectra of Manantali and Selingue Reservoirs show similar slopes despite the different exploitation levels, mean sizes and modal size classes. The similar slopes can be explained by: (i) the use of the linear portion of the size distribution, starting after the modal size class, which only considers one part of the fishing effects. Indeed, when a fishery is growing, the fish size classes lower than the modal size class reflect not only the selectivity of the fishing gear, but also an endless change of fishing strategies by a constant fit of the fishing
3 4 5 6 7 8 9 10 11 12 13 14 15 16 17 18 19 20 21 22 23 24 25 26 27 28 29 30 31 32 33 34 35 36 37 38 39 40 41 42 43 44 45 46 47 48 49 50 51 52 53 54 55 56 57 58 59 60 61
strategies (using small mesh size gears and high catch capacities) as observed in Selingue. On the contrary, in Manantali where small-mesh gear is rarely used, most of the fish catches are dominated by large-sized species like L. niloticus, H. forskalii, and M. rume; (ii) Biological indicators such as size spectrum slopes to assess the impact of fishing pressure on fish stocks are often based on experimental fishing processes or scientific surveys using standardized sampling protocols (Rochet et al. 2005; Duplisea and Castonguay 2006). In our study, the data come from sampling of small-scale fishery landings that are characterized by the use of various fishing gears with various selectivities (Charles-Dominique 1993). Hence, the use of the slope as an indicator of exploitation would only be possible if the nets had similar selectivities and were used under the same conditions. Actually, this is not the case for both reservoirs, the gear and mesh sizes used were different. Then, individuals smaller than the modal size class were very different and much more numerous in Selingue than in Manantali. Beyond the particular character of the exploited data, our results on the size spectrum slopes in Selingue agree with Duplisea et al. (1997) and Rochet et al. (2005) who find that the slopes of the size spectra remain relatively unchanged for highly-exploited fish communities.
The extrapolation of individuals by size class using the raising factor explains why the numbers by size class are higher in Selingue than in Manantali. Thus, the higher intercept value, calculated for Selingue is, on the one hand, related to the difference of total fish landings, and on the other hand by an increasing proportion of smaller fish in catch recorded in this reservoir.. The low abundance of the high trophic levels in Selingue involves a weak predation on the primary and secondary consumers. In this reservoir, the abundance of these trophic categories suggests an important trophic control on the plankton organisms. However, in Manantali, the top-down trophic control exerted by the top predators on the primary and secondary consumers is strong. This assumes a more moderate control than in Selingue on the planktonic communities.
3 4 5 6 7 8 9 10 11 12 13 14 15 16 17 18 19 20 21 22 23 24 25 26 27 28 29 30 31 32 33 34 35 36 37 38 39 40 41 42 43 44 45 46 47 48 49 50 51 52 53 54 55 56 57 58 59 60
Temporal variation of the size spectra
The size spectrum does not display any seasonal variation in Manantali Reservoir. This is not the case in Selingue where significant differences are observed in the spectrum between the falling and low-water seasons on the one hand, and the high-water season on the other hand. The steeper slopes for the falling and low-water seasons mean that the fishers target the new recruits. All fish species usually show a great ability to cope with climatic and hydrodynamic conditions. Most species synchronize their breeding cycles with the hydrological cycle. They usually start maturing just before the rainy season, the rise of the water level, and the flooding of plains (Bénech and Dansoko 1994; Paugy 2002). At the end of the high-water season, and after a fast growing period due to more available food and favorable habitats, the young recruits enter the exploitable fish community. During the falling-water season and the early low-water season, the recruits thus constitute an important component of the fish community in Selingue and become targeted by an intense exploitation. Catching fast-growing young fish in the shallow Selingue Reservoir becomes easier during the falling and low-water seasons because after flooding the plains, the water comes back to its original place together with a lower depth . On the contrary, in Manantali, where the fishing effort remains low and large species more abundant, catching new recruits is not a necessity for fishers. Moreover, the volume of water, which is always much bigger in this reservoir, allows the recruits to scatter over a larger volume area, thereby decreasing their vulnerability to fishing gears and maintaining a low exploitation level. In tropical ecosystems, the spawning period that occurs just before the rainy season for many species is responsible for the single annual cohort for these species. This explains the unimodal distributions of the total sizes observed in Selingue and Manantali.
To sum up, the main idea of this paper was to test some indicators of the size spectrum approach for small-scale fisheries data that are available in tropical zone. In these types of
3 4 5 6 7 8 9 10 11 12 13 14 15 16 17 18 19 20 21 22 23 24 25 26 27 28 29 30 31 32 33 34 35 36 37 38 39 40 41 42 43 44 45 46 47 48 49 50 51 52 53 54 55 56 57 58 59 60 61
fisheries, the fishers use simultaneously many gears to target several species and adopt alternatively various exploitation strategies to cope with the resources state. In spite this context, our results look rather relevant and comparable which those obtained by others studies conducted from experimental or scientific data. The global view of the findings show that the mean size of global catches, the modal size class, the global size spectrum and the minimal mean size look useful to assess the effects of fishing pressure in exploited tropical waterbodies. By contrast, the slope and intercept of size spectrum, mean maximum size are irrelevant indicators of fishing impacts. Hence, the size-based indicators should be exploited in a combined way to guarantee an optimal characterization of the fisheries. Therefore, the final objective of this type of approach may contribute to implement monitoring and management tools more adapted to ecosystems and fisheries within a tropical zone context.
Acknowledgments
We thank the anonymous reviewers for their relevant comments, which allowed us to improve an earlier version of this document. This research was financially supported by the Research Institute for Development (IRD) and by the French Ministry of Foreign Affairs through a Preference Solidarity Funding (FSP) on large reservoirs in Mali.
Reference List
Adams SM (2002) Biological indicators of aquatic ecosystem stress: introduction and overview. In. Adams SM, (eds.) Biological indicators of aquatic ecosystem stress, pp. 1-11. Bethesda American Fisheries Society. Albaret JJ, Laë R (2003) Impact of fishing on fish assemblages in tropical lagoons: the example of the Ebrie
lagoon, West Africa. Aquatic Living Resources 16, 1-9.
Alhousseini S (1999) Peuplement ichtyologique et exploitation des espèces d’intérêt halieutique de la retenue d’eau de Manantali (Mali). Thèse Université de Provence, France, 223p.
Arfi R (2003) Effects of climate and hydrology on the trophic status of Sélingué reservoir (Mali, West Africa).
Lakes & Reservoirs: Research and Management 8, 247-257.
Arfi R (2005) Seasonal ecological changes and water level variations in the Sélingué Reservoir (Mali, West Africa). Physics and Chemistry of the Earth 30, 432-441.
Bellail R, Bertrand J, Le Pape O, Mahé JC, Morin J, Poulard JC, Rochet MJ, Schlaich I, Souplet A, Trenkel V (2003) A multispecies dynamic indicator-based approach to the assessment of the impact of fishing on fish communities. ICES CM 2003/V, 02. 11p.
Bénech V, Dansoko DF (1994) Reproduction des espèces d’intérêt halieutique. In. Quensière J (ed.) La pêche
dans le Delta Central du Niger: approche pluridisciplinaire d’un système de production halieutique,
213-227 pp, ORSTOM / KARTHALA, Paris, France.
Bianchi G, Gislason H, Graham K, Hill L, Jin X, Koranteng K, Manickchand-Heileman S, Payà I, Sainsbury K, Sanchez F, Zwanenburg K (2000) Impact of fishing on size composition and diversity of demersal fish communities. ICES Journal of Marine Science 57, 558-571.
3 4 5 6 7 8 9 10 11 12 13 14 15 16 17 18 19 20 21 22 23 24 25 26 27 28 29 30 31 32 33 34 35 36 37 38 39 40 41 42 43 44 45 46 47 48 49 50 51 52 53 54 55 56 57 58 59 60
Charles-Dominique E (1993) L’exploitation de la lagune Aby (Côte-d’Ivoire) par la pêche artisanale.
Dynamique des ressources, de l’exploitation et des pêcheries. Thèse Université Montpellier II, France, 410p.
Duplisea DE, Kerr SR, Dickie LM (1997) Demersal fish biomass size spectra on the Scotian Shelf, Canada: species replacement at the shelfwide scale. Canadian Journal of Fisheries and Aquatic Sciences 54, 1725-1735.
Duplisea, DE, Castonguay M (2006) Comparison and utility of different size-based metrics of fish communities for detecting fishery impacts. Canadian Journal of Fisheries and Aquatic Sciences 63, 810-820. Fagade SO, Olaniyan C IO (1972) The biology of the west African shad Ethmalosa fimbriata (Bowdich) in the
Lagos lagoon, Nigeria. Journal of Fish Biology 4, 519-533.
Froese R. & Pauly D. (2007) Fishbase, concept, design and data sources. International Center of Living Aquatic Resources Management (ICLARM) Manila, Philippines.
Gascuel D, Bozec YM, Chassot E, Colomb A, Laurans M (2005) The trophic spectrum : theory and application as an ecosystem indicator. ICES Journal of Marine Science 62, 443-452.
Gislason H, Rice J (1998) Modeling the response of size and diversity spectra of fish assemblages to changes in exploitation. ICES Journal of Marine Science 55, 362-370.
Hall SJ (1999) The effects of fishing on marine ecosystems and communities. Ser. Fish Biology and Aquatic Resources. Oxford Blackwell Science. 274p.
Kantoussan J, Ecoutin JM, Fontenelle G, Laë R (2007) Catch-per-Unit-Effort and Yields as fishery indicators of exploitation in two West African reservoirs (Manantali and Selingue Mali). Fisheries Management and
Ecology, in press.
Laë R, Ecoutin JM, Kantoussan J (2004a) The use of biological indicators for monitoring fisheries exploitation: application to man-made reservoirs in Mali. Aquatic Living Resources 17, 95-105.
Laë R, Ecoutin JM, Mendy A, Raffray J, Weigel JY, Sadio O, Djobe O (2004b) Effects of a targeted shrimp (Penaeus notialis) exploitation on fish catches in the Gambia estuary. Aquatic Living Resources 17, 75-85.
Marshall BE (1984) Predicting ecology and fish yields in African reservoirs from preimpoundment physico-chemical data. CIFA Tech. Pap./Doc. Tech.CPCA 12 ; 36p. FAO Rome.
Paugy D (2002) Reproductive strategies of fishes in a tropical temporary stream of the Upper Senegal basin : Baoulé River in Mali. Aquatic Living Resources 15, 25-35.
Pauly D, Christensen V, Dalsgaard J, Froese R, Torres FJr (1998) Fishing down marine food webs. Science 279(5352), 860-863.
Pinnegar JK, Jinnings S, O’brien CM, Polunin NVC (2002) Long-term changes in the trophic level of the Celtic Sea fish community and fish market price distribution. Journal of Applied Ecology 39, 377-390. Pope JG, Stokes TK, Murawski SA, Idoine SI (1988) A comparison of fish size composition in the North Sea
and on Georges Bank. In: Wolff W, Soeder CJ, Drepper FR (Eds.) Ecodynamics: contributions to
theoretical ecology, 146-152 pp. Springer Verlag, Berlin.
Prepas, E.E. (1983) Total dissolved solids as a predictor of lake biomass and productivity. Canadian Journal of
Fisheries and Aquatic Sciences 40, 92-95.
Rice J, Gislason H (1996) Patterns of change in the size spectra of numbers and diversity of the North Sea fish assemblage, as reflected in surveys and models. ICES Journal of Marine Science 53, 1214-1225. Rochet MJ, Trenkel VM (2003) Which community indicators can measure the impact of fishing? A review and
proposals. Canadian Journal of Fisheries and Aquatic Sciences 60, 86-99.
Rochet MJ, Trenkel VM, Bellail R, Coppin F, Le Pape O, Mahé JC, Morin JP, Schlaich, I, Souplet AVY, Bertrand J (2005) Combining indicator trends to assess ongoing changes in exploited fish communities : diagnostic of communities off the coasts of France. ICES Journal of Marine Science 62, 1647-1664. Ryder RA (1965) A method for estimating the potential fish production of north-temperate Lakes. Transactions
of the American Fisheries Society 94, 214-218.
Scheffers WJ (1973) Etude de Ethmalosa fimbriata (Bowdich) dans la région sénégambienne: 2enote: la pêche et le stock des ethmaloses dans le fleuve Sénégal et la région de Saint-Louis. Centre de Recherche
Océanographique de Dakar-Thiaroye/FAO/ORTOM,DSP n° 45, 38p.
Scherrer B (1984) Biostatistique. Montréal, Paris: Gaëtan-Morin, 850p.
Shin YJ, Rochet MJ, Jennings S, Field JG, Gislason H (2005) Using size-based indicators to evaluate the ecosystem effects of fishing. ICES Journal of Marine Science 62, 384-396.
Trenkel VM, Rochet MJ (2003) Performance of indicators derived from abundance estimates for detecting the impact of fishing on a fish community. Canadian Journal of Fisheries and Aquatic Sciences 60, 67-85.
3 4 5 6 7 8 9 10 11 12 13 14 15 16 17 18 19 20 21 22 23 24 25 26 27 28 29 30 31 32 33 34 35 36 37 38 39 40 41 42 43 44 45 46 47 48 49 50 51 52 53 54 55 56 57 58 59 60 61 FIGURES
Figure 1: Geographic location of Manantali and Selingue Reservoirs , Mali (a = Manantali; b = Selingue; Kantoussan et al. 2007, in press).
Figure 2: Global size spectra observed in fish catches of Manantali and Selingue Reservoirs fisheries.
Figure 3: Distributions of fish catches by trophic level class in the Manantali and Selingue Reservoirs fisheries. Figure 4: Linear regression of size distributions observed in fish catches at Manantali (M) and Selingue (S) Reservoirs fisheries, N = Number of individuals by size class.
Figure 5: Patterns of seasonal variation of the slopes of the size spectra observed in fish catches at Manantali Reservoir fishery, N = Number of individuals by size class (High-water (black triangle): yH= -0.0103x+13.764, r=0.96; Falling-water (grey point): yF= -0.0097x+13.148, r=0.94; Low-water (black round point): yL= -0.0111x+13.975, r=0.96).
Figure 6: Patterns of seasonal variation of the slopes of the size spectra observed in fish catches at Selengue reservoir fishery, N = Number of individuals by size class (High-water (black triangle): yH= -0.0091x+14.6, r=0.91; Falling-water (grey point): yF = -0.0158x+17.114, r=0.99; Low-water (black round point): yL = -0.0138x+16.705, r=0.91).
Figure 1. Dam zone Middle zone Upstream zone a b Dam zone Sankarani Balé
Figure 2 : 0 5 10 15 20 25 30 35 40 75 125 175 225 275 325 375 425 475 525 575 625 675 700> Size class (mm) Manantali Selingue F re qu en cy ( % )
Figure 3: 0 10 20 30 40 50 2-2.5 2.5-3 3-3.5 3.5-4 4-4.5 Trophic levels B io m as s (% ) Manantali Selingue 0 10 20 30 40 50 2-2.5 2.5-3 3-3.5 3.5-4 4-4.5 Trophic levels B io m as s (% ) Manantali Selingue
Figure 4 : yM = -0.0104x + 14.793 r2 = 0.9654 yS = -0.0108x + 16.514 r2 = 0.9503 0 5 10 15 20 100 300 500 700 900 1100 1300 size class (mm) Manantali Selingue ln (N )
Figure 5 : 0 5 10 15 100 300 500 700 900 1100 1300 Size class (mm) Fall Low High ln (N )
Figure 6 : 0 5 10 15 20 100 300 500 700 900 1100 1300 Size class (mm) Fall Low High ln (N )
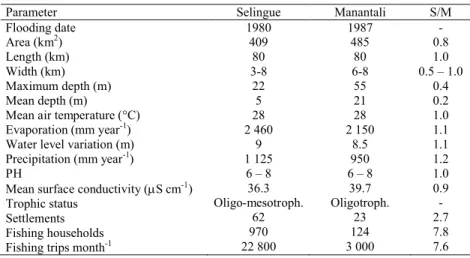
Table 1: Physicochimical characteristics of the Reservoirs Selingue (S) and Manantali (M) (adapted from Kantoussan et al. 2007, in press).
Parameter Selingue Manantali S/M
Flooding date Area (km2) Length (km) Width (km) Maximum depth (m) Mean depth (m)
Mean air temperature (°C)
Evaporation (mm year-1)
Water level variation (m)
Precipitation (mm year-1)
PH
Mean surface conductivity (S cm-1)
Trophic status Settlements Fishing households
Fishing trips month-1
1980 409 80 3-8 22 5 28 2 460 9 1 125 6 – 8 36.3 Oligo-mesotroph. 62 970 22 800 1987 485 80 6-8 55 21 28 2 150 8.5 950 6 – 8 39.7 Oligotroph. 23 124 3 000 -0.8 1.0 0.5 – 1.0 0.4 0.2 1.0 1.1 1.1 1.2 1.0 0.9 -2.7 7.8 7.6
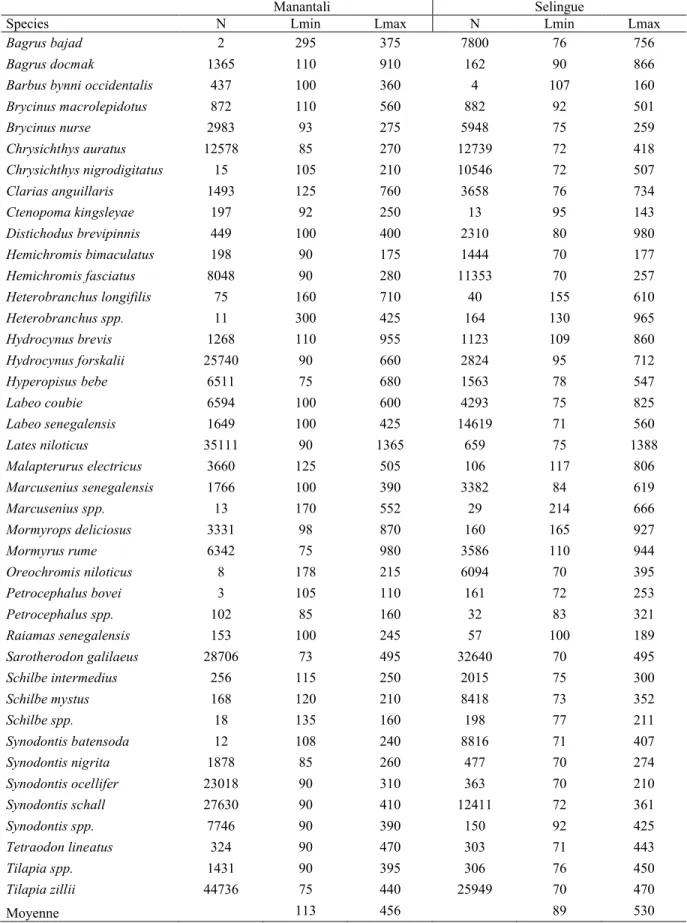
Table 2 : Maximum (Lmax) and minimum (Lmin) lengths (mm) of common species in catch landed in Reservoirs Manantali and Selingue fisheries : N = sampled numbers.
Manantali Selingue
Species N Lmin Lmax N Lmin Lmax
Bagrus bajad 2 295 375 7800 76 756
Bagrus docmak 1365 110 910 162 90 866
Barbus bynni occidentalis 437 100 360 4 107 160
Brycinus macrolepidotus 872 110 560 882 92 501 Brycinus nurse 2983 93 275 5948 75 259 Chrysichthys auratus 12578 85 270 12739 72 418 Chrysichthys nigrodigitatus 15 105 210 10546 72 507 Clarias anguillaris 1493 125 760 3658 76 734 Ctenopoma kingsleyae 197 92 250 13 95 143 Distichodus brevipinnis 449 100 400 2310 80 980 Hemichromis bimaculatus 198 90 175 1444 70 177 Hemichromis fasciatus 8048 90 280 11353 70 257 Heterobranchus longifilis 75 160 710 40 155 610 Heterobranchus spp. 11 300 425 164 130 965 Hydrocynus brevis 1268 110 955 1123 109 860 Hydrocynus forskalii 25740 90 660 2824 95 712 Hyperopisus bebe 6511 75 680 1563 78 547 Labeo coubie 6594 100 600 4293 75 825 Labeo senegalensis 1649 100 425 14619 71 560 Lates niloticus 35111 90 1365 659 75 1388 Malapterurus electricus 3660 125 505 106 117 806 Marcusenius senegalensis 1766 100 390 3382 84 619 Marcusenius spp. 13 170 552 29 214 666 Mormyrops deliciosus 3331 98 870 160 165 927 Mormyrus rume 6342 75 980 3586 110 944 Oreochromis niloticus 8 178 215 6094 70 395 Petrocephalus bovei 3 105 110 161 72 253 Petrocephalus spp. 102 85 160 32 83 321 Raiamas senegalensis 153 100 245 57 100 189 Sarotherodon galilaeus 28706 73 495 32640 70 495 Schilbe intermedius 256 115 250 2015 75 300 Schilbe mystus 168 120 210 8418 73 352 Schilbe spp. 18 135 160 198 77 211 Synodontis batensoda 12 108 240 8816 71 407 Synodontis nigrita 1878 85 260 477 70 274 Synodontis ocellifer 23018 90 310 363 70 210 Synodontis schall 27630 90 410 12411 72 361 Synodontis spp. 7746 90 390 150 92 425 Tetraodon lineatus 324 90 470 303 71 443 Tilapia spp. 1431 90 395 306 76 450 Tilapia zillii 44736 75 440 25949 70 470 Moyenne 113 456 89 530
Table 3: Comparative parameters of fishing effort in Reservoirs Manantali and Selingue (Mann-Whitney test for different water levels within each reservoir; ns = no significant; * = significant at 0.05; ** = significant at 0.01; *** = significant at 0.001 probability level (P)).
Parameter Parameter level Manantali (M) Selingue (S) P (M-S)
Census Settlement 23 62
Fisher family 124 970
Fishing trips
month-1 High water 4485 26263
Fall water 4629 *** 29468 ***
Low water 4773 33296
Gear mean
length (m) Small meshMedium mesh 102140 139313 ***
Large mesh 216 467 ***
Mean number
of hooks gear-1 Unbaited longline 800 3470 ***