density functionals for bulk solids
The MIT Faculty has made this article openly available. Please share
how this access benefits you. Your story matters.
Citation
Csonka, Gábor I. et al. “Assessing the performance of recent density
functionals for bulk solids.” Physical Review B 79.15 (2009): 155107.
© 2009 The American Physical Society
As Published
http://dx.doi.org/10.1103/PhysRevB.79.155107
Publisher
American Physical Society
Version
Final published version
Citable link
http://hdl.handle.net/1721.1/51869
Terms of Use
Article is made available in accordance with the publisher's
policy and may be subject to US copyright law. Please refer to the
publisher's site for terms of use.
Assessing the performance of recent density functionals for bulk solids
Gábor I. Csonka,1John P. Perdew,2Adrienn Ruzsinszky,2Pier H. T. Philipsen,3 Sébastien Lebègue,4
Joachim Paier,5Oleg A. Vydrov,6and János G. Ángyán4
1Department of Inorganic and Analytical Chemistry, Budapest University of Technology and Economics, H-1521 Budapest, Hungary 2Department of Physics and Quantum Theory Group, Tulane University, New Orleans, Louisiana 70118, USA
3Scientific Computing and Modelling NV, Theoretical Chemistry, Vrije Universiteit, De Boelelaan 1083,
1081 HV Amsterdam, The Netherlands
4CRM2, UMR 7036, Institut Jean Barriol, Nancy-University and CNRS, Boîte Postale 239, F-54506 Vandoeuvre-lès-Nancy, France 5Faculty of Physics, Center for Computational Materials Science, Universität Wien, Sensengasse 8/12, A-1090 Wien, Austria
6Department of Chemistry, Massachusetts Institute of Technology, Cambridge, Massachusetts 02139, USA 共Received 28 November 2008; published 10 April 2009兲
We assess the performance of recent density functionals for the exchange-correlation energy of a nonmo-lecular solid, by applying accurate calculations with theGAUSSIAN, BAND, andVASPcodes to a test set of 24 solid metals and nonmetals. The functionals tested are the modified Perdew-Burke-Ernzerhof generalized gradient approximation共PBEsol GGA兲, the second-order GGA 共SOGGA兲, and the Armiento-Mattsson 2005 共AM05兲 GGA. For completeness, we also test more standard functionals: the local density approximation, the original PBE GGA, and the Tao-Perdew-Staroverov-Scuseria meta-GGA. We find that the recent density functionals for solids reach a high accuracy for bulk properties共lattice constant and bulk modulus兲. For the cohesive energy, PBE is better than PBEsol overall, as expected, but PBEsol is actually better for the alkali metals and alkali halides. For fair comparison of calculated and experimental results, we consider the zero-point phonon and finite-temperature effects ignored by many workers. We show howGAUSSIANbasis sets and
inaccurate experimental reference data may affect the rating of the quality of the functionals. The results show that PBEsol and AM05 perform somewhat differently from each other for alkali metal, alkaline-earth metal, and alkali halide crystals共where the maximum value of the reduced density gradient is about 2兲, but perform very similarly for most of the other solids共where it is often about 1兲. Our explanation for this is consistent with the importance of exchange-correlation nonlocality in regions of core-valence overlap.
DOI:10.1103/PhysRevB.79.155107 PACS number共s兲: 71.15.Mb, 31.15.E⫺, 71.45.Gm
I. INTRODUCTION
Popular or standard generalized gradient expansion ap-proximations 共GGA兲 共Ref. 1兲 for the exchange-correlation
energy of Kohn-Sham density-functional theory2,3 improve
upon the local density approximation共LDA兲 for atomization energies of molecules and enthalpies of formation derived from atomization energies, but GGAs 关e.g., PBE 共Perdew-Burke-Ernzerhof兲 共Ref. 1兲兴 do not improve the calculated
lattice constants for typical nonmolecular solids. Phonon fre-quencies, ferromagnetism, ferroelectricity, and many other properties are critically volume dependent, and thus highly accurate lattice parameters are indispensable for these prop-erties. Neither LDA nor GGA is clearly to be preferred for solid state applications, both giving errors of comparable magnitude 共though generally of opposite sign兲. At all tem-peratures, LDA systematically underestimates lattice con-stants and coefficients of thermal expansion, whereas GGA overestimates them.4In contrast, LDA共GGA兲 overestimates
共underestimates兲 bulk moduli and phonon frequencies. This behavior is a well established trend observed in numerous previous studies.5For a small set of nine metals, Grabowski
et al.5 have found that LDA underestimates the lattice
con-stant on average by −0.7% and GGA overestimates it on average by 1.8%. Generally, the error in the bulk modulus, is much larger in magnitude共LDA average, 11.6%; GGA aver-age, −13.7%兲 and inversely related to the error in the lattice constant. The inverse relation can be explained by the
vol-ume dependence of the total energy causing a monotonous decrease in the equilibrium bulk modulus B0with increasing
equilibrium volume.5Recently a linear combination of GGA
and LDA results was applied 共with 0.57 and 0.43 coeffi-cients, respectively兲 for the equilibrium lattice constant of Al.6
Popular GGAs 关e.g., PBE 共Ref. 1兲 and B88 共Ref. 7兲
+GGA correlation兴 fail seriously for the exchange-corre-lation component of the jellium surface energy, while LDA performs surprisingly well in that case. A detailed analysis of the exchange-correlation components shows that LDA ben-efits from large error compensation. It has been observed8,9
that in GGAs this delicate balance between exchange and correlation is not valid any more, although exchange and correlation components of the surface energy are separately improved.8,9 A recent study10 shows that even if the PBE
constraints are maintained, they can be satisfied by a con-tinuous range of diminished gradient dependence 共DGD兲 GGAs lying between PBE and LDA. In DGD GGAs, a bal-anced error cancellation between exchange and correlation is restored, which in turn results in good surface ener-gies.
Meta-GGAs using the positive kinetic energy density 关such as Tao-Perdew-Staroverov-Scuseria 共TPSS兲,11 which
adds several more exact constraints to those satisfied by PBE兴 might give excellent jellium surface energies, but do not improve sufficiently upon the lattice constants predicted by standard semilocal approximations,9 although TPSS
im-proves molecular atomization energies12 and many other
properties.13
Following the realization that popular GGA and meta-GGA functionals fail for solid properties 共e.g., for the energy-volume equation of state, surface energies, etc.兲, re-cently many modified functionals共all GGAs兲 have appeared in the literature providing improved results for solids at the expense of worsening the atomic total and molecular atomi-zation energies.14–16Kohn and Mattsson17proposed an
alter-native approach for incorporating effects of the inhomogene-ity of the electron densinhomogene-ity: the Airy gas approximation, a description of the electronic edge within the linear potential. Vitos et al.18 constructed from that model a GGA for
ex-change 共the local Airy gas or LAG functional兲 by fitting to the Airy gas conventional exchange energy density, and this exchange was combined with LDA correlation. In the ab-sence of an Airy gas correlation energy density, the AM05 condition,19fitting a density functional to the jellium surface
exchange-correlation 共xc兲 energy, was used to construct the AM05 GGA共Ref.19兲 for correlation.
The exchange gradient expansion coefficient 共兲 of the popular GGAs was set to obtain good atomic and atomiza-tion energies and good thermochemistry共where enthalpies of formation are traditionally calculated via atomization ener-gies, not from the calculated energies of the standard states of the elements兲. This coefficient, however, is about twice as large as for the exact slowly varying gradient expansion co-efficient for exchange 共= 0.22– 25 vs 10/81⬵0.123 46兲.14
The PBE GGA can be rebiased toward solids and surfaces by changing the exchange as well as the correlation gradient coefficient.14Recovering the slowly varying gradient
expan-sion for exchange for a wider range of the reduced density gradient s共as defined in Sec. II兲, combined with the jellium
surface energy condition19 for correlation,14 leads to a
re-vised PBE GGA for solids, named PBEsol GGA.14
Nonmo-lecular solids have important valence regions over which the density variation is so slow共with reduced gradient s⬍1兲 that the exchange energy can be described by the second-order gradient expansion. This suggests that recovery of the second-order gradient expansion over this range of s is a relevant constraint on a generalized gradient approximation for exchange in solids共although a similar constraint is not so relevant for correlation兲.20Importantly, the PBEsol performs
accurately for the exchange component of the jellium surface energy, not relying on a fit to the latter. Furthermore, PBEsol outperforms the original PBE GGA by correctly predicting the energy differences between isomers of hydrocarbons,21
while most of the GGAs and meta-GGAs fail for this long-standing problem.21 The larger gradient coefficient for
ex-change in the original PBE GGA is needed to produce the correct asymptotic expansion of the exchange energy for a neutral atom of large atomic number Z, as shown in Ref.20. In this large-Z limit, the electron density becomes slowly varying over space, except near the nucleus and in valence and tail regions.20Under an appropriate scaling, atomic
den-sities can become slowly varying essentially everywhere.20
The performance of PBEsol was studied in several recent papers. Ropo et al.22 compared the performance of the
PBEsol,14 PBE,1 AM05,19 and LAG 共Ref. 18兲
approxima-tions for 29 metallic bulk systems 共mono- and divalent sp,
plus several 3d, 4d, and 5d metals兲. These calculations were performed using the exact muffin-tin orbitals 共EMTO兲 method. The EMTO method is a screened Korringa-Kohn-Rostoker method that uses optimized overlapping muffin-tin potential spheres to represent the one-electron potential. The applied method has a limited precision共about 0.01 Å for the lattice constant, and 4 GPa for the bulk modulus兲, and the calculations were compared to uncorrected experimental re-sults 共i.e., the lattice constants and bulk moduli measured at 300 K were used for many metals, and zero-point phonon effects were ignored for all metals兲. Nevertheless, the afore-mentioned study confirms the good performance of the PBEsol,14 LAG,18 and AM05共Ref.19兲 functionals for most
of the metals, except for the 3d metals. For these metals PBE agrees better with the uncorrected experimental results. For most 3d metals even the PBE functional gives too-small lat-tice constants, and thus the even shorter latlat-tice constants given by PBEsol worsen the agreement. 共Note that LDA re-sults are quite poor for these metals.兲
Other recent studies of PBEsol have also been made. The PBEsol functional predicts correctly the two-dimensional– three-dimensional 共2D-3D兲 shape transition for gold clusters.23 It was tested recently for the compression curves
of eight transition metals 共Fe, Co, Ni, Zn, Mo, Ag, Pt, and Au兲 in the Mbar pressure range.24 It was found that PBEsol
gives an equation of state 共EOS兲 closer to experiment than PBE for Mo, Ag, Pt, and Au, although the overall accuracy of the PBE is somewhat better 共due to the more accurate -Fe results兲.24 PBEsol is expected14to become more
accu-rate as a solid becomes more compressed under pressure. We believe we can see evidence for this in Fig. 4 of Ref. 24, even for the 3d transition metals. PBEsol was applied to the B1 rock-salt-type phase of metallic thorium carbide,25 and with considerable success to the structural, electronic, and phonon properties of the cubic and tetragonal phases of SrTiO3 and BaTiO3.26 PBEsol was also tested in a general
discussion of material simulations.27 The PBEsol of course
shares the limitations of all GGA functionals.14,28–30 Several comments and replies on the GGAs for solids have appeared recently.31–34 Contrary to what might be inferred from Refs.
33and34, no GGA can recover the correct fourth-order gra-dient expansion for the exchange energy, even approxi-mately, but a meta-GGA can共and TPSS in fact does, at least for very slowly varying densities兲.
The validation of Kohn-Sham xc functionals2,3 can
be-come particularly dubious if relatively low-precision theoret-ical calculations are compared with experimental data with sizable uncertainties, e.g., due to the lack of thermal and anharmonic-expansion corrections in our case. The present work compiles highly accurate anharmonic-expansion-corrected experimental results and compares them with re-sults obtained using methods based on eitherGAUSSIAN-type orbital共GTO兲 basis sets as implemented inGAUSSIAN,35
nu-merical atomic orbital共NAO兲, and Slater-type orbital 共STO兲 basis sets as implemented in BAND 共Ref. 36兲 共BAND/linear combination of atomic orbitals, LCAO兲, or projector aug-mented plane waves 共PAW兲 as implemented in VASP
共VASP/PAW兲.37Moreover, we present a suitable methodology for testing density functionals for solids and revisit previous results to be found in the literature.
We use a test set of metals 共main group and transition metals兲 and nonmetals 共semiconductors and ionic insulators兲 comprising 18 solids compiled by Staroverov et al.38The test
set contains four main-group metals共Li, Na, K, and Al兲, four transition metals 共Cu, Rh, Pd, and Ag兲, five covalent solids 共diamond, Si, -SiC, Ge, and GaAs兲, and five ionic solids 共NaCl, NaF, LiCl, LiF, and MgO兲. This test set was extended by six more main-group metals共Rb, Cs, Ca, Sr, Ba, and Pb兲. All solids were calculated in their ambient-condition crystal structures and nonmagnetic phases.
II. DEFINITIONS
Here we summarize some standard definitions used in this paper. Consider a solid in which the total energy per atom is
e, and the volume per atom isv. We can compute a binding
energy curve e共v兲. The equilibrium volume v0 minimizes
e共v兲,
de
dv= 0 共v = v0兲. 共1兲
The bulk modulus is related to the second derivative at the minimum,
B0=vd
2e
dv2 共v = v0兲. 共2兲
The cohesive energy is the energy per atom needed to atom-ize the crystal,
e共⬁兲 − e共v0兲. 共3兲
Measurements of these quantities include the effects of nuclear vibration, while density-functional calculations give most directly the values for a static lattice.
A GGA for the exchange-correlation energy can be writ-ten as
Exc关n↑,n↓兴 =
冕
d3r nxcunif共n兲Fxc共s,rs,兲. 共4兲Here n↑ and n↓ are the electron spin densities, n = n↑+ n↓ is the total density, andxcunif共n兲 is the exchange-correlation en-ergy per particle of a spin-unpolarized electron gas of uni-form density n. In atomic units共hartrees兲,
xc unif共n兲 = − 3 4rs
冉
9 4冊
1/3 共n = 3/关4rs 3兴兲. 共5兲The enhancement factor Fxc, which distinguishes one
GGA from another, depends also upon the relative spin po-larization =共n↑− n↓兲/n 共which vanishes in our solids at equilibrium, but not typically in their free atoms兲 and on the reduced density gradient,
s = 兩ⵜn兩
2共32n兲1/3n, 共6兲
which expresses how fast the density varies on the scale of the local Fermi wavelength F= 2/共32n兲1/3= 3.274 rs.
The exchange enhancement factor Fxdoes not depend upon
rs共and in fact is the rs→0 limit of Fxc兲. Plots of the
enhance-ment factors provide a way to visualize the s dependence of the GGA. When s is set to zero, a GGA reduces to LDA.
III. METHODS
In our previous studies14,38we used GTO basis sets
devel-oped for atomic and molecular calculations.39 This kind of
basis set frequently includes small-exponent 共less than 0.10兲 diffuse functions that are far reaching. Inclusion of diffuse functions into a GTO basis set frequently improves the DFT results for molecules.40 However, diffuse functions decay
very slowly with distance and slow down dramatically the calculation of Coulomb contributions to the total energy of crystals. For crystals the standard GTO basis sets have to be modified as described in our earlier papers.14,38 The GTO
basis-set incompleteness limits the accuracy of the calculated lattice constant to 0.03 Å for metals; however, for covalent, semiconductor and ionic solids, carefully modifiedGAUSSIAN
basis sets might perform quite well.41 We compare our
re-sults to basis sets denoted by GTO1 used in Ref. 38 and GTO2 used in Refs. 14and 41. The two basis sets are dif-ferent for C 共diamond兲, Si, SiC, Ge, GaAs, and MgO.
As demonstrated in Ref.42, PBE equilibrium lattice con-stants obtained using PAW共VASP, Ref.37兲 and full-potential
linearized augmented plane-wave 关FP-LAPW, WIEN2K共Ref. 43兲兴 methods are de facto identical. In addition, comparing
those PBE lattice constants to the ones obtained using the LCAO code BAND, one realizes that BAND results compare very well to the results obtained using the aforementioned codes 共see Table I兲. Hence, those codes give consistent
re-sults, which are free from the problems arising when
GAUSSIAN basis sets are used for extended systems. In this work, we compare our earlier results14,38 calculated using a
modified version of theGAUSSIANprogram35with results
cal-culated using BAND and VASP. Our PBE results from VASP
can be directly compared to those of Paier et al.42The dis-crepancies are small and caused by slight differences in the volume range governing the Murnaghan fits. Importantly, none of the differences affect any conclusions.
TheVASPcalculations presented in this work are based on
the PAW,44,45 which describes the electron-ion interaction.
Characteristics of PAW are 共i兲 the inclusion of effects of the nodal structure of valence wave functions close to the ionic cores and共ii兲 the preservation of the orthogonality between the valence and the core states. Note that the chemically inert core states are usually kept frozen, but this is not inherent to PAW. For a profound description of an all-electron 共i.e., no frozen cores兲 implementation of PAW intoVASP, we refer the reader to the literature.46 Note that all PAW core potentials
include scalar relativistic corrections. At this point, the au-thors wish to briefly discuss two issues: first, the precision of the frozen-core PAW implementation ofVASPhas been thor-oughly tested against the all-electron full-potential linearized augmented plane-wave 共FP-LAPW兲 plus local orbitals 共lo兲 method关WIEN2K共Ref.43兲兴, which is commonly regarded as
the benchmark method for solid state applications. For a test set comprising main-group metals共Li, Na, and Al兲, d metals 共Cu, Rh, Pd, and Ag兲, as well as semiconducting and ionic
insulators共C, GaAs, and MgO兲, the agreement between PAW and FP-LAPW+ lo results共lattice constants, bulk moduli兲 is excellent共see Sec. B.1 of Ref.42兲. Second, it is possible to
use multiple xc functionals on the same set of PAW core potentials without sacrificing the high precision.47 Possible
transferability errors are largely reduced, if not eliminated, by virtue of the consistent recalculation of the core-valence interaction with the selected density functional. Although the core states are frozen in the configuration determined as the PAW core potential is generated using a density functional which might differ from the selected one, the errors thereby introduced are insignificant共e.g., LDA PAW core potentials, combined with the PBEsol xc functional in an actual appli-cation; for more details see Sec. III of Ref. 48兲. The PAW
pseudopotentials we have used are summarized in the Supplementary Material. The technical specifications to the
VASP calculations read as follows: for the PBEsol calcula-tions, a kinetic energy cutoff of 500 eV was used, except for Li共600 eV兲. All Brillouin zone integrations were performed on ⌫-centered symmetry-reduced Monkhorst-Pack49 k-point
meshes, using the tetrahedron method with Blöchl corrections.50 For Li 共20⫻20⫻20兲k points and for the
re-maining solids共16⫻16⫻16兲k points were used. As outlined in Sec. III of Ref.42, this setup ensures that the results are converged to within all specified digits. In the calculations for K and Ge presented in Tables V and VI of this work, 共24⫻24⫻24兲k points were used. A plane-wave cutoff of 600 eV was applied to K and a cutoff of 750 eV was applied to Ge. To minimize errors arising from the frozen core ap-proximation, we used PAW data sets treating the K 3s and 3p states and the Ge 3d states as valence electrons.
BANDLCAO calculations were performed at a benchmark level with the finest grid available, together with a very dense k-space sampling 共keywords in BAND: accuracy 6, Kspace 7兲, using the LDA electron densities. In other words, the BAND results for the beyond-LDA functionals are not fully self-consistent and demonstrate that full
self-consistency is not needed for high accuracy. We use the large QZ4P basis set consisting of numerical atomic orbital core orbitals and one NAO plus three Slater-type orbitals for the valence functions. The core is kept frozen during the self-consistency loop and very small in order to eliminate any significant effects of this approximation. For a discussion of errors in BAND/LCAO calculations, we refer the reader to Ref.51. We estimated the effect of self-consistency using the TZ2P basis set and found a 0.002 Å effect on the lattice constant and a 0.5% effect on the bulk moduli. The relativ-istic calculations were performed within the zeroth-order regular approximation共ZORA兲,52an accurate approximation
to the Dirac equation. For details of the implementation, see Ref. 53. We checked the spin-orbit effects, and found them negligible for the solids in this study.
We estimated the equilibrium lattice constant a0, bulk
modulus B0, and pressure derivative B1at T = 0 K by calcu-lating the energy of the unit cell at 7–15 points in the range
v0⫾5% 共where v0is the equilibrium volume per atom兲, then fitting the data to analytic equations of state e共v兲. The rela-tion between the lattice constants and the monoatomic cell volumes is:v0= a03/2 for the A2共bcc兲 crystal, v0= a03/4 for the
A1共fcc兲 crystal, and v0= a0
3/8 for the other solids in this
study.
For the present study we use the structureless pseudopo-tential model54 or “stabilized jellium” equations of state
共SJEOS兲.55 It is almost ideally suited for the description of
the regime close to the equilibrium volume. The form of the SJEOS is motivated by a physical picture of cohesion. We fit the SJEOS to the energy-volume data by minimizing the least-square error. As a check, we also used the Murnaghan EOS, which is more standard but has no microscopic foun-dation. In the present paper, we give B0 in units of GPa
共1 a.u.=29 421 GPa兲.
IV. LATTICE CONSTANTS
The experimental lattice constants include zero-point pho-non effects 共ZPPEs兲, and are often measured at room tem-TABLE I. Statistical data for the equilibrium lattice constants共Å兲 of the 18 test solids of Ref.38at 0 K calculated from the SJEOS. The Murnaghan EOS yields identical results within the reported number of decimal places. Experimental low temperature 共5–50 K兲 lattice constants are from Ref.56共Li兲, Ref.57共Na, K兲, Ref.58共Al, Cu, Rh, Pd, Ag兲, and Ref.59共NaCl兲. The rest are based on room temperature values from Ref.60共C, Si, SiC, Ge, GaAs, NaF, LiF, MgO兲 and Ref.57共LiCl兲, corrected to the T=0 limit using the thermal expansion from Ref.58. An estimate of the zero-point anharmonic expansion has been subtracted out from the experimental values共cf. Table II兲. 共The calculated values are precise to within 0.001 Å for the given basis sets, althoughGAUSSIANGTO1 and GTO2 basis-set incompleteness limits the accuracy to 0.02 Å.兲 GTO1: the basis set used in Ref.38. GTO2: For C, Si, SiC, Ge, GaAs, and MgO, the basis sets were taken from Ref.41. For the rest of the solids, the GTO1 basis sets and effective core potentials from Ref.38were used. The best theoretical values are in boldface. The LDA, PBEsol, and PBE GTO2 results are from Ref.14. The SOGGA GTO1 results are from Ref.15.
LDA LDA PBEsol PBEsol PBEsol AM05 SOGGA PBE PBE PBE TPSS
GTO2 VASP GTO2 BAND VASP VASP GTO1 GTO2 VASP BAND BAND
MEa共Å兲 −0.047 −0.055 0.022 0.010 0.012 0.029 0.009 0.075 0.066 0.063 0.048
MAEb共Å兲 0.050 0.050 0.030 0.023 0.023 0.036 0.024 0.076 0.069 0.067 0.052
MREc共%兲 −1.07 −1.29 0.45 0.19 0.24 0.58 0.19 1.62 1.42 1.35 0.99
MAREd共%兲 1.10 1.15 0.67 0.52 0.52 0.80 0.50 1.65 1.48 1.45 1.10
aMean error. bMean absolute error.
cMean relative error;共calculated-experimental兲/experimental 100%. dMean absolute relative error.
perature. These experimental values are not directly compa-rable with the results of ground-state electronic structure calculations 共0 K兲. We show here that neglecting these fre-quently overlooked effects might invalidate any comparison of experiment and theory. The experimental low temperature 共5–50 K兲 lattice-constants values are from Ref. 56 共Li, Sr兲,
Ref.57共Na, K, Rb, Cs, and Ba兲, Ref.58共Ca, Al, Pb, Cu, Rh,
Pd, and Ag兲, and Ref. 59 共NaCl兲. The rest are based on
room-temperature values from Ref. 60 共C, Si, SiC, Ge,
GaAs, NaF, LiF, MgO兲, and from Ref.57共LiCl兲, corrected to
the T = 0 limit using thermal expansion corrections from Ref.
58. For MgO Ref.61gives a lattice constant at 77 K that is smaller than our estimated 0 K data and we use that value 共4.203 Å兲. 共Note that a linear extrapolation of the lattice constant from 300 to 0 K is neither accurate nor used here.兲 For lattice constants the ZPPEs manifest as zero-point
anhar-monic expansion共ZPAE兲. This effect may be estimated from Eq. 共A6兲 of Ref.55,
⌬a0 a0 =⌬v0 3v0 = 3 16共B1− 1兲 kB⌰D B0v0 . 共7兲
The ZPAE was estimated from experimental a0, B0, v0,
and⌰D共Debye temperature兲 and from corrected theoretical
SJEOS B1TPSSvalues as described in Ref.38. Note thatv0in
Eq. 共7兲 is the volume per atom in the crystal. The ZPAE
corrections for C, Si, SiC, Ge, GaAs, NaCl, NaF, LiCl, LiF, and MgO are incorrectly given in Ref. 38; those values should be multiplied by 2 共as in the errata to Refs. 14 and
38兲. The magnitude of this correction is in the range of 0.003
and 0.046 Å共LiF兲, and it is relatively large for alkali metals 共0.8, 0.4, and 0.3% for Li, Na, and K, respectively兲 and ionic TABLE II. Strukturbericht symbols共Str.兲 and equilibrium lattice constants 共Å兲 of 24 test solids calculated
withBAND/LCAO from the SJEOS. The Strukturbericht symbols are used for the structure as follows: A1,
fcc; A2, bcc; A4, diamond; B1, rock salt; B3, zinc blende. The Murnaghan EOS yields identical results within the reported number of decimal places. Low-temperature共5–50 K兲 experimental lattice constants values are from Ref.56共Li, Sr兲, Ref.57共Na, K, Rb, Cs, and Ba兲, Ref.58共Ca, Al, Cu, Rh, Pd, and Ag兲, and Ref.59 共NaCl兲. The rest are based on room-temperature values from Ref.60 共C, Si, SiC, Ge, GaAs NaF, LiF, and MgO兲 and Ref.57共LiCl兲, corrected to the T=0 limit using the thermal expansion from Ref.58. An estimate of the zero-point anharmonic expansion is subtracted out from the experimental values共shown in boldface兲. The best theoretical values are also in boldface. We show, for reference, the AM05 values fromVASP. For K, Ge, Rb, Cs, Ca, Sr, Ba, and Pb, we have computed the AM05 values for this work; for the other solids, we have taken the AM05 values from Ref.48. Note that, for the alkali and alkaline-earth metals and alkali halides, AM05 values are often closer共Ref.32兲 to PBE than to PBEsol.
Solid Str. LDA PBEsol AM05 PBE TPSS Expt.-ZPAE ZPAE
Li A2 3.363 3.428 3.455 3.429 3.445 3.449 0.028 Na A2 4.054 4.167 4.212 4.203 4.240 4.210 0.015 K A2 5.046 5.210 5.297 5.284 5.360 5.212 0.013 Rb A2 5.373 5.561 5.670 5.667 5.736 5.576 0.009 Cs A2 5.751 5.991 6.182 6.207 6.241 6.039 0.006 Ca A1 5.328 5.446 5.474 5.521 5.524 5.553 0.011 Sr A1 5.782 5.901 5.966 6.004 5.988 6.045 0.008 Ba A2 4.747 4.866 4.957 5.022 4.973 4.995 0.005 Al A1 3.985 4.013 4.004 4.037 4.009 4.020 0.012 Pb A1 4.874 4.926 4.939 5.035 4.984 4.902 0.003 Cu A1 3.517 3.562 3.565 3.628 3.575 3.595 0.007 Rh A1 3.755 3.780 3.773 3.829 3.803 3.793 0.005 Pd A1 3.836 3.876 3.872 3.942 3.903 3.875 0.004 Ag A1 4.010 4.053 4.054 4.147 4.086 4.056 0.005 C A4 3.532 3.553 3.551 3.569 3.568 3.543 0.023 Si A4 5.403 5.431 5.431 5.466 5.451 5.416 0.014 SiC B3 4.329 4.356 4.350 4.377 4.366 4.342 0.018 Ge A4 5.623 5.675 5.678 5.759 5.721 5.640 0.012 GaAs B3 5.605 5.661 5.672 5.746 5.713 5.638 0.010 NaCl B1 5.465 5.602 5.686 5.700 5.703 5.565 0.029 NaF B1 4.502 4.629 4.686 4.705 4.705 4.579 0.030 LiCl B1 4.968 5.058 5.119 5.142 5.094 5.056 0.032 LiF B1 3.913 4.003 4.039 4.062 4.027 3.964 0.046 MgO B1 4.168 4.223 4.232 4.255 4.237 4.184 0.019
solids 共1.2 and 0.5% for LiF and NaCl, respectively兲. The neglect of this effect can be justified for benchmarking LDA and PBE functionals, where the average errors 共−1.3% and +1.6%, respectively, cf. TableI兲 are considerably larger than
the errors arising from the neglect of ZPAE. As the zero-point anharmonic motion always expands the lattice, the ne-glect of it introduces a systematic bias in the appraisal of the functionals. The average expansion is +0.015 Å 共⬃0.35%兲 for the ZPAE values shown in TableII. The uncorrected ex-perimental results are closer to PBE than LDA, while the ZPAE-corrected experimental values are smaller and thus move closer to LDA values. Table I also shows that recent functionals developed for solids are considerably closer to the corrected experimental values; the mean errors 共ME兲 in Table I are about 0.01 Å 共⬃0.25%兲 for the PBEsol and second-order generalized gradient approximation 共SOGGA兲 共Ref.15兲 functionals. Hence, neglecting the ZPAE biases the
rating of such functionals. Note that in the original SOGGA paper15 the ZPAE corrections for nonmetallic solids are
in-correctly given. Consequently our statistics for SOGGA in Table I is different from the published statistics,15 and the
agreement between SOGGA and the experiment is slightly worse here.
The good agreement between PBEsol and SOGGA is par-ticularly interesting since the SOGGA exchange enhance-ment factor was constructed from half-and-half mixing of PBE and RPBE,62using the exact gradient expansion
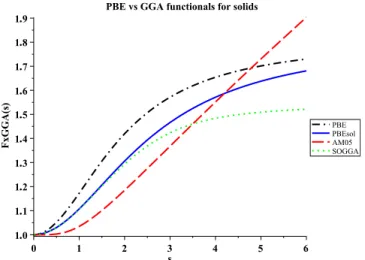
coeffi-cient共= 10/81兲 in the same way as suggested for PBEsol. The main difference between the exchange enhancement fac-tors is that SOGGA enforces a smaller value for the large gradient limit共tighter Lieb-Oxford bound兲, 1.552 instead of 1.804 used in PBE and PBEsol. Figure 1 shows that the SOGGA and PBEsol Fx共s兲 curves are very close to each
other for small gradients 共s⬍2兲. The SOGGA functional uses the unchanged PBE correlation functional. Conse-quently the origin of the PBEsol improvement over PBE in lattice constants for solids is to be found in the modification of the exchange functional. This is in agreement with the explanation given in the original PBEsol paper.14
The AM05 exchange functional19is based on the Airy gas
paradigm of Kohn and Mattsson.17 For small s, the AM05
and PBEsol exchange functionals are quite different共cf. Fig. S1 of Ref. 14兲: the PBEsol Fx共s兲 follows the exact gradient
expansion while the AM05 Fx共s兲 remains close to 1 if s⬍1兲.
Figure1shows that for larger s the AM05 gradient enhance-ment factor increases rapidly, crosses the PBE curve, and finally rises at s about 5.2 above 1.804, the maximum value that ensures satisfaction of the Lieb-Oxford bound for all possible densities. Indeed, AM05 will violate this lower bound on the exchange energy for any density in which s is sufficiently large everywhere, which can be achieved by starting with a suitable density n共r兲 for NⰇ1 electrons and scaling it down to n共r兲/N so that s⬃N1/3 becomes almost
everywhere much greater than 5.2. For example, start with the density of an N-electron crystal 共NⰇ1兲, and then scale down to a one-electron density that roughly resembles a Bloch-orbital density. Note that the LAG functional18 be-haves very similarly. Despite the difference in the exchange enhancement functions 共cf. Fig. 1兲, the AM05 and PBEsol
functionals have very similar exchange-correlation enhance-ment factors Fxc共s,rs,= 0兲 for rs= 1 as demonstrated in Fig. 2 for the spin-unpolarized density, where rs is the
Wigner-Seitz radius and =共n↑− n↓兲/n is the relative spin polariza-tion. For small s, the two functionals are quite similar for electron densities around 1⬍rs⬍5 共typical of valence and
0.5 1.5
____
FIG. 2. 共Color online兲 Exchange-correlation gradient enhance-ment factors, Fxc共s,rs,=0兲 vs the reduced density gradient s in the
range 0ⱕsⱕ2.2 for the generalized gradient approximations AM05 共dashed red兲 and PBEsol 共solid blue兲 for rs= 0 , 0.5, 1 , 2 , 5. The
higher the curve, the larger the rs. rsdenotes the Wigner-Seitz
ra-dius, and denotes the relative spin polarization. In LDA
Fxc共s,rs,=0兲=Fxc共s=0,rs,=0兲. The active electrons in most
sol-ids have 0.5⬍ ⬃rs⬍ ⬃5, and 0⬍ ⬃s⬍ ⬃2 共with 0⬍ ⬃s⬍ ⬃1 in some solids兲. The higher densities 共smaller rs’s兲 present in the
va-lence and core-vava-lence overlap regions are likely to be more impor-tant for the lattice consimpor-tant.
FIG. 1. 共Color online兲 Exchange-only gradient enhancement factors Fx共s兲 vs the reduced density gradient s in the range 0ⱕs ⱕ6 for the generalized gradient approximations PBE, PBEsol, AM05, and SOGGA. In LDA, Fx共s兲=Fx共s=0兲=1.
core-valence regions of solids兲. However, for large s and rs
values, the two functionals behave quite differently. Figure2
shows that the AM05 curves go below the PBEsol curves for
s⬍1 and 2⬍rs⬍5, and after going through a minimum they
cross the PBEsol curves and increase more steeply than the PBEsol curves for large s. The difference between the AM05 and PBEsol curves increases with s共and with rsfor rs⬎2兲.
Inspection of the PBE results in Table I shows that the
BAND/LCAO and VASP/PAW results agree quite well with each other. The calculated lattice constants depend on the choice of theGAUSSIANbasis set. Application of the GTO1 or GTO2 basis sets gives 0.010– 0.012 Å longer lattice con-stants on average, compared to convergedBAND/LCAO and
VASP/PAW results. Consequently nonconverged GAUSSIAN
basis sets might slightly bias the estimation of the perfor-mance of the functionals that reach a high accuracy such as PBEsol and SOGGA 共cf. mean error ME⬵0.010 Å, and mean absolute error MAE⬵0.023 Å in Table I兲. Even the
estimation of the performance of the TPSS in Ref.13might be biased by 0.01 Å. The TPSS BAND/LCAO results agree better with experiment than TPSS/GTO1 results 共cf. MEs = 0.048 and 0.058 Å, and MAEs= 0.052 and 0.059 Å, re-spectively; for the BAND results see Table I兲. Comparison
with theVASPorBANDresults shows that the more expensive GTO2 basis set is somewhat better for diamond and Si than the GTO1 basis set, but no clear improvement can be ob-served for SiC, Ge, GaAs, and MgO. An earlierBANDstudy shows that the inclusion of scalar relativistic effects shortens
the lattice constants of Cu 共−1%兲 and Ag 共−2.4%兲.51 The all-electron 共nonrelativistic兲 GTO calculations agree well with the relativistic BAND results for Cu due to the GTO1 basis set error. The relativistic effective core potential共ECP兲 basis sets used for Rh, Pd, and Ag in Refs. 14and38 give mixed results: good agreement with BAND for Pd, shorter lattice constant for Ag 共−0.02 Å兲, and longer for Rh 共+0.04 Å兲.
The mean relative error 共MRE兲 of the PBEsol results in Table I 共MRE⬵0.2%兲 lies between those of PBE 共MRE
⬵1.4%兲 and LDA 共MRE⬵−1.3%兲. The SOGGA/GTO1 re-sults are also excellent, but a small GTO1 basis set error is included in these results. Removing this small error共e.g., by
BAND兲 will not deteriorate the SOGGA statistics for these 18
solids. Note that in the evaluation of the SOGGA functional15 two small errors, the basis set error and the ten
incorrect experimental references compensate each other. The TPSS BAND/LCAO results 共MRE⬵1.0%兲 in Table I
show some improvement compared to PBE results, but they do not reach the quality of the PBEsol results.
The recent AM05 functional performs well too, but the lattice constants are slightly too long on average and thus less accurate compared to PBEsol or SOGGA results. Figure
3 shows the individual relative errors共%兲 of the lattice con-stants calculated with PBEsol, AM05, and SOGGA com-pared to the ZPAE-corrected experimental lattice constants at 0 K. The larger errors of the AM05 functional for bulk K, NaCl and NaF contribute to the larger statistical error of the FIG. 3. 共Color online兲 Deviations 共%兲 between calculated ground state and corrected experimental lattice constants 关共calc.-expt.兲/expt. 100%兴 of the 18 test solids. The PBEsol/GTO2 results are from Ref.14. The PBEsol/BANDandVASPresults are from the present work and calculated with the SJEOS. The Murnaghan EOS yields identical results within the reported number of decimal places. The AM05/VASP
results are from Ref. 48, except K and Ge 共calculated for this work兲. The SOGGA/GTO1 results are from Ref.15. Experimental low-temperature共5–50 K兲 lattice constants are from Ref.56共Li兲, Ref.57共Na and K兲, Ref.58共Al, Cu, Rh, Pd, and Ag兲, and Ref.59共NaCl兲. The rest are based on room temperature values from Ref.60共C, Si, SiC, Ge, GaAs NaF, LiF, and MgO兲 and Ref.57共LiCl兲, corrected to the T=0 limit using the thermal expansion from Ref.58. An estimate of the zero-point anharmonic expansion is subtracted out from the experimental values共cf. TableII兲.
AM05 functional for this test set comprising 18 solids. The AM05 lattice constants are VASP/PAW values taken from Ref.48, except for K and Ge, which were computed for this work. According to the mean absolute relative errors 共MARE兲 in Table I, the order of accuracy is PBEsol ⬵SOGGA⬎AM05⬎TPSS⬎PBE⬵LDA.
The systematic deviation between AM05 and PBEsol and the performance of the TPSS functional will be discussed on a larger test set, in support of statements made by some of us in Ref. 32. Table IIshows the Strukturbericht symbols, the LDA, PBEsol, and PBE lattice constants for 24 solids calcu-lated with the BAND/LCAO program, together with the ZPAE-corrected experimental values共Å兲 and the ZPAE cor-rections 共Å兲. Comparison of PBEsol/BAND results with the
EMTO results22 shows that this latter method results in too
long lattice constants for Cs, Ca, and Sr; the difference is 0.01– 0.02 Å. Detailed comparison shows that the difference between AM05 and PBEsol lattice constants increases sys-tematically with increasing atomic number for alkali and alkaline-earth metals. For Rb and Cs the AM05 lattice con-stants are quite far from the PBEsol results 共larger by 0.10 and 0.15 Å, respectively兲, and agree well with the PBE lat-tice constants.22 Similar effects can be observed for Sr and
Ba bulk metals.22As discussed earlier 共cf. Fig. 3兲, PBEsol
outperforms AM05 for ionic insulators and heavier alkali metals while AM05 outperforms PBEsol for alkaline-earth metals. In this sense the recent observation31that AM05 and
PBEsol yield identical results for a wide range of solids is not valid for the heavier alkali and alkaline-earth metals and ionic insulators.
Inspection of the results in Table IIshows that the TPSS functional performs well for Li, Na, Ca, Sr, Ba, Al, Cu, and Rh, and it gives too long lattice constants for K, Rb, and Cs, making the TPSS results worse than PBE for these latter metals. Interestingly, for Ca, Sr, and Ba the TPSS results are quite good 共MARE=0.3%兲 and agree better with the PBE 共MARE=0.4%兲 and AM05 共MARE=1%兲 results than with the too short PBEsol results共MARE=2%兲, while for Al, Cu, and Rh the TPSS results共MARE=0.3%兲 agree well with the PBEsol results 共MARE=0.3%兲. The AM05 and PBE lattice constants are too long for these solids; MARE= 0.5% and 0.9%, respectively. This shows the potential of the meta-GGA to alter trends, as for both groups of solids its MARE remains around 0.3%.
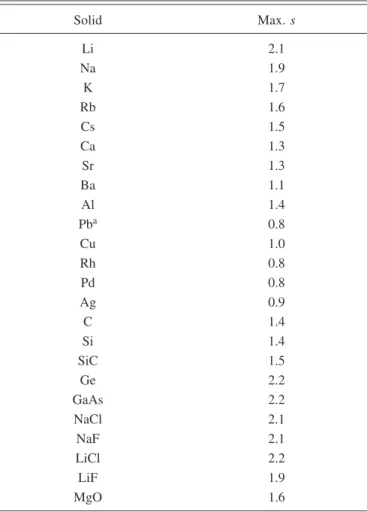
Table III shows the maximal values of the reduced ex-change gradient s calculated for our solids fromBAND elec-tron densities. The values show that Li, the ionic solids, Ge and GaAs have the largest maximal s 共2.1–2.2兲, while this value is considerably smaller for the other solids 共0.8⬍s ⬍1.7兲. This is the explanation for the surprising similar per-formance of the AM05 and PBEsol functionals for many metals, and the larger differences for ionic solids, where the large s and rsregion is more important than in metals.
Fuchs et al.63 presented convincing evidence that two
density functionals that reduce to LDA for a uniform density can produce different lattice constants largely through their differences in the region of core-valence overlap, and not in the pure valence region. This conclusion also seems sup-ported by the analysis of Ruban and Abrikosov.64Figure 2 of
Ref. 65 plots s and rs vs distance from the nucleus for the
nitrogen atom, showing that rs⬇1 or less and 0.3⬍s⬍1.3 in
the core-valence overlap region. Our Fig. 2 shows an espe-cially close agreement between AM05 and PBEsol for all s at
rs⬇1, and reasonable agreement for s⬍1 at rsaway from 0.
These features might explain the rough agreement of AM05 and PBEsol lattice constants for most solids, and their close agreement for solids with s⬍1 everywhere. We suspect that the maximum s values for solids in our Table III tend to occur in the core-valence overlap region. These issues de-serve further study.
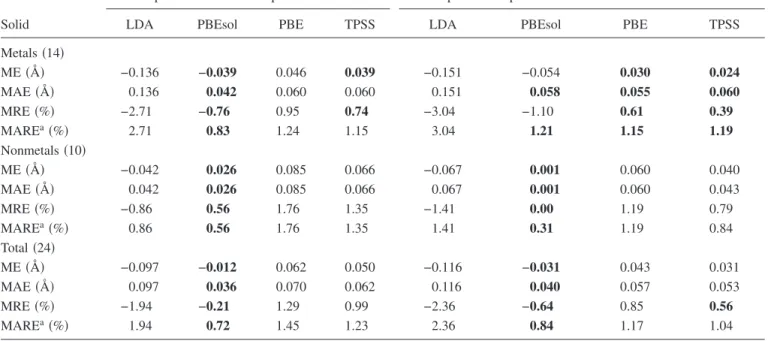
The results in Table IVshow that the performance of the functionals is different for metallic and nonmetallic solids compared to thermally and ZPAE-corrected experimental re-sults. Note that Refs.22and41use partially or uncorrected room-temperature experimental lattice constants as reference values. In Table IV we also show the performance of the same functionals compared to the same experimental values used in Refs. 22and41.
For the 14 metals in this test set, the PBEsol functional is the best performer, giving slightly shorter lattice constants than the fully corrected experimental values 共MRE=−0.7%, MARE= 0.8%兲. PBE performs quite well and gives slightly too long lattice constants by about 1%共MARE=1.24%兲. The TABLE III. Maximal values of the reduced gradient, s共a.u.兲 in various solids calculated by BAND/LCAO. A region of radius 0.2
bohr/Z around the nucleus, where relativistic effects might be im-portant, has been excluded.
Solid Max. s Li 2.1 Na 1.9 K 1.7 Rb 1.6 Cs 1.5 Ca 1.3 Sr 1.3 Ba 1.1 Al 1.4 Pba 0.8 Cu 1.0 Rh 0.8 Pd 0.8 Ag 0.9 C 1.4 Si 1.4 SiC 1.5 Ge 2.2 GaAs 2.2 NaCl 2.1 NaF 2.1 LiCl 2.2 LiF 1.9 MgO 1.6
aLargest significant value 共the integration weight is larger than 10−3兲.
LDA MRE is the largest, −2.7%. Our results for the main-group metals can be compared to the results in Table II of Ropo et al.22for the same metals. As noted earlier, the cal-culated EMTO lattice constants are in reasonably good agreement for LDA, PBEsol, and PBE with our calculated lattice constants in TableII. However, for this test set Ropo
et al. conclude that PBE is the best performer. The origin of
the different conclusion is the neglect of the ZPAE for all metals and the use of room-temperature experimental lattice constants for Al, Pb, Cu, Rh, Pd, and Ag共cf. the good agree-ment between PBE and partially or uncorrected room tem-perature experimental results in TableIV兲. According to the
MAREs for corrected experimental lattice constants in Table
IV, the order of accuracy is PBEsol⬎TPSS⬎PBEⰇLDA
for metals.
For the ten nonmetals in this test set, the PBEsol and LDA perform almost equally well, giving opposite +0.6 and −0.7% MREs, respectively, while PBE gives MRE ⬵ +1.8%. The LDA performs very well for the lattice con-stants of our nonmetallic solids, but studies that ignore the ZPAE might easily draw wrong conclusions. The results in TableIVshow that ignoring ZPAE effects shifts the MRE by 0.52%共the ME by about 0.02 Å兲 away from the LDA. Note that PBEsol gives the same but opposite error for metals and nonmetals, and this contributes to its good performance for the whole test set 共cf. Tables II and IV兲. According to the
MAREs for corrected experimental lattice constants in Table
IV, the order of accuracy is PBEsol⬎LDA⬎TPSS⬎PBE
for nonmetals.
V. BULK MODULI
Temperature and phonon effects can modify the bulk modulus up to 20% for Li共Ref.66兲 and 5%–8% for the other
metals studied here. The temperature effects are about 5%– 15%, the ZPPEs are about 2% on average 共span 1%–5% range兲. The experimental error is up to 5%–10%.
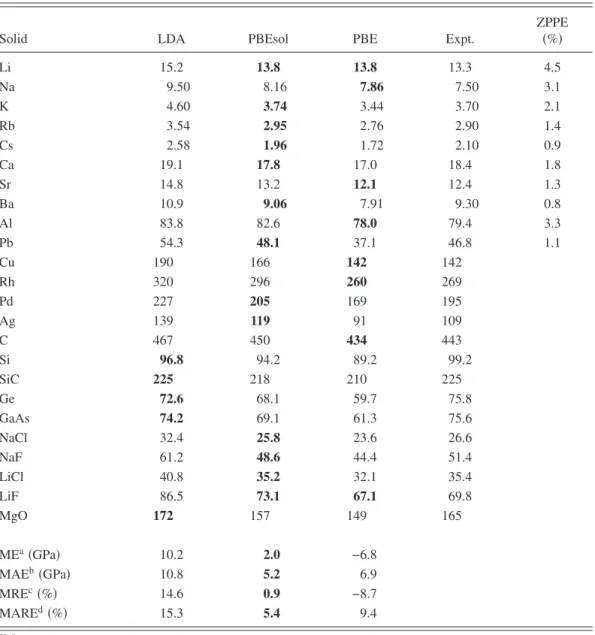
TableVshows the calculated and experimental38,55,60bulk
moduli 共GPa兲 for our extended set of 24 solids. The experi-mental references used for Table V are corrected for zero temperature but do not include ZPPEs. However, for main-group metals, the estimated ZPPEs are given in Ref.55共cf.
TableVand Eq. S12兲, and we show them in percentage. The
ZPPEs make the corrected experimental bulk moduli 2% stiffer on average. As bulk moduli of these solids span a large, more than 2-order-of-magnitude 共2–440 GPa兲 range, we also show the mean relative error共MRE %兲 and the mean absolute relative error 共MARE %兲. Investigation of the re-sults in Table Vshows that the LDA overestimation of the bulk moduli is about 15%共too stiff兲 and the PBE underesti-mation is about 9%共too soft, but considerable improvement over LDA兲. The PBEsol performance is excellent, giving about a 1% overestimation. The relevant AM05/VASP
results48are on the PBE side共too soft兲 and quite close to the
experimental results, while PBEsol is on the LDA side and again close to the experimental results. The ZPPE correc-tions would shift the corrected experimental values in the direction of LDA and PBEsol and worsen the agreement be-tween experiment and AM05 or PBE results. Gaudoin and TABLE IV. Statistical data, mean error, mean absolute error, mean relative error共MRE %兲, and mean absolute relative error 共MARE %兲, for lattice constants 共Å兲 of the 14 metals and 10 nonmetals in the test set of 24 solids calculated withBAND/LCAO from the SJEOS.
Comparisons to thermally and ZPAE-corrected experimental results共left兲 and to partially or uncorrected room temperature experimental values used in Refs.22and41共right兲. The best agreement with the experiment are in boldface. For the AM05 values of TableII, compared to corrected experimental results, the total ME and MAE are 0.025 and 0.048 Å, respectively. The AM05 functional performs better for metals共MAE=0.045 Å兲 than for nonmetals 共MAE=0.052 Å兲.
Solid
Compared to corrected experimental values Compared to experimental values used in Refs.22and41
LDA PBEsol PBE TPSS LDA PBEsol PBE TPSS
Metals共14兲 ME共Å兲 −0.136 −0.039 0.046 0.039 −0.151 −0.054 0.030 0.024 MAE共Å兲 0.136 0.042 0.060 0.060 0.151 0.058 0.055 0.060 MRE共%兲 −2.71 −0.76 0.95 0.74 −3.04 −1.10 0.61 0.39 MAREa共%兲 2.71 0.83 1.24 1.15 3.04 1.21 1.15 1.19 Nonmetals共10兲 ME共Å兲 −0.042 0.026 0.085 0.066 −0.067 0.001 0.060 0.040 MAE共Å兲 0.042 0.026 0.085 0.066 0.067 0.001 0.060 0.043 MRE共%兲 −0.86 0.56 1.76 1.35 −1.41 0.00 1.19 0.79 MAREa共%兲 0.86 0.56 1.76 1.35 1.41 0.31 1.19 0.84 Total共24兲 ME共Å兲 −0.097 −0.012 0.062 0.050 −0.116 −0.031 0.043 0.031 MAE共Å兲 0.097 0.036 0.070 0.062 0.116 0.040 0.057 0.053 MRE共%兲 −1.94 −0.21 1.29 0.99 −2.36 −0.64 0.85 0.56 MAREa共%兲 1.94 0.72 1.45 1.23 2.36 0.84 1.17 1.04 a共calculated-experimental兲/experimental 100%.
Foulkes66give B0 values after removal of finite temperature
and zero-point effects for Li, Al, and Pb: 14.5, 81.3, and 47.3 GPa, respectively. These values agree well with our PBEsol values in TableV.
Using GTO1 basis set makes the solids on average stiffer by 2% for LDA and PBE compared toBANDor earlierVASP
results.48Thus the GTO1 results in Ref. 38might contain a
2%–3% random basis set error. The 0.3% average deviation between PBEsol/BANDandVASPbulk moduli shows the pre-cision of our current calculations. The BANDand VASP共not
shown兲 agree well with each other for LDA, PBE, and PBEsol bulk moduli. We plan to include more 3d, 4d, and 5d metals, and other nonmetallic solids in our test set. However,
the lack of good experimental bulk moduli at 0 K limits our effort to expand the test set.
The large mean absolute relative errors of the bulk modu-lus 共15% for LDA, 9% for PBE兲 shown in Table Vare re-duced to 5% by PBEsol. One can alternatively achieve this level of accuracy by combining LDA or PBE equation-of-state parameters with the experimental value of the lattice constant; see Eq. 共21兲 and Table IV of Ref.38.
VI. COHESIVE ENERGIES
Table VI lists the cohesive energies 共eV/atom兲 obtained for 18 solids from PBE and PBEsol functionals using differ-TABLE V. Bulk moduli共GPa兲, zero-point phonon effects 共ZPPE %兲, and statistical data of 24 test solids
calculated withBAND/LCAO from the SJEOS. The experimental data include thermal corrections but not the
ZPPE, as ZPPE values are not available for most of the solids. The available ZPPE corrections are taken from Ref.55. The best theoretical values are in boldface.
Solid LDA PBEsol PBE Expt.
ZPPE 共%兲 Li 15.2 13.8 13.8 13.3 4.5 Na 9.50 8.16 7.86 7.50 3.1 K 4.60 3.74 3.44 3.70 2.1 Rb 3.54 2.95 2.76 2.90 1.4 Cs 2.58 1.96 1.72 2.10 0.9 Ca 19.1 17.8 17.0 18.4 1.8 Sr 14.8 13.2 12.1 12.4 1.3 Ba 10.9 9.06 7.91 9.30 0.8 Al 83.8 82.6 78.0 79.4 3.3 Pb 54.3 48.1 37.1 46.8 1.1 Cu 190 166 142 142 Rh 320 296 260 269 Pd 227 205 169 195 Ag 139 119 91 109 C 467 450 434 443 Si 96.8 94.2 89.2 99.2 SiC 225 218 210 225 Ge 72.6 68.1 59.7 75.8 GaAs 74.2 69.1 61.3 75.6 NaCl 32.4 25.8 23.6 26.6 NaF 61.2 48.6 44.4 51.4 LiCl 40.8 35.2 32.1 35.4 LiF 86.5 73.1 67.1 69.8 MgO 172 157 149 165 MEa共GPa兲 10.2 2.0 −6.8 MAEb共GPa兲 10.8 5.2 6.9 MREc共%兲 14.6 0.9 −8.7 MAREd共%兲 15.3 5.4 9.4 aMean error. bMean absolute error.
cMean relative error;共calculated-experimental兲/experimental 100%. dMean absolute relative error.
ent methods 共GTO, VASP/PAW and BAND/LCAO兲. In GAUSSIAN, the basis functions used to describe core electrons
must be the same in the solid and in the atom, so that basis-set limitations in the core will cancel out of the cohesive energy. But converged energies for the valence electrons in a solid can be achieved without the more diffuse basis func-tions needed to converge the energy of the valence electrons in a free atom or molecule. These more diffuse basis func-tions can create computational problems38 for our solids
other than C, Si, SiC, Ge, and GaAs. With this in mind, we have calculated cohesive energies from GAUSSIANfor those other solids, using different GTO basis functions for the
atom 共standard molecular basis sets兲 and for the valence electrons in the solid共standard38,41 pruned versions thereof兲,
and these cohesive energies are largely confirmed by those from ourBANDandVASPcalculations.
Reference38, using the same GTO basis sets for the solid as for the free atom, was only able to report four cohesive energies 共C, Si, SiC, Ge兲. Reference 38 was able to report four more cohesive energies 共NaCl, NaF, LiCl, and LiF兲, using different basis sets for the cation in the solid and for the corresponding free atom 共as we do兲, but questioned whether this could work for the metals. It was found that PBE performs considerably better than LDA 共serious TABLE VI. Cohesive energies共eV/atom兲 of 18 selected solids at equilibrium. Experimental values are
based on zero-temperature enthalpies of formation of the crystals and gaseous atoms. The experimental cohesive energies were corrected for zero-point vibration energy of the solids. The best theoretical values are in boldface.
Solids
PBE PBE PBEsol PBEsol Expt.b Expt.
ZPVEc
GTO2 VASPa GTO2 BAND +ZPVE Errorb
Li 1.61 1.61 1.68 1.67 1.668 0.010 0.033 Na 1.11 1.08 1.16 1.15 1.132 0.007 0.015 K 0.86 0.86 0.93 0.93 0.940 0.008 0.009 Al 3.38 3.43 3.76 3.81 3.437 0.042 0.041 MEd −0.05 −0.05 0.09 0.09 MAEe 0.05 0.05 0.10 0.10 Cu 3.40 3.48 3.91 4.05 3.524 0.012 0.034 Rh 5.58 5.72 6.53 6.65 5.784 0.030 0.034 Pd 3.70 3.71 4.43 4.43 3.918 0.028 Ag 2.50 2.52 3.06 3.08 2.972 0.008 0.022 MEd −0.26 −0.19 0.43 0.50 MAEe 0.26 0.19 0.43 0.50 C 7.74 7.71 8.29 8.27 7.583 0.005 0.216 Si 4.58 4.56 4.96 4.93 4.681 0.083 0.062 SiC 6.39 6.40 6.85 6.87 6.488 0.119 Ge 3.80 3.73 4.20 4.22 3.863 0.031 0.036 GaAs 3.22 3.15 3.60 3.61 3.393 0.040 0.043 MEd −0.06 −0.09 0.38 0.37 MAEe 0.12 0.14 0.38 0.37 NaCl 3.16 3.09 3.29 3.23 3.341 0.031 NaF 3.88 3.82 4.02 4.04 3.978 0.048 LiCl 3.40 3.36 3.56 3.53 3.591 0.041 LiF 4.36 4.33 4.51 4.56 4.471 0.071 MgO 4.97 5.01 5.30 5.31 5.271 0.050 0.092 MEd −0.18 −0.21 0.00 0.00 MAEe 0.18 0.21 0.04 0.07 TMEf −0.13 −0.14 0.22 0.24 TMAEg 0.15 0.15 0.23 0.26
aReference42, except K and Ge. K and Ge were calculated for this work. bReference68.
cThe zero-point vibration energies are calculated from the Debye temperatures⌰
D: ZPVE=共9/8兲kB⌰D.
dMean error. eMean absolute error. fTotal mean error.
overbinding兲 or TPSS 共underbinding兲, but the small test set of eight nonmetals was insufficient for establishing trends.38
A more complete study42 using VASP on a test set different
from but overlapping with our test set 共with only K and Ge missing兲 shows that PBE is better for cohesive energies than HSE共Ref.67兲 or PBEh.42In TableVIwe show the relevant PBE VASP results from Ref.42. Comparison of GTO2 and
VASP results shows good agreement, except for Cu and Rh. Note that the GTO2 result for Cu is nonrelativistic. Similar agreement between GTO2 and BAND results is shown in Table VIfor the PBEsol functional. Comparison of PBEsol results in Table VI and Ref. 15 shows relatively large dis-agreement for ionic solids共more than 0.1 eV兲.
We collected the 0 K experimental results from Ref. 68
with the experimental errors where available. The experi-mental cohesive energies were corrected by the zero-point vibration energy 共ZPVE兲 共Ref. 51兲 calculated from the
De-bye temperature⌰D,
ZPVE =共9/8兲kB⌰D. 共8兲
The values in Table VI show that the ZPVE is frequently comparable in magnitude to the experimental error. The re-sults in Table VIshow the general overbinding tendency of PBEsol. PBE performs better than PBEsol except for ionic solids where PBEsol shows an excellent performance.
Note that evaluation of the cohesive energy requires a generalization of the density functional to a spin-density functional共⬎0兲, which was published for most functionals but not for AM05 at the time this paper was written; how-ever, see Refs. 69and70.BANDandVASPhave a spherical, spin-unpolarized reference atom, but we have used the real atom in our cohesive energy calculations. The atomic correc-tions, which turn the energy of the reference atom into that of the real one, are available from the authors.
VII. CONCLUSIONS
We have shown that neglecting the thermal and zero-point phonon effects might invalidate any comparison of experi-ment and theory for lattice constants and bulk moduli. The uncorrected experimental results are much closer to PBE than LDA. For 24 solids in our test set, after correction of the experimental data, PBE systematically overestimates the lat-tice constants共by 1.3%兲 and underestimates the bulk moduli 共by 9%兲, while the LDA results show larger and opposite errors 共1.9 and 15%, respectively兲. Mean errors of recent functionals developed for solids such as PBEsol are about 0.01 Å 共⬃0.25%兲 for the lattice constants and 1% for the bulk moduli. Hence, neglecting the effect of the zero-point anharmonic expansion, +0.015 Å 共⬃0.35%兲, biases the judgment about the performance of such functionals. Ne-glecting the thermal expansion adds further bias 共up to 1.4%兲.
For the lattice constants of our ten nonmetals, PBEsol and LDA perform almost equally well, giving opposite +0.6 and −0.7% average relative errors, respectively. PBEsol gives the similar but opposite average relative error for metals 共−0.7%兲 and nonmetals 共0.6%兲; this contributes to its good performance for the whole test set of 24 solids. The PBE
functional shows poor performance for nonmetals and quite good performance for metals where LDA fails.
The SOGGA functional uses a PBEsol-like exchange functional for s⬍2 and the PBE correlation functional 共not fitted to the surface exchange-correlation energy of jellium, unlike the correlation functionals of AM05 and PBEsol兲. The PBEsol and SOGGA lattice constants agree quite well. Con-sequently the origin of the PBEsol improved lattice constants for solids is to be found in the modification of the exchange functional. This is in agreement with the explanation given in our original PBEsol paper.14 Unlike AM05 lattice constants,
PBEsol and SOGGA lattice constants do not rely upon a large error cancellation between exchange and correlation.
In Sec.IV, we have proposed an explanation, in terms of the exchange-correlation enhancement factor Fxc共s,rs兲, for
the close similarity of AM05 and PBEsol lattice constants in solids with s⬍1 everywhere, and the greater difference for some solids with smaxⰇ1. Our explanation is consistent with
the importance of exchange-correlation nonlocality in the core-valence overlap region.
The GAUSSIAN basis sets introduce a small 0.005– 0.009 Å 共0.2%兲 lattice constant lengthening that slightly biases the assessment of the functionals, but does not change the conclusion. Our previous conclusions based on
GAUSSIANbasis sets remain valid and supported byVASPand
BAND results. This shows that carefully selected GAUSSIAN
basis sets might be suitable for testing density functionals, despite the serious problems of basis-set construction.
The GAUSSIAN basis sets introduce 2%–3% uncertainty into the calculated bulk moduli, while the VASP and BAND
results agree within 0.3%. These errors are negligible com-pared to the experimental errors 共up to 10%兲 and the errors arising from neglect of thermal 共up to 15%兲 and zero-point phonon effects共1%–3%, up to 4.5%兲.
For cohesive energies of the 18 solids, PBEsol shows an overbinding tendency 共by 0.22 eV/atom on average兲. PBE slightly underbinds 共by 0.13 eV/atom on average兲 and per-forms better than PBEsol except for alkali metals and ionic solids where PBEsol shows an excellent performance.
The results suggest that possibly no single GGA can de-scribe with high accuracy the surface energies, lattice con-stants, bulk moduli, and cohesive energies of solids at the same time. The original PBE is biased toward a correct de-scription of atoms and molecules, while PBEsol is biased toward solids. Many GGA variants that do not build on the exact gradient expansion for exchange might give accurate lattice constants. Restoring the gradient expansion for ex-change over a wide range of reduced density gradients共as in PBEsol兲 might not be necessary for good lattice constants for a limited class of solids, but is needed to construct more universal approximations.32 The TPSS meta-GGA provides
an excellent description of atomic total energies, molecular atomization energies, and jellium surface energies, but its lattice constants might be improved by imposing this PBEsol-like condition.
In short, the PBEsol GGA for solids works well for the lattice constants and bulk moduli of typical nonmolecular solids. An accurate lattice constant and bulk modulus may4
be accompanied by a good description of thermal effects. For the open-shell 3d transition metals, PBE is better22,24 than
PBEsol, but these solids are bonded in part by the highly localized 3d orbitals to which the second-order gradient ex-pansion of the exchange energy共on which PBEsol is based兲 may not apply.22 Under sufficiently intense compression, all
solids共including the 3d metals兲 should be better described14
by PBEsol.
Since PBE is much better than PBEsol for the total ener-gies of atoms, and for the atomization enerener-gies of molecules, we expected that PBE would also be better for the cohesive energies of solids. While this has been confirmed here in a statistical sense, we also find unexplained special cases共the alkali metals and the alkali halides, where the atoms have one electron outside a closed shell or one electron missing from a closed shell兲 where PBEsol cohesive energies are excellent and much better than PBE. For a functional that will be accurate over a much wider range of systems, we intend to look beyond the GGA level to an improved meta-GGA. A meta-GGA form is more flexible, and computation-ally not much slower than a GGA, making it the natural successor of LDA and GGA in applications.
Note added. After this paper was accepted, we learned of
another71lattice-constant test of semilocal functionals, for 60
solids using the WIEN2K code, with results similar to ours. The mean absolute deviation in angstrom of each column of
our TableII共excluding Cs, not studied in Ref.71兲 from the
results of Ref. 71 is 0.005 共LDA兲, 0.008 共PBEsol, AM05兲, 0.009 共PBE兲, 0.012 共TPSS兲, and 0.003 共Expt.-ZPAE兲. The
WIEN2KSOGGA results of Ref.71are also somewhat differ-ent from the GTO1 results published in Ref.15for 18 solids 共with deviations due to the GAUSSIANbasis set error in the range of −0.021– + 0.035 Å, and mean absolute deviation 0.015 Å兲, but the overall statistics for SOGGA lattice con-stants remains good, close to the PBEsol statistics as we have predicted in this paper.
ACKNOWLEDGMENTS
J.P.P. thanks Fabien Tran for pointing out the errors of the ZPAE calculated from Eq. 共7兲 for C, Si, SiC, and the alkali
halides in Refs. 14 and 38. J.P.P. thanks Levente Vitos for pointing out Ref. 64. J.P.P., A.R., and G.I.C. thank NSF 共Grant No. DMR-0501588兲 and MTA-NSF 共travel grant兲 for support. S.L. acknowledges financial support from ANR PNANO Grant No. ANR-06-NANO-053–02; J.G.A. and S.L. acknowledge financial support from ANR Grant No. ANR-BLAN07-1-186138.
1J. P. Perdew, K. Burke, and M. Ernzerhof, Phys. Rev. Lett. 77, 3865共1996兲.
2W. Kohn and L. J. Sham, Phys. Rev. 140, A1133共1965兲. 3W. Kohn, Rev. Mod. Phys. 71, 1253共1999兲.
4S. Narasimhan and S. de Gironcoli, Phys. Rev. B 65, 064302 共2002兲.
5B. Grabowski, T. Hickel, and J. Neugebauer, Phys. Rev. B 76, 024309共2007兲.
6S. L. Qiu, F. Apostol, and P. M. Marcus, J. Phys.: Condens. Matter 19, 136213共2007兲.
7A. D. Becke, Phys. Rev. A 38, 3098共1988兲.
8S. Kurth and J. P. Perdew, Phys. Rev. B 59, 10461共1999兲. 9S. Kurth, J. P. Perdew, and P. Blaha, Int. J. Quantum Chem. 75,
889共1999兲.
10G. I. Csonka, O. A. Vydrov, G. E. Scuseria, A. Ruzsinszky, and J. P. Perdew, J. Chem. Phys. 126, 244107共2007兲.
11J. Tao, J. P. Perdew, V. N. Staroverov, and G. E. Scuseria, Phys. Rev. Lett. 91, 146401共2003兲.
12G. I. Csonka, A. Ruzsinszky, J. Tao, and J. P. Perdew, Int. J. Quantum Chem. 101, 506共2005兲.
13V. N. Staroverov, G. E. Scuseria, J. Tao, and J. P. Perdew, J. Chem. Phys. 119, 12129共2003兲; 121, 11507 共2004兲.
14J. P. Perdew, A. Ruzsinszky, G. I. Csonka, O. A. Vydrov, G. E. Scuseria, L. A. Constantin, X. Zhou, and K. Burke, Phys. Rev. Lett. 100, 136406共2008兲; 102, 039902共E兲 共2009兲. See also the Supplementary Information.
15Y. Zhao and D. G. Truhlar, J. Chem. Phys. 128, 184109共2008兲. 16Z. Wu and R. E. Cohen, Phys. Rev. B 73, 235116共2006兲. 17W. Kohn and A. E. Mattsson, Phys. Rev. Lett. 81, 3487共1998兲. 18L. Vitos, B. Johansson, J. Kollár, and H. L. Skriver, Phys. Rev. B
62, 10046共2000兲.
19R. Armiento and A. E. Mattsson, Phys. Rev. B 72, 085108
共2005兲.
20J. P. Perdew, L. A. Constantin, E. Sagvolden, and K. Burke, Phys. Rev. Lett. 97, 223002共2006兲.
21G. I. Csonka, A. Ruzsinszky, J. P. Perdew, and S. Grimme, J. Chem. Theory Comput. 4, 888共2008兲.
22M. Ropo, K. Kokko, and L. Vitos, Phys. Rev. B 77, 195445 共2008兲.
23M. P. Johansson, A. Lechtken, D. Schooss, M. M. Kappes, and F. Furche, Phys. Rev. A 77, 053202共2008兲.
24A. Dewaele, M. Torrent, P. Loubeyre, and M. Mezouar, Phys. Rev. B 78, 104102共2008兲.
25I. S. Lim and G. E. Scuseria, Chem. Phys. Lett. 460, 137共2008兲. 26R. Wahl, D. Vogtenhuber, and G. Kresse, Phys. Rev. B 78,
104116共2008兲.
27J. Hafner, J. Comput. Chem. 29, 2044共2008兲.
28L. A. Constantin, J. P. Perdew, and J. M. Pitarke, Phys. Rev. Lett.
101, 016406共2008兲.
29P. J. Feibelman, Phys. Chem. Chem. Phys. 10, 4688共2008兲. 30A. Stroppa and G. Kresse, New J. Phys. 10, 063020共2008兲. 31A. E. Mattsson, R. Armiento, and T. R. Mattsson, Phys. Rev.
Lett. 101, 239701共2008兲.
32J. P. Perdew, A. Ruzsinszky, G. I. Csonka, O. A. Vydrov, G. E. Scuseria, L. A. Constantin, X. Zhou, and K. Burke, Phys. Rev. Lett. 101, 239702共2008兲.
33Y. Zhao and D. G. Truhlar, Phys. Rev. B 78, 197101共2008兲. 34Z. Wu and R. E. Cohen, Phys. Rev. B 78, 197102共2008兲. 35M. J. Frisch, G. W. Trucks, H. B. Schlegel et al., GAUSSIAN03,
Revision D.01共Gaussian, Inc., Wallingford, CT, 2004兲. 36G. te Velde and E. J. Baerends, Phys. Rev. B 44, 7888共1991兲. 37G. Kresse and J. Furthmüller, Comput. Mater. Sci. 6, 15共1996兲. 38V. N. Staroverov, G. E. Scuseria, J. Tao, and J. P. Perdew, Phys.