HAL Id: hal-02189269
https://hal.archives-ouvertes.fr/hal-02189269
Submitted on 19 Jul 2019
HAL is a multi-disciplinary open access
archive for the deposit and dissemination of
sci-entific research documents, whether they are
pub-lished or not. The documents may come from
teaching and research institutions in France or
abroad, or from public or private research centers.
L’archive ouverte pluridisciplinaire HAL, est
destinée au dépôt et à la diffusion de documents
scientifiques de niveau recherche, publiés ou non,
émanant des établissements d’enseignement et de
recherche français ou étrangers, des laboratoires
publics ou privés.
Maxim Neradovskiy, Adriana Scarangella, Aurélie Jullien, Michel Mitov
To cite this version:
Maxim Neradovskiy, Adriana Scarangella, Aurélie Jullien, Michel Mitov. Dispersion of 20 fs pulses
through band edges of cholesteric liquid crystals. Optics Express, Optical Society of America - OSA
Publishing, 2019, 27 (15), pp.21794. �10.1364/OE.27.021794�. �hal-02189269�
Dispersion of 20 fs pulses through band edges
of cholesteric liquid crystals
M
AXIMN
ERADOVSKIY,
1A
DRIANAS
CARANGELLA,
2A
URÉLIEJ
ULLIEN,
1,* ANDM
ICHELM
ITOV2,31Institut de Physique de Nice (InPhyNi), Université Cote d’Azur, CNRS UMR 7010, 1361 route des Lucioles,
06560 Valbonne, France
2Centre d’Elaboration de Matériaux et d’Etudes Structurales (CEMES), CNRS UPR 8011, Université de
Toulouse, 31055 Toulouse, France
3mitov@cemes.fr
*aurelie.jullien@inphyni.cnrs.fr
Abstract: We demonstrate the ability to manipulate ultrashort pulses in cholesteric liquid
crystals in the linear regime. We present an extensive analysis of the spectral changes undergone by 20fs pulses when propagating through band edges of cholesteric liquid crystals. The accurate quantification of the introduced optical dispersion opens the way to controlled stretching and compression of ultrashort pulses. The behaviors of cholesteric liquid crystal films with different thickness, bandgap and structural parameters (monotonic pitch versus pitch-gradient films) are compared. A statistical approach is disclosed to fidelize and deepen the set of experimental investigations.
© 2019 Optical Society of America under the terms of theOSA Open Access Publishing Agreement
1. Introduction
Optical dispersion engineering in a material medium triggers advanced light manipulation capabilities, such as slow and fast light, group delay steering and ultrafast pulse shaping. Some examples of these advanced media include photonic crystals [1], photorefractive crystals [2] or metasurfaces [3, 4]. Photonic structures, in particular, are well-known to enable light group velocity dispersion control in the vicinity of the spectral bandgap [5]. During the last two decades, many efforts have been achieved to engineer photonic crystals or fibers so as to slow light [6] or trigger soliton propagation [7]. Ultrashort pulse shaping applications have also been contemplated, both in the nonlinear [8, 9] and linear [10, 11] optical regime. In the latter case, group velocity changes in the vicinity of the bandgap enable negative or positive chirping of the incoming pulse. However, it appears that the method has been limited to 500fs-1ps pulses and no experimental evidence of shorter pulse (e.g. < 100 f s) linear compression can be found in this regime. The reason might be due to the steepness of the photonic bandgap, not suitable to accommodate wide spectral bandwidths.
Liquid crystals (LCs) are unique advanced optical materials for light manipulation, thanks to their high dispersion and nonlinear coefficients, together with the ability to change their optical properties by acting on molecular structure, material design, temperature or by application an external stimulus like an electric field or a radiation [12, 13]. As a matter of fact, nematic LCs have been successfully used to slow continuous light [14], to phase-shift various optical radiations [15, 16] and to control group delay of femtosecond pulses [17], while dye-doped cholesteric LCs (CLCs) have been demonstrated to produce slow and stored light [18].
Recently, ultrafast laser pulse modulation was demonstrated in CLCs [20–23]. Perspectives opened up by these results are reviewed in [24]. The principle resides in the combination of Kerr nonlinear effect, particularly high in CLCs [25,26], and specific pulse dispersion management. Although both contributions were not really quantified, as a result, significant sub-picosecond and 100fs pulse stretching and compression was obtained. The property exploited here is the
#369319 https://doi.org/10.1364/OE.27.021794 Journal © 2019 Received 5 Jun 2019; revised 4 Jul 2019; accepted 4 Jul 2019; published 18 Jul 2019
Fig. 1. (a) Schematic representation of a cholesteric liquid crystal. p is the helical pitch. (b-d) Cross-sectional views of broadband films: (b) Assembly of open-faced blue and red layers, (c) Broadband film after thermally-induced transverse diffusion between layers, (d) Transmission electron micrograph showing the pitch-gradient [19].
Bragg resonance of the CLC slab due to its chiral molecular organization. Indeed, this mesophase exhibits a helical structure around an axis perpendicular to the local molecular director, with a given pitch and twist sense, as shown in Fig. 1(a). The continuous molecular twist confers to the structure a periodic modulation of the refractive index. As a consequence, light propagating through such a layer in the Bragg regime experiences partial reflection, selective in wavelength and in polarization. This remarkable property makes the CLC close to a 1D photonic structure and gives rise to a smooth bandgap. In the visible part of the spectrum, the bandgap width, directly related to the inherent LC birefringence, typically extends over several tens of nanometers. The characteristics of the Bragg band are then tunable by modulating the CLCs structural parameters: pitch, helicity sense and orientation of the helical axis, as pictured in Fig. 1(a). For instance, CLCs with oblique helicity show wavelength tunable light-shaping properties, recently revealed by hyperspectral imaging [27]. Furthermore, the bandgap can be tuned through temperature changes [28], applied voltage [29] or under the action of an intense optical field [25]. Even more interestingly, the spectral bandgap can be extended, thanks to solutions found in man-made or biological materials as well (this topic is reviewed in [12,30–32]). Then, pitch-gradient CLCs can be synthesized so that the bandgap extends over several hundreds of nanometers, which also induces a smoother slope of the edges, which therefore occurs on a broader set of wavelengths. It has thus appeared that CLCs could be suited to handle ultrashort pulsed laser bandwidth, which remains unexplored so far.
In this study, we aim to address the following questions :
• Are CLCs able to manipulate dispersion of ultrashort (<100 fs) pulses ?
• Can they address negative group delay dispersion (GDD) ? This point is related to the question of temporal compression of femtosecond pulses. In the visible spectral range, common bulk media exhibit positive GDD, and dispersive optical components (prims, gratings...) or dielectric chirped mirrors are needed to achieve negative GDD [33]. • How to quantify the phenomenon ?
the macroscopic dispersion infers with the optical answer ? Can we identify a specific contribution of pitch-gradient CLCs ?
We thus perform in this paper an accurate experimental quantification of the dispersion undergone by femtosecond pulses (20 fs), in the linear regime, when transmitted through the bandgap edges. Three experimental parameters make possible this quantification :
• numerous CLCs, among which pitch-gradient CLCs, were synthesized, so as to tune the relative overlap of bandgap edge and laser spectrum
• a femtosecond source enables to perform broadband spectral interferometry
• a statistical approach is developed to characterize the macroscopic optical properties of samples.
2. Experimental methods
2.1. Samples elaboration and characterization
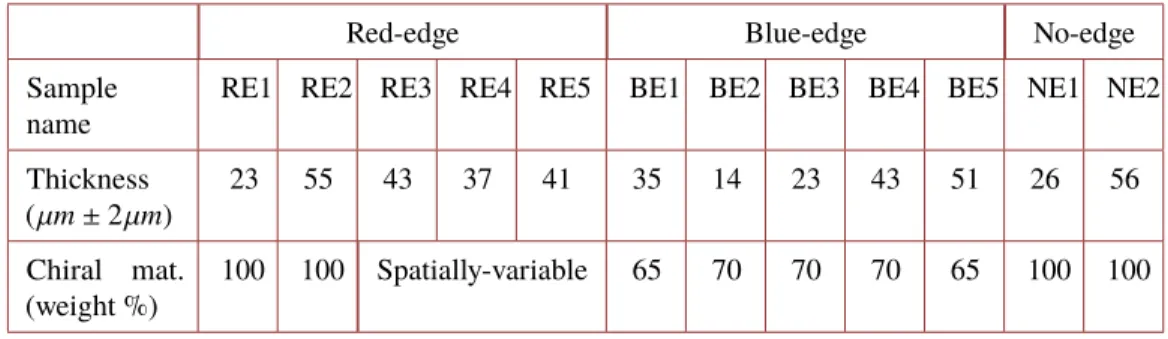
The choice of materials and preparation conditions of samples was motivated by the following requirements: (i) overlapping the Bragg band with the laser spectrum; (ii) tuning the position of short- and long-wavelength edges of the band over the laser spectrum with the help of a single parameter (concentration or temperature during film preparation process); (iii) generating different slopes for both edges. In total, twelve left-handed samples were prepared (Tab. 2.1), with different bandgap characteristics and thicknesses. Short-wavelength edge is referred to blue edge (samples BE1 to BE5) and long-wavelength edge is referred to red-edge (samples RE1 to RE5). Two additional samples with a bandgap that does not overlap the laser spectrum (NE1, NE2) serve as reference samples.
Table 1. List of Samples with Film Thickness and Percentage in Chiral Material.
Red-edge Blue-edge No-edge Sample
name RE1 RE2 RE3 RE4 RE5 BE1 BE2 BE3 BE4 BE5 NE1 NE2 Thickness
(µm ± 2µm) 23 55 43 37 41 35 14 23 43 51 26 56 Chiral mat.
(weight %) 100 100 Spatially-variable 65 70 70 70 65 100 100
Materials. Polysiloxanes form a group of materials of unusual properties which may include
high thermal stability, low-surface energy and low glass-transition temperature [34]. LC polysiloxane oligomers from Wacker Chemie GmbH were here used [35]. The extraordinary (resp. ordinary) refractive index is 1.6 (resp. 1.4) [36]. Hence the birefringence is equal to 0.2, which value is not particularly high for CLCs (most of CLCs have a birefringence slightly less than 0.3 in the visible spectrum [37]). The molecule consists of a siloxane cyclic chain to which two types of side chains are attached via aliphatic spacers: an achiral mesogen and a chiral cholesterol-bearing mesogen. The helical structure is left-handed. The helical pitch and therefore the reflection wavelength depend on the molar percentage of chiral mesogens in the molecule. Via chemical engineering, different percentages give access to different films with a reflection colour ranging from blue to red. At this set of chiral oligomers adds a nematic oligomer, Silicon Nematic
(SN), only bearing achiral mesogens. The LC phase appears between 180-210◦C (clearing
temperature range) and 40-50◦C (glass-transition temperature range). Independent chiral and
nematic mesogens chemically bonded to a volume-excluding core prevents crystallization from the glassy state [38]. So internal structure and morphology of LC film are frozen into a glassy solid state by simple quenching on a metal plate after annealing. Advantageously, the optical film can be studied at room temperature (RT).
Narrow-band films (RE1, RE2, BE1-BE5, NE1, NE2). Mixing a CLC with a nematic LC,
subject to miscibility, allows adjusting the reflection wavelength by adjusting the concentration [39–42]. For RE1, RE2 and BE1 to BE5 samples, we chose to mix Silicon Red (SR) compound (whose the central reflection wavelength is 710 nm) with SN, and to adjust the concentration to fulfil the requirements (i) and (ii) (e.g.: agreement with the laser spectrum plus on-demand location of blue-edge or red-edge inside this spectrum). Relative concentration in SR is given for each sample in Tab. 2.1. For NE1 and NE2 samples, Silicon Green (SG) compound (whose the central reflection wavelength is 540 nm) was used. Films were confined between two glass substrates (1 mm-thick plates). Surface treatment or alignment layers are not required to get clear-cut reflective films after annealing and proper shearing of the cholesteric slab sandwiched between clean and transparent substrates. Substrates were separated by spacers to control the thickness of the film. Changing thickness involves changing confinement ratio (thickness over pitch ratio) and, in return, the number of helix turns per length unit. Requirement (iii) (access to different slopes for blue- or red-edge) may be fulfilled via thickness. It is not possible to predict the correspondence between the thickness to choose and the targeted slope. Correspondence was found afterwards, by noting the profile of the Bragg band. The samples were kept in the cholesteric phase at 120◦C for 10 minutes before quenching. After quenching, the cholesteric
film changed from a viscous to a glassy solid state in which the helical structure is fixed at RT.
Broadband films (RE3 to RE5). For the fabrication of pitch-gradient films leading to broad
bandgaps, we chose to control with temperature the anisotropic diffusion between two individual oligomer films with reflection colours at the extremities of the targeted bandgap. Fabrication procedure was described in details in [19,43]. We adapted it to the requirements of the present study. Main steps are as follows: (i) Two 40-µm-thick films were knife-coated at 120◦C on two
glass substrates. These open-faced films correspond to Silicon Blue (SB) and Silicon Red. (ii) They were quenched up to RT. (iii) 40-µm-thick spacers were disposed between substrates and this sandwich cell with films facing each other was assembled. (iv) The cell was kept at 85◦C for
a variable time (65, 125 and 95 min. for RE3, RE4 and RE5 respectively). Films interpenetrate in a direction transverse to their surfaces and they spread out in the free space between substrates. The steps (iii) and (iv) are illustrated in Fig. 1(b)-Fig. 1(c). Any inter-diffusion between layers as shown in -Fig. 1(c) is forbidden below the glassy transition temperature here equal to 50◦C.
Spacers serve to set a limit for lateral spreading. Annealing time is chosen to obtain a flat plateau for the Bragg band. It also corresponds to the moment for which the spacers fix the final thickness of the single layer. Consequently to the diffusion between the two films in a direction perpendicular to their surfaces, a concentration gradient in chiral species occurs, which chemical gradient leads to a physical pitch-gradient CLC structure. A transmission electron micrograph is shown in Fig. 1(d). Band gap widths (difference between long- and short-wavelength of the plateau) are equal to 315, 300 and 300 nm for RE3, RE4 and RE5, respectively. It means that a large part of the visible spectrum, from 400 to 750 nm, is reflected (white reflectors). Whether the annealing time is insufficiently long, the bandgap exhibits a set of two peaks assigned to individual films or a bump may be still visible in the transmittance curve at a location between individual curves, which means that the diffusion between layers is not fully achieved [44,45]. Following the evolution of the transmittance over time, decide to prolong or stop the diffusion
process by quenching of the cell is made possible. (v) Finally, the cell was quenched up to RT.
Transmittance. The transmission spectra of the CLCs were measured using a supercontinuum
laser source (Electro VISIR 250, LEUKOS, France), whose spectrum covers 500 nm to 2500 nm. We used long-pass dichroic mirror in order to avoid infrared light above 1.2 µm. An ultra-broadband quarter-wave plate was used to generate left or right-handed circular polarization. Transmission spectra of samples for left-handed-polarized incident light are shown in Fig. 2. As a planar cholesteric texture reflects light with the same circular polarization handedness as the twist sense of the helix, only one circular polarization is totally reflected. The other is transmitted. This constitutes the polarization-selectivity rule (which is valid only at normal incidence) [46]. The laser spectrum is located at the shorter-wavelength (resp. longer-wavelength) band-edge for the RE-group (resp. BE-group) and away from the bandgap for NE-group samples. One can notice that the spectrum of 26 µm thick NE1 film is flat whereas the spectrum of 56 µm thick NE2 film is not. This is the consequence of the thickness difference: NE2 film exhibits wavelength-dependent scattering in the laser spectrum, far from the Bragg band.
600 700 800 900 0 0.2 0.4 0.6 0.8 1 Wavelength (nm) Transmission RE1 RE2 RE3 RE4 RE5 600 700 800 900 0 0.2 0.4 0.6 0.8 1 Wavelength (nm) Transmission BE1 BE2 BE3 BE4 BE5 600 700 800 900 0 0.2 0.4 0.6 0.8 1 Wavelength (nm) Transmission NE1 NE2
Fig. 2. Transmission spectra the 12 CLC films when the incident light is left-handed circularly polarized. The gray area refers to the laser spectrum.
All samples are well-aligned and exhibit clear-cut bandgaps as evidenced by the transmission spectra. For a given sample, reproducibility of the optical behavior from one region to another gives confidence in the uniformity of the texture alignment for the sample under consideration. Since different samples with different thicknesses were prepared, it is of course expected that the helix orientation (perpendicular versus tilted) varies from one sample to another one. It is expected that light scattering appears when the thickness is increased. This situation has to be correlated to the texture transition from a monodomain texture to a polydomain one. It can be indirectly visualized in the transmission spectra with the help of the mean level of transmittance.
Figure 3 summarizes the microscopic views in transmission of all the samples, in presence of a long-pass filter with a cutoff wavelength equal to 700 nm since wavelengths below are not concerned with the current optical characterization. Textures exhibit an acceptable level of defects (e.g. oily streaks) which do not significantly alter the bandgap profile.
2.2. Optical setup
The spectral phase plays a central role in determining the temporal shape of a short pulse [47]. Expanding the spectral phase as a Taylor series is therefore a convenient tool to compare different materials and their respective influence on the temporal profile. The phase φ(ω) is usually written as : φ(ω) =k=nÕ k=0 φ(k) k! (ω − ω0) k (1)
Fig. 3. Optical textures of samples in transmission mode, with unpolarized white light and a long-pass filter (cutoff wavelength: 700nm). Bar scale is 20µm.
where ω0is the central frequency of the pulse. The first four terms are well-known and respectively
refer to : the carrier-to-envelope phase (φ(0)), the group delay (φ(1)), the chirp or group delay
dispersion (GDD, φ(2)), and third-order dispersion (TOD, φ(3)).
Addressing φ(0)and φ(1)with nematic LC layers was covered in [17]. In the present study, we
focus on φ(2)and φ(3), as these terms respectively manage the temporal width of the wave-packet
and its quality, e.g. TOD being responsible for satellite pulses.
The experiment is set up as shown in Fig. 4. The laser system is a Femtofiber PRO IRS (Toptica Photonics) oscillator delivering 40 fs pulses, with infrared spectrum and 200 mW average power. The repetition rate is 80 MHz. The pulses are frequency-doubled in a 0.25 mm BBO crystal to produce about 20 fs pulses, with a spectral bandwidth covering 720nm-840nm and exhibiting a Gaussian distribution. The polarization state is horizontal and the beam diameter is limited to 1mm (average power density < 0.1 W/cm2). The laser then seeds a Mach-Zehnder interferometer
composed of a reference arm and a sample arm, with slightly different optical paths. The sample arm includes a quarter-wave plate so as to change the laser polarization to circular (left-handed or right-handed) before it propagates through the sample. The CLC sample is mounted on xy translation stages, in order to investigate the optical response of different area and to discriminate the CLC and substrate respective contributions by enabling propagation through the substrate only. The angle of incidence is kept normal. No influence of the sample direction (blue-red or red-blue) for pitch-gradient CLCs was highlighted in the results presented in the following sections. Then a thin film polarizer enables to recover the initial linear horizontal polarization direction, to minimize phase distortions induced by the combining beam splitter. The reference arm only includes a neutral density filter to balance respective energy on the two optical paths. At the output of the interferometer, the two sub-pulses are arbitrarily delayed, the delay value is manually adjusted to 1500fs in order to optimize the subsequent analysis. The two replicas finally interfere in a spectrometer (Avantes, 0.3nm resolution).
The spectrogram is then analyzed with Fourier Transform Spectral Interferometry methods (FTSI, [48]). The signal can be written as :
I(ω, τ) = I0(ω) + Is(ω) + 2
p
Fig. 4. Experimental setup : Mach-Zehnder interferometer for spectral interferometry (BS : beam splitter, λ/4: quarter-wave plate, ND : neutral density, DL : delay line, TFP : thin film polarizer). τ is the group delay between two output replica. Inset: illustration of the Fourier processing of the interference spectrum (FTSI), filtering of the FFT signal before inverse FFT is pictured in red.
where I0(ω) (resp. Is(ω)) refers to the spectral intensity of reference arm (resp. sample arm), τ
is the interferometer group delay and ∆φ(ω) is the relative spectral phase between both arms. ∆φ(ω) contains the spectral phase introduced by the sample. The inset in Fig. 4 illustrates the numerical treatment to recover this quantity: a fast Fourier Transform (FFT) of the spectral interferogram is performed, followed by temporal filtering of the delayed harmonic. Inverse FFT then enables to get ∆φ(ω) and Is(ω), the relative spectral phase and intensity of the pulse
transmitted through the substrate. The outputs of the calculations are :
• τ enables to monitor group delay changes when propagating through the CLC.
• ∆φ(ω) sums all the phase difference between the two arms of the interferometer. The spectral phase change introduced by the CLC only, referred as ∆φC LC(ω) can be calculated
as the difference between the spectral phase measured when the pulse propagates through the substrate and CLC, and when the pulse propagates through the substrate only. • Is(ω) provides a quantification of the relative overlap of bandgap edge and laser spectrum,
as explained below.
A convenient way to compare the CLCs is to quantify the overlap of bandgap and laser spectrum. The overlap addresses both the bandgap edge position and slope. To do so, we will consider in the following the spectral center of mass, or central wavelength, of the laser spectra, defined as : λ0 = ∫ λI(λ)dλ ∫ I(λ)dλ (3)
We monitor its change when propagating through the films: through bandgap edges, the transmitted spectral distribution is reshaped and the central wavelength is shifted. This shift is calculated as :
∆λC LC
0 = λC LC0 −< λsubstr ate0 > (4)
λC LC
0 is the central wavelength of the transmitted spectrum when the pulse propagates through the
CLC. < λsubstr ate
0 > is the mean value of the central wavelength of the reference spectrum, that
samples, the spectral transmission is higher for long-wavelengths, λC LC
0 is then red-shifted
compared to < λsubstr ate
0 > and ∆λC LC0 is positive. Symmetrically, ∆λC LC0 is negative for
blue-edged samples. In both cases, a larger overlap between the bandgap and the laser spectrum tends to increase the spectral shift and the absolute value of ∆λC LC
0 . 3. Results and discussion
3.1. Eigen modes
We first want to characterize the propagation of the two eigen modes of the Bragg structure, e.g. left-handed and right-handed circular polarizations (CPland CPr modes). To do so, for
all samples, we collected the interference spectra when the sample is moved along x direction, as defined in sample geometry in Fig. 4. We then analyze the difference in transmitted spectral amplitude and phase when the pulse propagates through the substrate only and when it propagates through the substrate plus CLC. We collected 10-20 data points for the two modes along a x line going through the sample center. 10 spectrograms were collected for each point. Resulting group delay, GDD and central wavelength are shown for red-edged RE2 and blue-edged BE4. The results are plotted in Fig. 5.
The increase of group delay, as shown in Fig. 5(a, b) ∆τ, in CLC area for both modes and both samples comes from the longer optical path. ∆τ versus x presents the same evolution for the two modes, indicating that group delay changes originate from local thickness variation across the sample area. ∆τ can be written as ∆τ = (nC LC− nair)dc, with d the sample thickness, c
the speed of light in vacuum, nC LC and nair the group refractive indices of the CLC and air
respectively. As nC LCis higher than nair, the group delay always increases when going through
the CLC. This measurement enables to check the local CLC thickness. One can notice the slight group delay difference between the two modes, originating from the anisotropy of the CLC [49].
The central wavelength of the transmitted pulse, plotted in Fig. 5(c)-Fig. 5(d), underlines that only one mode is affected by the Bragg structure. While it remains unchanged for CPr, CPl
central wavelength is red-shifted with RE2 and blue-shifted with BE4 by several nanometers. One can note a < 1nm difference between central wavelength of CPrand CPlmodes for substrate
only (x < 5mm). This is attributed to a slight drift of laser properties during the acquisition scan. The GDD is then shown. The GDD value for substrate only is an offset originating from different optical dispersion between the two arms of the interferometer. Then, for both samples, only the CPl mode undergoes significant modifications. This indicates that the Bragg-like
structure is responsible for this change. Moreover, the sign of the GDD introduced by the CLC depends on the bandgap position : it is increased for RE2, while decreased for BE4. This confirms the photonic nature of the CLC, as photonic crystals or fibers are known to present normal dispersion on the red-edge and anomalous dispersion on the blue-edge of the bandgap [8]. One can then intuit that the vicinity of the bandgap will affect together the sign and the chirp value undergone by the propagating pulse for one eigen mode.
Nevertheless, we observe a significant spreading of the GDD values for both samples in the CLC area, higher than the error bar for a single position. Another obtained characteristic is the standard deviation of calculated parameters. Considering Fig. 5e, its value is constant for both modes in substrate area, but it is doubled for CLC area, only for CPlmode. This increase can be
attributed to CLC dispersion on a sub-mm level, as expected from a polydomain texture. To conclude this part, we have identified some trends for the different contributions of the two eigen modes. For CPllight and relative to the substrate, the GDD and central wavelength
decrease for blue-edged CLCs, and, on the opposite, they increase for red-edged ones, and remain unchanged for CLCs with no bandgap overlap with the laser spectrum (see appendix). Reflection modes are expected to be symmetric to transmission modes, however, because of the dispersion of the optical response of the samples, we prefer to focus only on transmission modes for this
1375 1400 1425 1450 1475 1500 1525 1550 x (mm) Group delay, fs 0 5 10 15 150 200 250 300 350 GDD, fs 2 764 768 772 776 Central wavelength, nm
λ
λ
RE2 CPl CPr 1450 1470 1490 1510 1530 1550 1570 x (mm) Group delay, fs 0 5 10 15 20 25 70 80 90 100 110 120 GDD, fs 2 762 764 766 768 770 Central wavelength, nm BE4 CPl CPr (a) (b) (c) (d) (e) (f)Fig. 5. Group delay, central wavelength and GDD of pulses transmitted trough red-edged RE2 (a, c, e) and blue-edged BE4 (b, d, f) samples, as a function of x. The figure presents mean values (dots) and standard deviation (error bars). The hatched areas refer to the substrate only. CPl and CPr modes are plotted with filled black and orange diamonds,
respectively. The arrows indicate the sign of the change of GDD between substrate only and substrate and CLC, for CPlmode. The top inserts illustrate the overlap between bandgap
study. Anyway, this dispersion requires to improve the statistics of the detection method to get quantitative conclusions. This is done in the next section.
3.2. Data acquisition : a statistical approach
In order to quantify the optical homogeneity of the samples, we collect spectrograms for 1000 -2500 points. During the acquisition process, the sample is continuously moved in both x and ydirections. The edges of the LC layer are avoided. Spectrum acquisition is performed for a distance of 0.25mm between adjacent points. Given the conclusions of the former section, only the CPlmode is considered. The FTSI technique described above is applied to all spectrograms,
providing group delay, GDD, TOD and central wavelength of the transmitted pulse. Since the group delay is always higher for CLC, this parameter is used to split collected data into two groups: CLC and substrate only. For substrate only, group delay, GDD, TOD, and central wavelength present a normal Gaussian distribution, from which mean and standard deviation can be easily extracted. In the following, group delay, central wavelength and group delay dispersion values must be understood as relative values (by removing the response of the substrate). CLC thickness in each acquisition point is calculated as:
diC LC =c · (τ
C LC
i −< τsubstr ate >)
nC LC− nair (5)
where τC LC
i is the group delay in point i, < τsubstr ate> the mean group delay in the substrate.
Given that no group index measurement is provided in the literature for the CLC, we used nLC=
1.5 and nair = 1. Thickness calibration with the CPr mode, insensitive to the bandgap, would be
more accurate, however this was not possible in the current experiment. The CLC spectral phase coefficients, φ(2),CLC
i , φ
(3),CLC
i , are then normalized relatively to the sample thickness :
φ(2),CLC i = φ(2) i −< φ (2),substrate i > dC LCi φ(3),CLC i = φ(3) i −< φ (3),substrate i > dC LCi (6)
Finally, the central wavelength shift ∆λC LC
0i in point i is calculated as:
∆λC LC
0i = λ0i−< λsubstr ate0 > (7)
All these parameters give access to the dispersion introduced by the CLC (φ(2),CLC, φ(3),CLC),
as a function of the relative position of laser spectrum and Bragg bandgap (∆λC LC 0 ).
In order to organize our data and determine existence and distribution of several different optical answers in each sample, data clustering is performed. Clustering consists in gathering a set of data, here GV DC LC
i (Group Velocity Dispersion) versus ∆λ C LC
0i , in such a way that data
in the same cluster share a statistical distribution. We used distribution-based cluster analysis, which can resolve combination of several normally distributed clusters [50]. The output of the calculation is the solution with the minimum number of clusters.
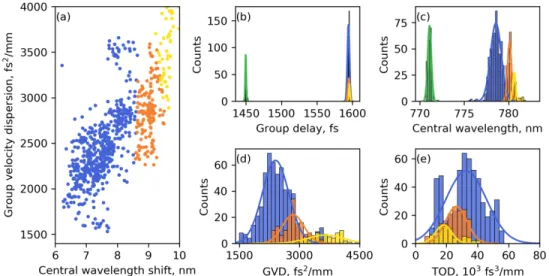
As an illustration, the result of the process for RE2 shows the existence of three clusters, as pictured in Fig. 6(a). We calculate mean values < φ(2),CLC >
j, < φ(3),CLC>j, and < ∆λC LC0 >j
and their standard deviations for each cluster j as fitting coefficients of relevant histogram distribution by normal Gaussian distribution. Results are shown in Fig. 6. As indicated by the group delay, the thickness of the CLC film is constant and the three cluster histograms are superimposed, with unequal contribution in terms of counts. Nevertheless, the three identified clusters correspond to slightly different transmission spectra and different dispersions. The more
Fig. 6. Cluster analysis for RE2. (a) Introduced GVD as a function of ∆λC LC
0i for all the
collected data points. The different colors indicate the three determined clusters. (b,c,d,e) Group delay, central wavelength, GVD, and TOD for RE2 sample: green histogram refers to the substrate only, blue, orange and yellow histograms refer to the three CLC clusters.
shifted the spectrum is, the higher the introduced GVD is. As the result of the cluster analysis, BE1, BE2, BE4, NE1, RE3, RE5 samples present one cluster. Two clusters were identified for RE4, three for BE3 and NE2, and four for RE1.
The existence of these clusters is not clearly understood at this time and no similar analysis is found in the literature. Nevertheless, the present statistical approach is in itself an interesting tool for macroscopic analysis of the material. We have established that these clusters do not correspond to different spatial zones of the sample and do not originate from local thickness variation either. These clusters are supposed to come from the macroscopic dispersion of the CLC, related to fluctuations of the helical axis orientation in thick-film regime. Although this is not the subject of the current study, this original analysis undoubtedly represents a statistical means of improving samples characterization. In the present case, collecting and analyzing a large amount of data proved to be essential for establishing with confidence a mean value and a standard deviation of the dispersion introduced for each group of each sample.
3.3. Whole set of results and illustration
The final results, gathering GVD and TOD introduced by each cluster of each sample, as a function of the central wavelength shift, are shown in Fig. 7. Several conclusions emanate from these plots. At first, CLC films of the present study can be used to positively or negatively chirp femtosecond pulses, in relation to the relative position of the bandgap. They thus enable stretching and compressing of femtosecond pulses. Second, the GVD absolute value increases rapidly when the laser spectrum approaches the bandgap. The maximum measured GVD is 4000 f s2/mm, more than one order of magnitude higher than dispersive glasses or nematic LCs in
this wavelength range [51]. Third, amount of TOD is important as well and cannot be neglected. In [22], where stretching and subsequent compressing of 100fs pulses in two cascaded CLCs was demonstrated, the temporal pedestal of the final output pulse is likely to be explained by this uncontrolled and high TOD. The amount of TOD might be reduced by the use of gradient-pitch CLCs. Finally, for NE1 and NE2 samples, the dispersion is slightly positive, and corresponds to
Fig. 7. (a) GVD and (b) TOD as a function of the wavelength shift of the transmitted pulse spectrum. The colors refer to different samples. Several points with the same color refer to the different clusters of one sample. Note the break in the y scale for graph (b).
the natural dispersion of the LC, without any influence of the Bragg structure. One can notice that for similar wavelength detuning from the band gap, the GVD at the blue edge is in general smaller than that at the red edge. This asymmetry is not explained at this stage. The studied optical behavior of pitch-gradient CLCs is in good agreement with narrow-bands samples. Nevertheless, the number of clusters and the standard deviation is found smaller in the case of pitch-gradient CLCs. This may be explained by a better structural homogeneity or by the smoother bandgap edge and the absence of structural discontinuity, that would minimize the optical phase noise.
7000 750 800 850 0.2 0.4 0.6 0.8 1 0 5 10 15 Wavelength (nm) Spectral intensity
Spectral phase (rad.)
700 750 800 850 0 0.2 0.4 0.6 0.8 1 0 5 10 15 Wavelength (nm) Spectral intensity
Spectral phase (rad.)
700 750 800 850 0 0.2 0.4 0.6 0.8 1 0 5 10 15 Wavelength (nm) Spectral intensity
Spectral phase (rad.)
INPUT PULSE OUTPUT PULSE (BE1) OUTPUT PULSE (RE1)
λ λ
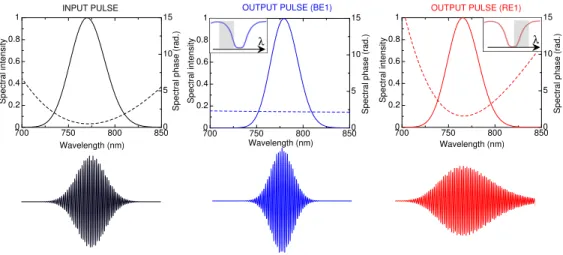
Fig. 8. Calculated spectral amplitude and phase of a chirped 20fs Fourier Transform limited input pulse (black), after propagation through BE1-type sample (blue), and after propagation through a RE1-type sample (red), both with 100µm thickness. Below : temporal electric field amplitude. The insert illustrates the overlap between bandgap and laser spectrum.
To illustrate our point, Fig. 8 shows the spectro-temporal evolution of a femtosecond pulse computed after our experimental measurements. An input pulse, with 20 fs Fourier-Transform limited duration and an arbitrary positive chirp, propagates through a 100 µm-thick CLC samples. The spectral transmittance and phase of samples with BE1 and RE1 characteristics are considered. In both cases, the transmitted spectrum is slightly narrower because of the vicinity of the bandgap. For BE1-type sample, the input positive chirp is compensated and the output pulse is shorter. For RE1-type sample, the chirp is increased and one can note the strong temporal asymmetry of the electric field, originating from the large TOD. Sub-100fs femtosecond pulse shaping thus is possible with these organic and anisotropic media. Nevertheless, the accurate characterization of the sample and TOD compensation are required.
4. Conclusions
The outputs of the present study can be summarized as follows. First, smoothness of the bandgap slopes of CLC samples enables to tune the dispersion of femtosecond pulses within a broad spectrum (20fs). Second, the reversible sign of GVD depends on the relative position of pulse spectrum and bandgap. Blue-edged films introduce negative GVD. Third, the quantity of cubic spectral phase is high and cannot be neglected, but might be reduced by the use of gradient-pitch CLCs. These points trigger new prospects for ultrashort pulse temporal compression with self-organized organic chiral material, especially if the thickness can be increased to the mm-scale [21]. Forthcoming studies could focus on the role of temperature as a parameter to tune in
situthe bandgap characteristics. Other perspectives include the study of the dispersion undergone
edges. This study is also the starting point for an in-depth comparison of the monotonic and pitch-gradient CLC optical responses. In particular, the correlation between the pitch profile as extracted from transmission electron microscopy images of cross-sections and the characteristics of the optical behavior could be the topic of forthcoming investigations. Finally, a statistical approach was proposed for the first time to the optical characterization of CLCs. Here, collecting and analyzing a large amount of data proved to be essential for establishing with confidence a mean value and a standard deviation of the introduced optical dispersion. Further analysis, as for instance with hyperspectral imaging, could be applied in the future to reveal more details about CLC film or any other complex medium.
Appendix
Figures 9, 10 and 11 show the cluster analysis results for RE5, BE3, and NE1.
Fig. 9. Cluster analysis for RE5. (a) GVD as a function of wavelength shift for all the collected data points. One cluster is found. (b,c,d,e) Group delay, central wavelength, GVD, and TOD: green histogram refers to the substrate only, blue histogram refers to the CLC cluster.
Fig. 10. Cluster analysis for BE3. (a) GVD as a function of wavelength shift for all the collected data points. The different colors indicate the three determined clusters. (b,c,d,e) Group delay, central wavelength, GVD, and TOD: green histogram refers to the substrate only, blue, orange and yellow histograms refer to the three CLC clusters.
Fig. 11. NE1 cluster analysis. (a) GVD as a function of wavelength shift for all the collected data points. One cluster is found. (b,c,d,e) Group delay, central wavelength, GVD, and TOD: green histogram refers to the substrate only, blue histogram refers to the CLC cluster.
Funding
Agence Nationale de la Recherche (COLEOPTIX, grant ANR-17-CE30-0025).
Acknowledgments
The authors acknowledge Dr E. Hanelt from Wacker-Chemie GmbH (Munich, Germany) for providing the oligomers.
References
1. T. Baba, “Slow light in photonic crystals,” Nat. Phot. 2, 465 (2008).
2. A. Shumelyuk, K. Shcherbin, and K. Buse, “Slowing down of light in photorefractive crystals with beam intensity coupling reduced to zero,” Phys. Rev. Lett. 93, 243604 (2004).
3. C. Lu, X. Hu, and Q. Gong, “An actively ultrafast tunable giant slow-light effect in ultrathin nonlinear metasurfaces,” Light. Sci. App. 4, e302 (2015).
4. E. Rahimi and K. Sendur, “Thermally controlled femtosecond pulse shaping using metasurface based optical filters,” Nanophotonics 7, 659 (2018).
5. H. G. Winful, “Pulse compression in optical fiber filters,” Appl. Phys. Lett. 46, 527 (1985).
6. C. Monat and B. J. Eggleton, “Slow light enhanced nonlinear optics in periodic structures,” Journ. Opt. 12, 104003 (2010).
7. J. M. Dudley and J. R. Taylor, “Ten years of nonlinear optics in photonic crystal fibre,” Nat. Phot. 3, 85 (2009). 8. B. J. Eggleton and R. E. Slusher, “Bragg grating solitons,” Phys. Rev. Lett. 76, 1627 (1996).
9. N. Koroteev, S. Magnitskii, A. Tarasishin, and A. Zheltikov, “Compression of ultrashort light pulses in photonic crystals: when envelopes cease to be slow,” Opt. Commun. 159, 191 (1999).
10. A. V. Andreev, A. V. Balakin, and D. Boucher, “Compression of femtosecond laser pulses in thin one-dimensional photonic crystals,” Phys. Rev. E 63, 016602 (2000).
11. R. Shiri, A. Bananej, and E. Safari, “Compression of ultra-short light pulses using the graded refractive index one-dimensional photonic crystals,” Opt. Commun. 375, 23 (2016).
12. J. Sun, W. Zhang, and H. Yang, in Liquid Crystal Sensors, (Taylor and Francis, 2018). 13. I. Khoo, in Physical Properties and Nonlinear Optical Phenomena, (Wiley, 1995).
14. S. Residori, U. Bortolozzo, and J. P. Huignard, “Slow and fast light in liquid crystal light valves,” Phys. Rev. Lett.
100, 203603 (2008).
15. T. Kuki, H. Fujikake, T. Nomoto, and Y. Utsumi, “Design of a microwave variable delay line using liquid crystal, and a study of its insertion loss,” Electron. Commun. Jpn. 85, 90 (2002).
16. C.-S. Yang, T.-T. Tang, P.-H. Chen, R.-P. Pan, P. Yu, and C.-L. Pan, “Voltage-controlled liquid-crystal terahertz phase shifter with indium-tin-oxide nanowhiskers as transparent electrodes,” Opt. Lett. 39, 2511–2513 (2014).
17. A. Jullien, U. Bortolozzo, S. Grabielle, J.-P. Huignard, N. Forget, and S. Residori, “Continuously tunable femtosecond delay-line based on liquid crystal cells,” Opt. Express 24, 14483–14493 (2016).
18. D. Wei, U. Bortolozzo, J. P. Huignard, and S. Residori, “Slow and stored light by photo-isomerization induced transparency in dye doped chiral nematics,” Opt. Express 21, 19544–19554 (2013).
19. A. Boudet, C. Binet, M. Mitov, C. Bourgerette, and E. Boucher, “Microstructure of variable pitch cholesteric films and its relationship with the optical properties,” Eur. Phys. J. E 2, 247 (2000).
20. L. Song, S. Fu, Y. Liu, J. Zhou, V. G. Chigrinov, and I. C. Khoo, “Direct femtosecond pulse compression with miniature-sized bragg cholesteric liquid crystal,” Opt. Lett. 38, 5040–5042 (2013).
21. Y. Liu, Y. Wu, C.-W. Chen, J. Zhou, T.-H. Lin, and I. C. Khoo, “Ultrafast pulse compression, stretching-and-recompression using cholesteric liquid crystals,” Opt. Express 24, 10458–10465 (2016).
22. Y. Liu, H. Liang, C.-W. Chen, X. Xie, W. Hu, P. Chen, J. Wen, J. Zhou, T.-H. Lin, and I. C. Khoo, “Ultrafast switching of optical singularity eigenstates with compact integrable liquid crystal structures,” Opt. Express 26, 28818–28826 (2018).
23. C.-W. Chen, X. Guo, X. Ni, T.-H. Lin, and I. C. Khoo, “Slowing sub-picosecond laser pulses with 0.55 mm-thick cholesteric liquid crystal,” Opt. Mater. Express 7, 2005–2011 (2017).
24. I. C. Khoo, “Cholesteric and blue-phase liquid photonic crystals for nonlinear optics and ultrafast laser pulse modulations,” Liq. crsytals reviews 6, 53 (2018).
25. J. Hwang, N. Y. Ha, H. J. Chang, B. Park, and J. W. Wu, “Enhanced optical nonlinearity near the photonic bandgap edges of a cholesteric liquid crystal,” Opt. Lett. 29, 2644–2646 (2004).
26. I. C. Khoo, “Nonlinear optics of liquid crystalline materials,” Phys. Reports 471, 221 – 267 (2009).
27. A. Jullien, A. Scarangella, U. Bortolozzo, S. Residori, and M. Mitov, “Nanoscale hyperspectral imaging of tilted cholesteric liquid crystal structures,” Soft Matter 15, 3256–3263 (2019).
28. Y.-G. Fuh, S.-J. Ho, S.-T. Wu, and M.-S. Li, “Optical filter with tunable wavelength and bandwidth based on phototunable cholesteric liquid crystals,” Appl. Opt. 53, 1658–1662 (2014).
29. J. Xiang, S. V. Shiyanovskii, C. Imrie, and O. D. Lavrentovich, “Electrooptic response of chiral nematic liquid crystals with oblique helicoidal director,” Phys. Rev. Lett. 112, 217801 (2014).
30. M. Mitov, “Cholesteric liquid crystals with a broad light reflection band,” Adv. Mater. 24, 6260–6276 (2012). 31. Y. Zhang, Y. Z. Gao, and H. Yang, “Research progress of cholesteric liquid crystals with broadband reflection
characteristics in application of intelligent optical modulation materials,” Chin. Phys. B 25, 096101 (2016). 32. R. Balamurugan and J.-H. Liu, “A review of the fabrication of photonic band gap materials based on cholesteric
liquid crystals,” React. Funct. Polym. 105, 9 (2016).
33. M. Muller, J. Squier, and G. J. Brakenhoff, “Dispersion pre-compensation of 15 femtosecond optical pulses for high-numerical-aperture objectives,” J. Microsc. 191 (1997).
34. E. Mark and G. Lin, in The Polysiloxanes, (Oxford University Press, 2015).
35. F.-H. Kreuzer, N. Haberle, and J. Weis, in Organosilicon Chemistry Set, N. Auner and J. Weis, eds. (Wiley-VCH Verlag GmbH, 2005).
36. D. C. Zografopoulos, E. E. Kriezis, M. Mitov, and C. Binet, “Theoretical and experimental optical studies of cholesteric liquid crystal films with thermally induced pitch gradients,” Phys. Rev. E 73, 061701 (2006).
37. Q. Hong and S. T. Wu, “Optical wave propagation in a cholesteric liquid crystal using the finite element method,” Liq. Cryst. 30, 367 (2003).
38. H. Chen, H. Shi, and T. Tsutsui, “Novel vitrifiable liquid crystals as optical materials,” Adv. Mater. 8, 998 (1996). 39. G. Friedel, in Sur les corps cholestériques, (C. R. Acad. Sci. Fr., 1923).
40. R. Cano, in Etude du pouvoir rotatoire des cristaux-liquides cholestériques, (Bull. Soc. Fr. Min. Crist. XC, 1967). 41. H. Kozawaguchi and M. Wada, “Dependence of helical pitch on composition in mixtures of nematic and cholesteric
liquid-crystals,” Mol. Cryst. Liq. Cryst. 4, 97 (1978).
42. M. Mitov and P. Sixou, “Study of a cholesteric liquid crystal polymer in solution in a low molar weight liquid crystal: phase diagram and electric field effect,” Mol. Cryst. Liq. Cryst. 231, 11 (1993).
43. M. Mitov A. Boudet, and P. Sopena, “From selective to wide-band light reflection: a simple thermal diffusion in a glassy cholesteric liquid crystal,” Eur. Phys. J. B. 8, 327 (1999).
44. C. Binet, M. Mitov, A. Boudet, and A. Boudet, “Bragg reflections in cholesteric liquid crystals: from selectivity to broadening and reciprocally,” Mol. Cryst. Liq. Cryst. 339, 111 (2000).
45. M. Mitov, C. Binet, A. Boudet, and C. Bourgerette, “Glassy cholesteric broadband reflectors with a pitch gradient: material design, optical properties and microstructure,” Mol. Cryst. Liq. Cryst. 358, 209 (2001).
46. P.-G. de Gennes and J. Prost, in The Physics of Liquid Crystals, (Oxford University Press, 1993). 47. A. M. Weiner, “Ultrafast optical pulse shaping: A tutorial review,” Opt. Commun. 184, 3669 (2011).
48. L. Lepetit, G. Chériaux, and M. Joffre, “Linear techniques of phase measurement by femtosecond spectral interferometry for applications in spectroscopy,” J. Opt. Soc. Am. B 12, 2467–2474 (1995).
49. D.-K. Yang and S.-T. Wu, in Fundamentals of Liquid Crystal Devices, (Wiley, 2012).
50. M. J. Lindstrom and D. M. Bates, “Newton-raphson and em algorithms for linear mixed-effects models for repeated-measures data,” J. Am. Stat. Ass. 83, 1014 (1988).