HAL Id: hal-03241830
https://hal.archives-ouvertes.fr/hal-03241830
Submitted on 31 May 2021
HAL is a multi-disciplinary open access archive for the deposit and dissemination of sci-entific research documents, whether they are pub-lished or not. The documents may come from teaching and research institutions in France or abroad, or from public or private research centers.
L’archive ouverte pluridisciplinaire HAL, est destinée au dépôt et à la diffusion de documents scientifiques de niveau recherche, publiés ou non, émanant des établissements d’enseignement et de recherche français ou étrangers, des laboratoires publics ou privés.
Geomagnetic paleosecular variation in the Brunhes
period, from the island of El Hierro (Canary Islands)
Nadia Széréméta, Carlo Laj, Herve Guillou, Catherine Kissel, Alain Mazaud,
Juan-Carlos Carracedo
To cite this version:
Nadia Széréméta, Carlo Laj, Herve Guillou, Catherine Kissel, Alain Mazaud, et al.. Geomagnetic paleosecular variation in the Brunhes period, from the island of El Hierro (Canary Islands). Earth and Planetary Science Letters, Elsevier, 1999, 165 (3-4), pp.241-253. �10.1016/S0012-821X(98)00270-2�. �hal-03241830�
Geomagnetic paleosecular variation in the Brunhes period, from the
island of El Hierro (Canary Islands)
Nadia Sze´re´me´ta
a, Carlo Laj
a,Ł, Herve´ Guillou
a, Catherine Kissel
a, Alain Mazaud
a,
Juan-Carlos Carracedo
baLaboratoire des Sciences du Climat et de l’Environnement, CEA-CNRS, Avenue de la Terrasse, 91198 Gif-sur-Yvette cedex, France bEstacion Volcanologica de Canarias, CSIC, La Laguna, Tenerife, Spain
Received 6 June 1998; revised version received 20 November 1998; accepted 24 November 1998
Abstract
We have sampled a sequence of 69 flows in the island of El Hierro (Canary Islands). 46 of them belong to the El Golfo formation and 23 to the most recent rift formation. Radiometric dating brackets this section between 442 ka and 134 ka with six intermediate datings. All the samples were stepwise demagnetized, partly with alternative field, partly thermally with very similar results. The large majority of the samples are characterized by a single stable component of magnetization. ChRM isolated after the first steps of demagnetization are all of normal polarity. Inclinations are on average shallower than expected from a geocentered dipole field, but consistent with results from other areas at the same latitude. Mean declinations of the rift and El Golfo sequences are both easterly deviated (about 5º and 15º respectively) and significantly different suggesting that the section has undergone a progressive clockwise rotation. VGP scatter and directional scatter calculated for the rift sequence are consistent with available data from other geographical areas, and also with recent models of paleosecular variation. On the other hand, a significantly smaller directional scatter is obtained for the lower El Golfo sequence, suggesting that a period of low secular variation occurred in the Canary Islands area between approximately 440 and 260 ka. 1999 Elsevier Science B.V. All rights reserved.
Keywords: secular variations; magnetic field; absolute age; Canary Islands
1. Introduction
Records of the geomagnetic paleosecular varia-tion provide crucial informavaria-tion for the understand-ing of the mechanisms generatunderstand-ing the geomagnetic field. For this reason, numerous paleomagnetic in-vestigations in the last three decades have addressed this question and have progressively contributed to a wide documentation of the paleosecular variation
ŁCorresponding author. Tel.: C33 (1) 6982 3538; Fax: C33 (1) 6982 3568; E-mail: laj@lsce.cnrs-gif.fr
with increasing precision in time and geographical coverage. Despite this continuous effort, new data are still important, because the time–space cover-age is as yet far from complete. For instance, in a recent publication, Johnson and Constable [1] indi-cate that available data do not allow unambiguous description of important characteristics of the field such as the Northern hemisphere flux lobes in the 0–5 Ma average field. Also, it has progressively ap-peared that some of the early data, obtained with methods that have been since superseded, may not be entirely reliable. For this reason, a recent IAGA
0012-821X/99/$ – see front matter1999 Elsevier Science B.V. All rights reserved. PII: S 0 0 1 2 - 8 2 1 X ( 9 8 ) 0 0 2 7 0 - 2
resolution recommends that attention be given to repeating early studies on important sections using modern methods [2].
Despite the abundance of thick lava sequences with rather high extrusion rates, the Canary Islands have been relatively little studied from a paleomag-netic point of view. Early studies [3–7] were aimed toward understanding of tectonic evolution of the is-lands, rather than documenting the paleosecular vari-ation. Consequently, of the over 350 data obtained from the Canary Island and Madeira, very few have been included in the data base used by Johnson and Constable [8] for the study of paleosecular variation. The most recent paleomagnetic studies in the Canary Islands have addressed the study of the Matuyama– Brunhes transition and the associated changes in the field intensity [9], not specifically paleosecular variation.
Recently, a combined K=Ar and magnetic polarity study of the Island of El Hierro [10], aiming for a better understanding of the island evolution, has also identified a Brunhes epoch volcanic sequence which appeared suitable for a paleosecular variation study with reliable age control. This provided the opportunity to obtain modern data from this rather poorly explored region.
2. Geological setting and sampling
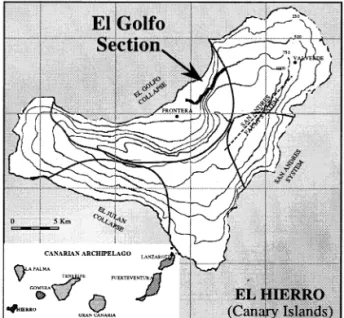
El Hierro is the westernmost and smallest island (280 km2) of the Canary Islands (Fig. 1). It consti-tutes the emerging summit part of a volcanic edifice which lies over a 156 Myr old seafloor at a depth of around 4000 m. The island is thought to reflect the present location of the hotspot [11,12]. The eruptive activity seems to have been nearly continuous from 1.12 Ma (oldest subaerial dated lava) to present, with the eruption of the Lomo Negro volcano in 1793 [13] possibly being the most recent event. Like many other volcanic islands, El Hierro is formed by the competition of consecutive constructive and destruc-tive processes. Two main structural units succeeded in time: The oldest El Tin˜or volcano was active dur-ing the upper part of the Matuyama Chron (between around 1.12 and 0.88 Ma) whereas the El Golfo edifice formed during the Brunhes period (between around 545 and 176 ka) [10]. The growth of
instabil-Fig. 1. Schematic map of El Hierro island indicating the location of the El Golfo section.
ities due to consecutive eruptions, perhaps coupled with magmatic overpressuring and pore fluid pres-surization during dyke emplacements [14], has led to a number of volcano flank failures and conse-quent giant landslides with volumes of up to 1000 km3[15–17]. During the youngest part of the Brun-hes chron, a renewal of volcanic activity occurred through a well developed triple rift system building on top of the previous volcanic edifices of El Tin˜or and El Golfo. Finally, the subsequent erosion of the landslides scars has resulted in the typical trilobate form of this island with its characteristic ‘Mercedes star’ rift system [17] associated with topological ridges at angles of 120º (oriented in NW, NE and S) and large embayments especially in the south-west and north coasts (El Julan and El Golfo embayments respectively).
The sequence investigated in this study is located at the northern end of the El Golfo embayment, north of the town of Frontera, on the El Golfo volcanic edifice (27.8ºN, 18ºW) (Fig. 1). Sampling extended along the Camino de la Pen˜a from an altitude of 295 m up to the top of the section at about 700 m (Fig. 1) and encompassed the Upper El Golfo and the rift activity sequences. Below 295 m, no paleomagnetic samples were collected because the section is covered by piedmont deposits densely intruded by dykes.
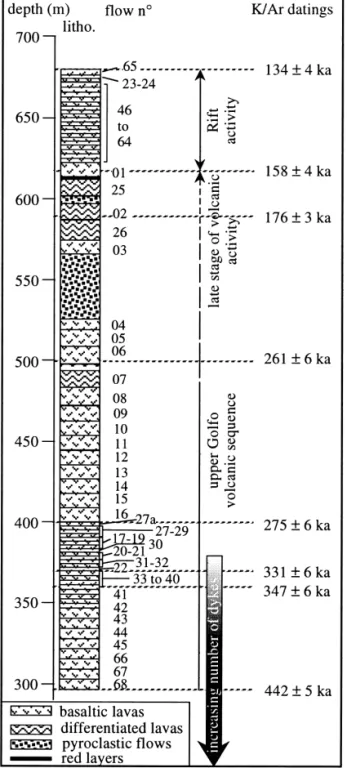
The main part of the sampled section (the Upper El Golfo sequence between 300 and 620 m) is made of thin to medium size basaltic flows progressively changing at the top to more differentiated
(benmor-Fig. 2. Lithological description of the section as a function of altitude. K–Ar datings are also reported.
eites and trachytes) rather thick flows (Fig. 2). The very late stage of activity of the El Golfo volcano is characterized by very thick pyroclastic flows, not sampled for this study, illustrating a change from effusive towards explosive volcanic activity.
A well marked red soil located at the base of flow 01 separates the El Golfo sequence from the overlying recent rift sequence. This last sequence is constituted by an empilement of olivine and pyrox-ene bearing basaltic flows (flows EG01; EG23–24 and 46 to 65). The red soil illustrates that a time interval during which no lava flows were erupted or reached the investigated area is present between the two volcanic sequences.
The flows are usually unambiguously identified by the presence of basal and top scorias, ashes or red lapillus. We have sampled 69 flows which we believe to be consecutive, with the exception of two very thin flows which had obviously been reheated during the emplacement of overlying very thick flows and for this reason were not sampled. A total of 557 cores (7 to 10 cores per flow) were drilled with a portable gasoline-powered drill. For each flow, sampling extended laterally over several meters. From the almost 3-dimensional view offered by the geometry of the El Golfo embayment, it is clear that the general structure is periclinal and that the very shallow north-eastward dip of the El Golfo flows at the sampled section is of volcanic origin. Consequently, no correction was made to reconstruct the paleohorizontal. Each core was oriented in situ using, most often, both magnetic and sun compasses. Comparison of the solar and magnetic readings did not reveal any significant departure from the regional magnetic anomaly (10º in 1980) except for four isolated samples from two different flows. These samples were not considered for the measurements.
3. Laboratory experiments and results 3.1. Radiometric datings
Radiometric datings were obtained using an un-spiked K=Ar technique which has already been de-scribed in the literature [18]. Prior to this paleo-magnetic investigation, four age determinations had already been obtained at different horizons of the
Table 1
Age determinations obtained from the El Golfo section
Sample Height K Weight molten 40Ar 40Ara(ð10 13) Age š2¦ Mean age
(m) (wt%) (g) (%) (moles=g) (ka) CI HI 40 680 0.665 š 0.007 1.56447 1.620 1.521 132 š 6 CI HI 40 680 0.665 š 0.007 2.01858 1.511 1.575 137 š 5 134 š 4 CI HI 01a 650 1.278 š 0.013 1.43927 3.629 3.381 153 š 5 CI HI 01a 650 1.278 š 0.013 2.4962 4.237 3.612 163 š 4 158 š 4 CI HI 02a 585 1.942 š 0.019 2.51798 7.715 6.054 180 š 3 CI HI 02a 585 1.942 š 0.019 2.50376 8.09 5.774 171 š 3 176 š 3 CI HI 03a 505 0.956 š 0.009 1.50191 4.491 4.190 253 š 6 CI HI 03a 505 0.956 š 0.009 2.51768 4.587 4.455 269 š 7 261 š 6 EG 16 400 0.819 š 0.008 1.06324 1.824 3.975 280 š 10 EG 16 400 0.819 š 0.008 1.33956 1.837 3.823 269 š 8 275 š 6 EG 22 370 0.843 š 0.008 1.5258 1.995 4.888 333 š 7 EG 22 370 0.843 š 0.008 1.09345 2.147 4.826 329 š 9 331 š 6 EG 40 360 0.502 š 0.005 2.15037 1.693 3.000 349 š 8 EG 40 360 0.502 š 0.005 1.94898 3.500 3.034 345 š 8 347 š 6 CI HI 04a 295 0.903 š 0.009 1.49525 7.233 6.878 439 š 8 CI HI 04a 295 0.903 š 0.009 2.47259 7.294 6.957 444 š 8 442 š 5
Age calculation are based on the decay and abundance constants from Steiger and Ja¨ger [31].
aindicates determinations published in Ref. [10].
section [10]. Four additional determinations were obtained in this study, at altitudes 360, 370, 400, and 680 m, improving the temporal constraints for the lower part of the section. All the results are reported in Table 1. Two replicate measurements were done for each determination using different amounts of groundmass aliquots. This allows a direct check of the reproducibility of the laboratory measurements. Table 1 also shows that all the determinations are in stratigraphic order, providing evidence for the reliability of the results.
The section formed in an interval of about 300 kyr in the Brunhes period, between 442 š 5 ka (295 m) and 134 š 4 ka (680 m). The average extrusion rate in terms of flows per unit time, was calculated by linear interpolation between the different age de-terminations. In the lower part of the section (from EG68 to EG06) the sampled flows provide a rather regular sampling of the geomagnetic field, with spac-ings oscillating between 1.4, 4.3, 2.0 kyr and close to 10.0 kyr at the very bottom (an average value of 1 flow=4.5 kyr can be estimated). A sharp decrease of the extrusion rate is observed during the last stage of the El Golfo activity, when only 3 basaltic and 3 trachytic flows were emplaced between 261 and 158 ka. The extrusion rate then appears rather high (1 flow=1.1 kyr) for the rift activity sequence. It
may be noted that, in terms of rate of production in volume of the volcanic products, there are no such corresponding large changes [10].
3.2. Rock-magnetic analysis
High field thermomagnetic analyses were made on small amounts of powder using a horizontal Curie balance. Heating and cooling rates were close to 7–8ºC=minute and the maximum temperature ap-proaching 700ºC. Argon was continuously flushed into the measuring cell to limit oxidation of the mag-netic minerals during the experiments. In general, consistent results were observed for samples from the same flow, but some differences were observed along the section.
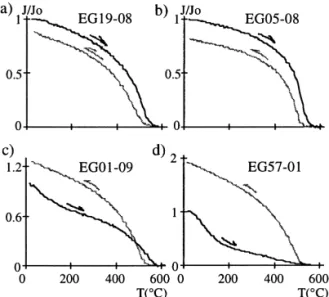
Concave-down curves decreasing to zero with Curie temperatures close to 580ºC (Fig. 3a,b), char-acteristic of low Ti-content magnetites, were gener-ally observed all along the sequence, although more frequently in the El Golfo than in the rift sequence. Curves such as that of Fig. 3c, with one inflection point in the interval of 350–450ºC, a second close to 580ºC, and a cooling curve above the heating curve, are abundant at the top of the section. Finally, curves such as the one in Fig. 3d characterized by a decrease to zero with Curie temperatures in the
Fig. 3. Representative thermomagnetic analyses: (a–b) Similar shape for heating and cooling curves with a Curie temperature close to 580ºC are mainly observed in the lower part of the section; (c–d) irreversible curves with 2 inflection points are mainly observed in the upper part of the section.
250–350ºC range and cooling curve high above the heating one, are also observed in the upper part of the section.
3.3. Demagnetization of the NRM
The remanent magnetization was measured either with a spinner magnetometer (JR5A) or with a 2G 3-axes cryogenic magnetometer in aµ-metal shielded room. NRMs range between 0.3 and 34 A=m with a mean value of 7.9 A=m. Samples from the same flow have very similar NRMs, illustrating intra-flow homogeneity. Stepwise thermal (th) and alternative field (af) demagnetization performed on samples of the same core yielded very similar Characteristic Remanent Magnetizations (ChRM). On average, 4– 5 samples per flow were treated thermally up to 600ºC and the others underwent af demagnetization up to 0.1 T. The steps of the thermal treatment were usually chosen considering the results of the ther-momagnetic analysis. The low field magnetic sus-ceptibility was measured at room temperature after each step of the thermal treatment in order to detect possible heating-induced mineralogical changes. The consistency between the directions obtained from af and thermal demagnetization ensures that the miner-alogical transformations documented in some
sam-Fig. 4. Typical thermal (a, b, c) and af (d) demagnetization diagrams. White and black symbols are for projection onto vertical and horizontal planes respectively.
ples by the thermomagnetic analyses do not sig-nificantly affect the determination of their ChRM. However, for some of the samples characterized by thermomagnetic curves such as that of Fig. 3d, the thermal treatment yielded slightly ‘noisier’ diagrams with Maximum Angle of Deviation (MAD) values of about 4–5º. In these cases af demagnetization yielded more accurate and consistent determinations of the ChRM with MAD values of 1–2º.
A great majority of samples are characterized by a single stable component of magnetization, some-times associated with a small secondary component easily removed after the first demagnetization steps (i.e. 180–240ºC or 10–15 mT). Characteristic ex-amples of demagnetization diagrams are shown in Fig. 4. Principal component analysis was used to determine direction of the ChRM for each sample. Using a Fisher statistic, the mean paleofield direction for each flow was then obtained with an averageÞ95 of 4.6º.
3.4. The paleomagnetic record
The paleomagnetic results are reported in Ta-ble 2 part a, with the usual Fisher statistical pa-rameters. These results are shown in Fig. 5a as inclination=declination records as a function of flow number in the stratigraphic order, and in Fig. 5b as a function of time, where the age assigned to each flow
Table 2
Paleomagnetic results from the El Golfo section
Part a Part b
Flow No. Dec Inc N K Þ95 Lat Long Dec0 Inc0 N0 K0 Þ950
65 342.9 57.3 7 129.4 4.9 72.5 68.2 23 335.8 59.8 9 114.2 4.6 66.2 68.8 24 333.9 59.4 5 274.8 4.1 65.2 71.2 337.8 59.0 21 153.8 2.6 46 8.7 38.5 6 218.3 4.1 80 107.7 8.7 38.5 6 218.3 4.1 47 0.3 41.2 5 340.6 3.7 85.9 158.2 0.3 41.2 5 340.6 3.7 48 11.1 35.3 5 478.9 3.6 76.9 108.8 11.1 35.3 5 478.9 3.6 49 8.2 39.7 2 – – 80.9 105.8 50 8.4 40.3 7 427 2.7 81 102.6 8.3 40.2 9 366.0 2.5 51 0.4 28.4 8 97.2 5.3 77.3 160.1 0.4 28.4 8 97.2 5.3 52 21.2 26.2 7 142.6 5.3 65.8 103 21.2 26.2 7 142.6 5.3 53 352.6 21.8 5 483.6 3.1 72.1 173.6 54 353.7 21.7 9 99 4.9 72.5 177.2 353.3 21.7 14 153.3 3.1 55 359.8 37 6 188.6 4.5 82.8 163.3 359.8 37 6 188.6 4.5 56 12.5 40 5 624.1 2.7 77.7 93.3 12.5 40 5 624.1 2.7 57 19.5 47.2 9 74.4 5.7 72.8 65.6 19.5 47.2 9 74.4 5.7 58 359.9 39.8 6 394.9 3.1 84.8 162.8 359.9 39.8 6 394.9 3.1 59 14.1 19.8 7 128.2 5 68 122.3 14.1 19.8 7 128.2 5 60 13.3 25.2 8 123.3 4.7 70.9 118.8 61 16.9 27 6 738.2 2.5 69.3 109.3 15.0 24.9 14 124.7 3.3 62 359.8 35.8 7 36.7 10.7 82.9 163.4 63 348.7 35.7 9 143.2 4.3 76.9 143.4 353.5 35.9 16 56.1 5.0 64 20.1 24 4 80.3 10.3 65.8 107 20.1 24 4 80.3 10.3 1 26.1 42 6 85.6 7.3 66.3 134.7 26.1 42 6 85.6 7.3 25 349.5 40.9 6 67.4 8.2 79.6 70.5 2 352.6 35.4 8 182.1 4.1 79.3 156.9 26 349 36.8 8 233.1 3.6 77.6 141.7 3 353.3 39.1 9 190.3 3.8 81.7 89.6 351.6 37.8 31 130.9 2.4 4 1.7 31.9 9 249.5 3.3 79.4 159.1 5 356.5 30 8 139.5 4.7 77.9 178.4 359.2 31.0 17 161.2 2.8 6 1.8 24 8 296.3 3.2 74.7 155.4 1.8 24 8 296.3 3.2 7 9.7 31.4 7 624.5 2.4 75.9 120.3 9.7 31.4 7 624.5 2.4 8 3.2 43.9 6 290.2 3.6 86.5 107.8 3.2 43.9 6 290.2 3.6 9 16.3 25.4 4 175.5 6 70.9 105.7 10 13.4 29.2 7 278.6 3.4 72.6 113.8 14.5 27.8 11 229.8 2.9 11 14 36 7 137.3 4.8 75 100.4 12 13.6 28.2 8 128.4 4.6 72 114.5 13 10.8 28.7 8 178.8 3.9 74 121.2 12.2 28.4 16 178.0 2.8 14 4.4 48.3 7 96.6 5.7 85.9 49.2 15 9.9 50.3 8 181.1 3.9 80.8 49.2 7.2 49.3 15 134.0 3.2 16 23.8 39.7 7 103.3 5.5 67.8 80.3 23.8 39.7 7 103.3 5.5 27a 10.5 41.7 4 203 5.6 79.8 91.4 10.5 41.7 4 203 5.6 27 32.5 41.4 10 211.9 3.2 60.6 72.3 32.5 41.4 10 211.9 3.2 28 23.9 36.3 6 212.2 4.2 66.8 86 23.9 36.3 6 212.2 4.2 29 16.8 37.5 7 228.6 3.7 73.3 92.2 16.8 37.5 7 228.6 3.7 17 24.3 35.6 6 144.6 5.1 66.3 86.8 24.3 35.6 6 144.6 5.1 18 16 30.3 7 153.6 4.5 71.3 106.6 16 30.3 7 153.6 4.5 19 19.9 39.3 6 83.8 6.7 71.1 84.7 30 15.9 37.1 8 299.1 3 73.9 94.5 17.5 37.9 14 150.7 3.1 20 27 36.4 6 108.3 5.9 64.3 83.2 27 36.4 6 108.3 5.9 21 12.3 35.2 7 127.7 5 76 106.1 12.3 35.2 7 127.7 5 31 24.8 38.1 12 122 3.8 66.6 82.3 32 22.6 36.8 7 143 4.7 68.2 86.5 23.7 37.7 19 145.0 2.8
Table 2 (continued)
Part a Part b
Flow No. Dec Inc N K Þ95 Lat Long Dec0 Inc0 N0 K0 Þ950
22 9 40.9 11 98.8 4.4 80.8 98.7 33 17.7 41 7 130.6 4.9 73.5 83.2 12.5 41.1 18 109.7 3.3 34 16.1 45.5 5 253.1 4.3 75.7 71.5 35 13.5 47.7 7 259.2 3.5 78.1 64.2 36 9.3 45.4 6 307.2 3.5 81.7 76.2 12.8 46.1 18 266.9 2.1 37 5.5 47 8 90.8 5.5 85.1 65.9 38 0.1 45.3 7 127.2 5 89 156.5 39 4.8 42.7 8 94.8 5.3 84.8 106.4 40 3.5 42.7 9 136.7 4.2 85.6 115.3 3.7 44.3 32 127.5 2.3 41 11.3 39.7 9 201.4 3.4 78.5 96.8 42 11 35.4 8 169 4 77 109 43 13.7 36.8 8 173.4 3.9 75.5 99.4 11.0 37.4 25 160.0 2.3 44 5.3 43.2 5 340 3.7 84.6 99.6 5.3 43.2 5 340 3.7 45 16.9 41.2 7 92.4 5.8 74.2 83.5 16.9 41.2 7 92.4 5.8 66 27.9 32.6 8 165.1 4 62.4 87.4 27.9 32.6 8 165.1 4 67 13.9 38.8 5 118.2 6.3 76.1 94.1 68 16.4 38 6 119.5 5.6 73.8 91.7 15.0 38.5 11 153.9 3.5
Part a: unfiltered data. Part b: filtered data. N; N0: Number of stable directions used for statistical calculation. K , K0,Þ
95,Þ095: parameters
of Fisher’s statistics.
was obtained by linear interpolation between the intermediate radiometric datings as reported above. The marked decrease of the extrusion rate at the end of the El Golfo activity is clearly apparent from Fig. 5b. Consequently the interpolated age for the six undated flows in the interval 261 to 158 kyr is highly speculative (one of the flows in this interval is dated).
As expected from the datings, only normal polar-ities were observed in this record, but the average paleomagnetic directions calculated separately for the El Golfo and rift sequences are significantly dif-ferent. For the rift (r) sequence, this direction is defined by: Nr D 23, Dr D 5.1º, Ir D 37.3º, Kr D 26.9,Þ95r D 5.9º, and for El Golfo (eg) sequence by: Neg D 40, Deg D 14.2º, Ieg D 38.6º, Keg D 87.8,
Þ95eg D 2.43º. In calculating this last direction the 6 flows corresponding to the very late stage of the El Golfo sequence were not considered (see discussion below).
The average inclinations do not significantly dif-fer between the two sequences, and both are shal-lower than expected from a geocentred axial dipole (the average inclination anomaly calculated for the entire section is ∆I D 8:5º/. On the other hand, the average declinations calculated for the two
se-quences are both different from zero and different from each other. For the rift sequence, the mean declination is Dr D 5:1 š 7:5º, and for the El Golfo sequence Deg D 14:2 š 3:1º. A statistical test [19] shows that these two directions are significantly dif-ferent at the 99% confidence level.
4. Discussion
4.1. Serial correlation between flows
Volcanic series provide accurate spot readings of the past geomagnetic field, allowing investigation of the secular and millennial variability of the geo-dynamo. However, because of the erratic nature of volcanic emission, it may happen that a large number of flows are emitted in such a rapid succession that they all record the same direction of the geomagnetic field. If ignored, this serial correlation may lead to incorrect estimates of the dispersion of the field di-rections. It is unfortunately not so simple to address this issue, and rather contrasting views have been held by different authors.
On the one hand, some investigators have at-tempted to detect possible data redundancy by
group-N. S ze´r e´m e´t a et a l. / E ar th and P lanetar y Science L etter s 165 (1999) 241 – 253
Fig. 5. Inclination and declination records as a function of (a) flow numbers reported in the stratigraphic order (b) interpolated ages. (c) is the same as (b) for filtered data. In (c) no realistic age interpolation can be inferred for the interval between 261 and 176 ka (see text) as illustrated by the dotted line. In the 3 plots, the dashed vertical lines indicate the inclination and declination values expected for a geocentred axial dipole field, and the grey vertical lines reported for the El Golfo sequence illustrate the mean declination deduced from the data.
ing into ‘directional groups’ consecutive directions which appear to be repetitive sampling of the same geomagnetic field vector. Mankinen et al. [20], for instance, directly examined whether or not the 95% confidence ovals of successive flow directions over-lapped, to infer possible serial correlation. More recently, McElhinny et al. [21] and Vandamme and Bruneton [22] used a critical value for the angular difference between the paleomagnetic vectors of two successive flows, in order to decide whether the two flows recorded independent readings of the geomag-netic field. The two methods differ in the way the critical angle is calculated. In the McElhinny et al. [21] method, the critical angle is an average over the entire section, whereas it depends specifically on the two flows whose correlation is being tested in the second approach.
On the other hand, Love [23] argued that com-bining data using only directional criteria may lead to incorrect conclusions, because the rate of secu-lar variation may itself be strongly variable. Con-sequently, similar paleomagnetic directions may be due to true field behavior. In addition, Love noted that field intensity may vary substantially in the ab-sence of significant directional changes, as indicated by historical geomagnetic variations.
Given these strongly different views, we have taken the conservative approach of considering fil-tered and unfilfil-tered data, in order to assess the impact of filtering on the interpretation of the results. We have used the filtering method of Vandamme and Bruneton [22]. In addition, the test was repeated for each pair of flows within each cluster composed of 3 or more flows. This procedure avoided grouping together flows having recorded slow geomagnetic di-rectional trends (such as that observed between flows EG22 to 40) into a single large cluster. The method was applied to the El Golfo and rift sequences sep-arately, because the red soil provides evidence for a significant break in the extrusion rate.
The results are shown in Table 2 (part b) in which the flows yielding similar directions are identified as alternating white and light grey rows, while Fig. 5c shows the filtered directional record versus inter-polated ages. It can be seen that for both the rift sequence and the El Golfo sequence below 261 ka, filtering does not drastically affect the characteristics of the record obtained from unfiltered data. For
in-stance, the average paleomagnetic directions for the two sequences before and after filtering differ by only 2.7º (rift sequence) and 1.2º (El Golfo).
On the other hand, filtering has a rather strong effect in the interval 261 to 158 ka: the three trachytic flows and the three basaltic flows are grouped in two directional clusters, and it is not possible to infer a realistic age interpolation for them. For this reason, we have decided not to consider these flows in the discussion of the results. Our analysis is restricted to the rift sequence and to the El Golfo sequence below 261 ka.
4.2. The inclination=declination record
As reported above, inclinations from the two se-quences are quite consistent and are shallower than expected from a geocentered dipole field. This char-acteristics of the field has been observed in many previous studies from geographically widespread sites (Wilson’s off-centered dipole effect, see John-son and Constable [8] for references). It results in VGPs lying beyond the geographic pole (Fig. 6a), far-sided with respect to the sampling location. The average inclination anomaly observed at El Hierro ( 8.5º) is slightly higher than values reported from other studies in the Canary Islands [7]. It is, how-ever, consistent with values obtained from sites in the same latitudinal band over the past 5 Myr [1] (Fig. 7).
The average declinations of the rift and El Golfo sequences are both easterly deviated and signifi-cantly different. For the rift sequence, which has lasted only ¾25 kyr, one may eventually consider that an episode of secular variation with non zero declination has occurred. It is more difficult to con-sider a geomagnetic origin for the non zero decli-nations of the El Golfo sequence because they were systematically easterly deviated by an angle of ¾15º for over 100 kyr, an interval of time longer than the time constants involved in geomagnetic secular variation. In our opinion, the most realistic hypoth-esis which properly accounts for this feature is that the section has undergone a clockwise rotation. The smaller declination observed for the rift sequence would then suggest that part of the rotation has oc-curred recently, after fissural activity. As no other coeval paleomagnetic results are available from El
Fig. 6. Stereographic projection of the VGPs obtained for the rift and El Golfo sequences, using data (a) uncorrected and (b) after applying a counterclockwise rotation on the declination record (5.1º for the rift sequence and 14.2º for the El Golfo sequence).
Hierro, we have no evidence to discriminate between a rotation of the entire island and a local block ro-tation. This last hypothesis would be consistent with the known structural framework of the island. In-deed, it has been suggested by Day et al. [24] that if the downslope submerged part of the San Andre`s
Fig. 7. The inclination anomaly observed over the entire section (black square) plotted together with data from worldwide spread sites in the same latitudinal band (data from [1]).
fault system in the north-eastern part of the island would have a thrust geometry (an unproven but rea-sonable hypothesis), then the overall structure would resemble a rotational or circular failure yielding a clockwise rotation. Depending on the relative orien-tation of the fault and the paleomagnetic direction this would not necessarily affect inclination values. Only future paleomagnetic investigation will allow to discriminate between the two scenarios. Whatever the mechanisms of this rotation, in the following discussion we have counterclockwise rotated the de-clinations of the two sequences, by 5.1º for the rift and 14.2º for El Golfo sequences, in order to have zero average declination in both cases. However, we have pointed out what the major differences would be, if this rotation had not been considered. The effect of this correction on the VGP distribution is shown in Fig. 6b.
4.3. The scatter of the paleomagnetic directions To evaluate the amplitude of the secular varia-tion we have first calculated the scatter of the VGPs about the geographic pole, following McElhinny and McFadden [25]. The geomagnetic VGP dispersion Sf (corrected for the within-site dispersion) was calcu-lated with lower (Sl) and upper (Su) 95% confidence limits following Cox [26]. The results for the rift and El Golfo sequences are shown in Table 3, where all possible cases are considered (filtered and non filtered data, data corrected for the rotation or not). It can be seen that for the two sequences, filtering has a non significant effect on the amplitude of the VGP scatter, which is only slightly reduced by about
Table 3
VGP scatters calculated for the El Golfo section
Unrotated data Rotated data
Raw Filtered Raw Filtered
data data data data
Rift Sf 17.2 16.8 16.8 15.2 Sl 14.3 13.6 13.9 12.3 Su 21.8 21.6 21.2 19.6 El Golfo Sf 16.3 17.6 9.8 10.5 Sl 14.1 14.8 8.5 8.8 Su 19.3 21.8 11.6 13.0
Sfis the VGP scatter calculated with respect to the spin axis and
corrected for the within-site dispersion [25]. Sland Suare lower
and upper 95% confidence limits [26].
1–2º when filtered data are considered, with respect to unfiltered data.
Correcting for the rotation of the section has a limited impact on the results from the rift sequence, as expected from the fact that the correction for the rotation in this case is only 5º. Both before and after correction for the rotation and for both filtered and unfiltered data, the scatter of the VGPs is slightly higher than the predictions of Model G of McElhinny and McFadden [25], but consistent with this model within the accuracy limits (Fig. 8a). It may be noted that data from worldwide spread sites in the same latitudinal band also document VGPs scatter somewhat larger than predicted from this model.
On the other hand, the value of the VGPs scatter obtained from the El Golfo sequence decreases sig-nificantly (from ¾17º to ¾10º) upon correction for the rotation. While the uncorrected value would be consistent with model G, the corrected value is sig-nificantly smaller than that predicted by the model (Fig. 8b). This small scatter would suggest that a period of reduced amplitude of the secular variation has occurred in the region of the Canary islands in the period from 442 to 261 ka.
The suggestion of reduced secular variation, duced from the low VGP scatter, is entirely de-pendent on whether the data are corrected for the rotation of the island or not. Although, in our opin-ion, a rotation of the island is the most realistic explanation for the easterly seeking declinations, we have investigated this point further, by examining the
Fig. 8. VGP scatter, with respect to the spin-axis and corrected for the within-site dispersion, reported as a function of latitude, together with McElhinny and McFadden world-wide database and model G (from [25]). Sfparameter is calculated for the rift
and El Golfo sequences, for raw and filtered data, corrected and uncorrected for the rotation of the section. (see also Table 3).
scatter of the directions about their mean. First, it should be noted that the ratio of the precision pa-rameters Keg=Kr D 3.26 exceeds the 0.99 limiting value for an F test, indicating that the scatter of the paleomagnetic directions recorded by the flows of the rift sequence is significantly larger than that of the El Golfo sequence. The value obtained for the rift and El Golfo sequences were then compared to those obtained for synthetic sequences generated using the secular variation model of Constable and Parker [27]. Time sequences were generated using the time-dependent model of Constable [28], with the correlation times of Hulot and Le Mouel [29]. The mean values for the spherical harmonic
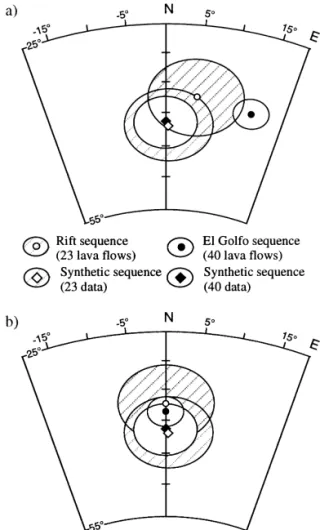
coef-ficients were those of Johnson and Constable [1] for the mean normal polarity field over the past 5 Ma. Each run provided 23 and 40 independent syn-thetic directions, to be consistent with the rift and El Golfo sequences. Also, the time frequency used for generating the synthetic sequences was 1=1100 and 1=4500 years, to mimic the mean extrusion rate of the rift and El Golfo sequences. In our experiments five independent drawings were made. The direc-tional scatter about mean direction was calculated for each drawing, then the five values were averaged provide an estimate of the synthetic directional dis-persion. The results are shown in Fig. 9a,b, relative to data uncorrected and corrected for the rotation re-spectively. The directional scatter of the rift sequence is consistent with the prediction of the model, while the value obtained for the El Golfo sequence is sig-nificantly smaller. When the rotation of the section is taken into account (Fig. 9b), the mean directions have the same zero declination as those produced by the model, and the only difference is the inclination anomaly discussed above.
The low value of the directional scatter, which is independent on whether the island has undergone a rotation or not, is in agreement with the reduced VGP scatter obtained for the El Golfo sequence, and therefore yields additional evidence for the existence of a period of low secular variation in the Canary Island region between 442 and 261 ka.
5. Conclusions
This paleomagnetic study of the two sequences in the island of El Hierro provides a new set of paleo-magnetic directions obtained with modern laboratory methods and with precise time constraints.
The inclination anomaly and the amplitude of the secular variation for the rift sequence are consistent with published data from other areas in the same latitudinal band. On the contrary, data from the El Golfo sequence suggest that a period of low secu-lar variation has occurred in the Canary Islands, in the interval between at least 442 and 261 ka. This evidence, documenting some non-stationarity of the paleosecular variation, should be further scrutinized in order to determine its exact duration and its ge-ographical extent. Studies currently under way in
Fig. 9. Mean directions andÞ95confidence ellipses calculated for
synthetic sequences and for the rift and El Golfo sequences (a) uncorrected and (b) corrected for the rotation of the section. The dispersion observed for the rift sequence is consistent with the prediction of Constable and Parker model [27] while the scatter obtained for the El Golfo sequence is significantly smaller.
the nearby island of La Palma, from a section only slightly older than the El Golfo sequence will allow us to better address the first aspect.
Acknowledgements
We wish to thank Laurie Brown and Cathy Con-stable for their careful and constructive reviews of an early version of the manuscript. Mike Hutnak and Nick Teanby are also thanked for improving our American=English. This work was supported in
France by the CEA and the CNRS, and in Spain by the CSIC. The authors also gratefully acknowledge financial help for the field trips by NATO Grant NºCRG 940609. The PhD grant for N.S. was given by the CEA. The directional determinations were done using the program ‘PaleoMag’ derived from the code written by Kirschvink [30] and adapted for the Macintosh by R. Ripperden and C. Jones, which can be downloaded directly from the University of Col-orado www site (http:==cires.colorado.edu=people= jones.craig=). This is LSCE contribution No. 158. [RV]
References
[1] C.L. Johnson, C.G. Constable, The time-average geomag-netic field: global and regional biases for 0–5 Ma, Geophys. J. Int. 131 (1997) 643–666.
[2] Iaga News, 37, December 1997, p. 18, Resolution #7. [3] N.D. Watkins, A. Richardson, R.G. Mason,
Paleomag-netism of the Macaronesian Insular Region: The Canary Islands, Earth Planet. Sci. Lett. 1 (1966) 225–231. [4] J.M. Ade-Hall, N.D. Watkins, Absence of correlations
be-tween opaque petrology and natural remanence polarity in Canary Island lavas, Geophys. J. R. Astron. Soc. 19 (1970) 351–360.
[5] A. Abdel-Monem, N.D. Watkins, P.W. Gast, Potassium– argon ages, volcanic stratigraphy, and geomagnetic polarity history of the Canary Islands: Lanzarote, Fuerteventura, Gran Canaria, and La Gomera, Am. J. Sci. 271 (1971) 490–521.
[6] A. Abdel-Monem, N.D. Watkins, P.W. Gast, Potassium– argon ages, volcanic stratigraphy, and geomagnetic polarity history of the Canary Islands: Tenerife, La Palma, and Hierro, Am. J. Sci. 272 (1972) 805–825.
[7] N.D. Watkins, Paleomagnetism of the Canary Islands and Madeira, Geophys. J. R. Astron. Soc. 32 (1973) 249–267. [8] C.L. Johnson, C.G. Constable, Paleosecular variation
recorded, by lava flows over the past five million years, Philos. Trans. R. Soc. London 354 (1996) 89–141. [9] X. Quidelleur, J.-P. Valet, Geomagnetic changes across the
last reversal recorded in lava flows from La Palma, Canary Islands, J. Geophys. Res. 101 (1996) 13755–13773. [10] H. Guillou, J.C. Carracedo, F. Perez Torado, E.
Ro-driguez Badiola, K–Ar ages and magnetic stratigraphy of a hotspot-induced, fast grown oceanic island: El Hierro, Ca-nary Islands, J. Volcanol. Geotherm. Res. 73 (1996) 141– 155.
[11] K. Hoernle, G. Tiltion, H.U. Schmincke, Sr–Nd–Pb iso-topic evolution of Gran Canaria: evidence for shallow en-riched mantle beneath the Canarian Islands, Earth Planet. Sci. Lett. 106 (1991) 44–63.
[12] J.S. Holik, P.D. Rabinowitz, J.A. Austin, Effects of
Ca-nary hotspot volcanism on structure of oceanic crust off Morocco, J. Geophys. Res. 96 (B7) (1991) 12039–12067. [13] A. Hernandez Paheco, Sobre una posible erupcion en 1793
en la isla de El Hierro (Canarias), Estud. Geol. 38 (1982) 15–25.
[14] D. Elsworth, B. Voight, Dike intrusion as a trigger for a large earthquakes and the failure of volcano flanks, J. Geophys. Res. 100 (1995) 6005–6024.
[15] R.T. Holcomb, R.C. Searle, Large landslides from oceanic volcanoes, Mar. Geotechnol. 10 (1991) 19–32.
[16] D.G. Masson, TOBI surveys and coring of debris flows west of the Canaries, Institute of Oceanographic Sciences, Deacon Laboratory, 1994.
[17] J.C. Carracedo, The Canary Islands: an example of struc-tural control on the growth of large oceanic-island volca-noes, J. Volcanol. Geotherm. Res. 60 (1994) 225–241. [18] P. Cassignol, P.Y. Gillot, Range and effectiveness of
un-spiked potassium–argon dating: experimental groundwork and applications, in: G.S. Odin (Ed.), Numerical Dating in Stratigraphy, Wiley, Chichester, 1982, pp. 159–179. [19] P.L. McFadden, D.L. Jones, The fold test in
paleomag-netism, Geophys. J. R. Astron. Soc. 67 (1981) 53–58. [20] E.A. Mankinen, M. Pre´vot, C. Sherman Gromme´, R.S.
Coe, The Steen Mountain (Oregon) geomagnetic polarity transition 1. Directionnal history, duration of episodes, and rock magnetism, J. Geophys. Res. 90 (1985) 10393–10416. [21] M.W. McElhinny, P.L. McFadden, R.T. Merrill, The myth of the Pacific dipole window, Earth Planet. Sci. Lett. 143 (1996) 13–22.
[22] D. Vandamme, M. Bruneton, Problem of elimination of directional data clusters in PSV studies, in: European Geo-physical Society suppl. I to vol. 16, Nice, 1998.
[23] J.J. Love, Paleomagnetic volcanic data and geomagnetic regularity of reversals and excursion, J. Geophys. Res. (1998) in press.
[24] S.J. Day, J.C. Carracedo, H. Guillou, Age and geometry of an aborted rift flank collapse: the San Andres fault system, El Hierro, Canary Island, Geol. Mag. 134 (1997) 523–537. [25] M.W. McElhinny, P.L. McFadden, Paleosecular variation over the past 5 Myr based on a new generalized database, Geophys. J. Int. 131 (1997) 240–252.
[26] A. Cox, Confidence limits for the precision parameter K, Geophys. J. R. Astron. Soc. 18 (1969) 545–549.
[27] C. Constable, R. Parker, Statistics of the geomagnetic secu-lar variation for the past 5 m.y., J. Geophys. Res. 93 (1988) 11569–11581.
[28] C. Constable, A simple statistic model of geomagnetic reversals, J. Geophys. Res. 95 (1990) 4587–4596. [29] G. Hulot, J.-L. Le Moue¨l, A statistical approach to the
Earth main magnetic field, Phys. Earth Planet. Inter. 82 (1994) 167–183.
[30] J.L. Kirschvink, The least-square line and plane and the analysis of paleomagnetic data, Geophys. J. R. Astron. Soc. 62 (1980) 699–718.
[31] R.H. Steiger, E. Ja¨ger, Convention on the use of decay constants in geocosmochronology, Earth Planet. Sci. Lett. 36 (1977) 359–362.

![Fig. 7. The inclination anomaly observed over the entire section (black square) plotted together with data from worldwide spread sites in the same latitudinal band (data from [1]).](https://thumb-eu.123doks.com/thumbv2/123doknet/13586855.422688/11.892.85.422.130.826/inclination-anomaly-observed-entire-section-plotted-worldwide-latitudinal.webp)
![Fig. 8. VGP scatter, with respect to the spin-axis and corrected for the within-site dispersion, reported as a function of latitude, together with McElhinny and McFadden world-wide database and model G (from [25])](https://thumb-eu.123doks.com/thumbv2/123doknet/13586855.422688/12.892.75.433.173.346/corrected-dispersion-reported-function-latitude-mcelhinny-mcfadden-database.webp)