Publisher’s version / Version de l'éditeur:
Vous avez des questions? Nous pouvons vous aider. Pour communiquer directement avec un auteur, consultez la première page de la revue dans laquelle son article a été publié afin de trouver ses coordonnées. Si vous n’arrivez pas à les repérer, communiquez avec nous à PublicationsArchive-ArchivesPublications@nrc-cnrc.gc.ca.
Questions? Contact the NRC Publications Archive team at
PublicationsArchive-ArchivesPublications@nrc-cnrc.gc.ca. If you wish to email the authors directly, please see the first page of the publication for their contact information.
https://publications-cnrc.canada.ca/fra/droits
L’accès à ce site Web et l’utilisation de son contenu sont assujettis aux conditions présentées dans le site LISEZ CES CONDITIONS ATTENTIVEMENT AVANT D’UTILISER CE SITE WEB.
Building Research Note, 1982-01
READ THESE TERMS AND CONDITIONS CAREFULLY BEFORE USING THIS WEBSITE. https://nrc-publications.canada.ca/eng/copyright
NRC Publications Archive Record / Notice des Archives des publications du CNRC :
https://nrc-publications.canada.ca/eng/view/object/?id=a6749c97-3dc5-4d41-8174-69fea37dd1d7
https://publications-cnrc.canada.ca/fra/voir/objet/?id=a6749c97-3dc5-4d41-8174-69fea37dd1d7
NRC Publications Archive
Archives des publications du CNRC
This publication could be one of several versions: author’s original, accepted manuscript or the publisher’s version. / La version de cette publication peut être l’une des suivantes : la version prépublication de l’auteur, la version acceptée du manuscrit ou la version de l’éditeur.
For the publisher’s version, please access the DOI link below./ Pour consulter la version de l’éditeur, utilisez le lien DOI ci-dessous.
https://doi.org/10.4224/40000531
Access and use of this website and the material on it are subject to the Terms and Conditions set forth at
Annual energy consumption data on supermarkets in Ontario and
Quebec
Ser
TH1
B92
no.
183
ANNUAL ENERGY
CONSUMPTION
DATA
ON
S U P E W E T S
IN
ONTARIO
AND
QUEBEC
The Standing Committee
on
Energy
Conservation in Buildings
is
at
tempting,
on behalf of
the
N a t i o r l a l
Research
Council
As
sociate
Committee on
t h e
National
Building Code,
t o
define
a p p r o p r i a t e
energy
targets
f o r
dif
f e s e n t
c l a s s e s
of b u i l d i n g s , taking
i n t o
c o n s f d e r a t i o n
the actual energy
consumption
of
e x i s t i n g b u t l d i n g s .
This
report p r o v i d e s
supermarket
management
and
p u b l i s h e r s
of
energy
guidelines
with
a
data
base
of actual energy
consumption
in
supermarkets.
The
d a t a
was
obtained
from two well-known supermarket
c h a i n s in Ontarto and Quebec, and arranged in
t w o
groups,
A
and
B .
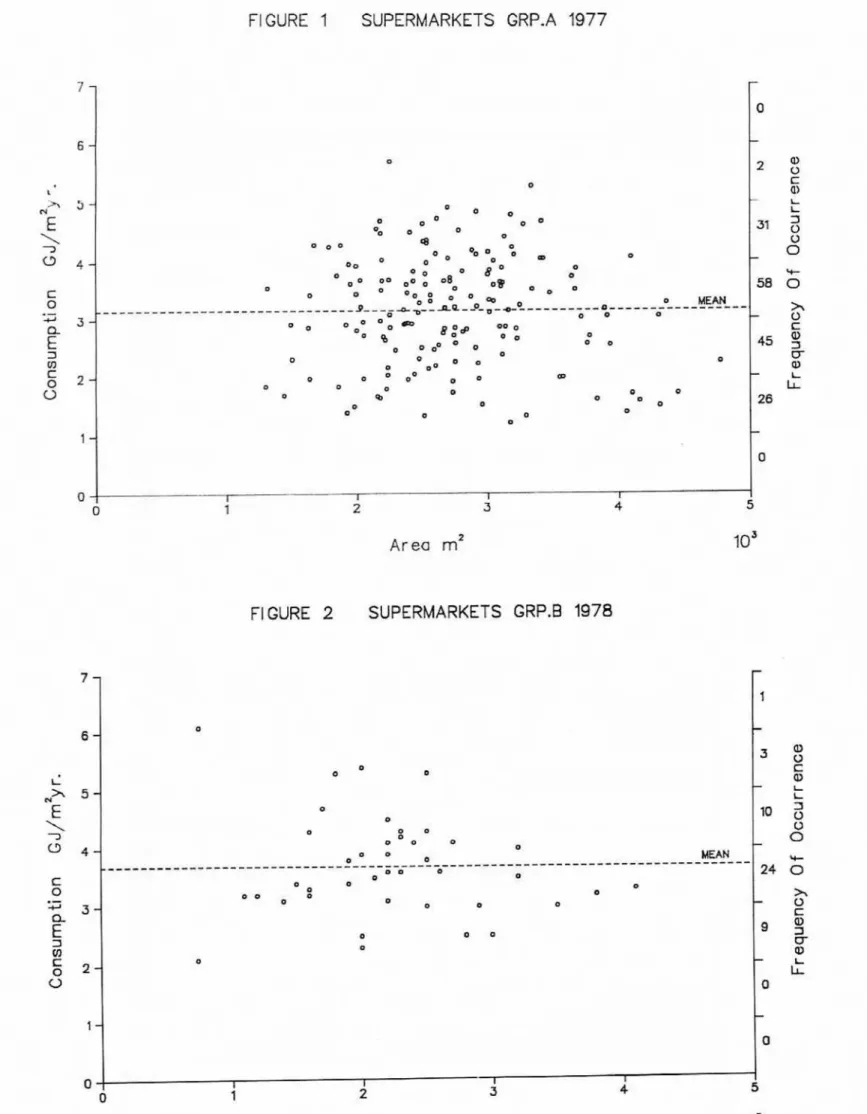
The annual energy consumption by
supermarkets
in O n t a r i o
and
Quebec
is reported in Group A
for
t h e
year
1977
o n l y ,
whereas
for
supermarkets in
Group
B ( l o c a t e d in Ontario) the annual
energy
consumprion
is
reported f a r
t w oconsecutive years,
1978 and
1979.
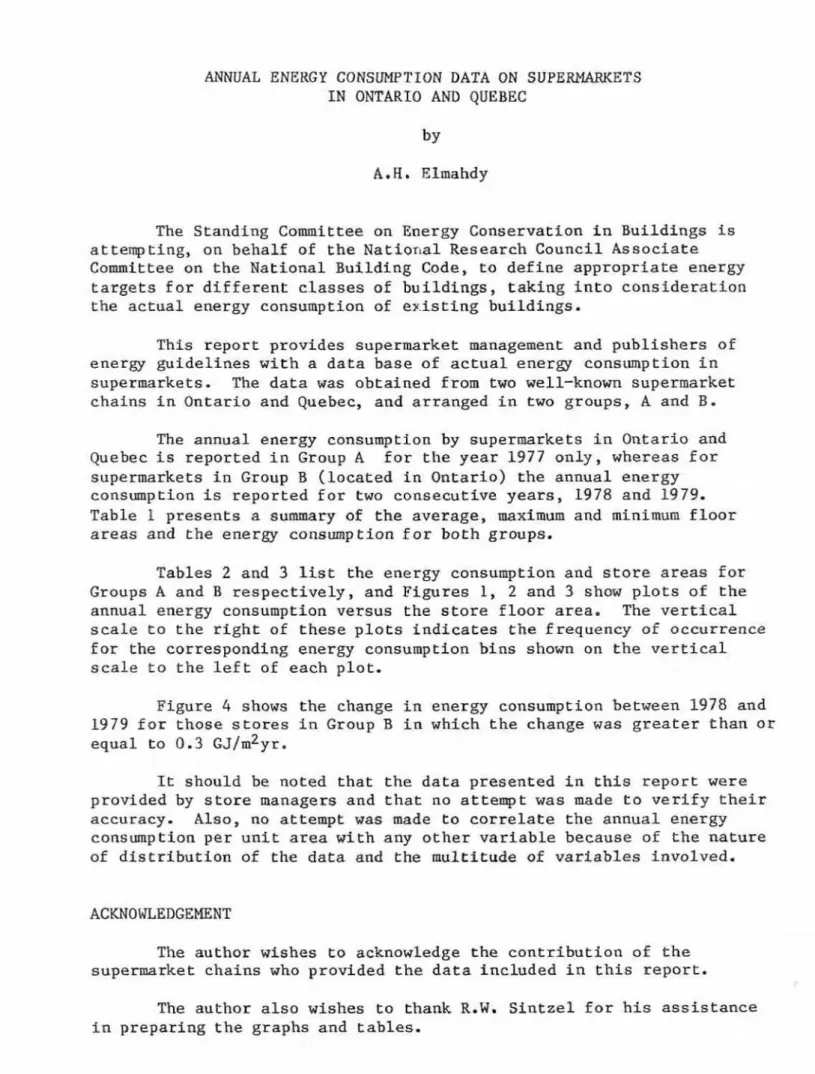
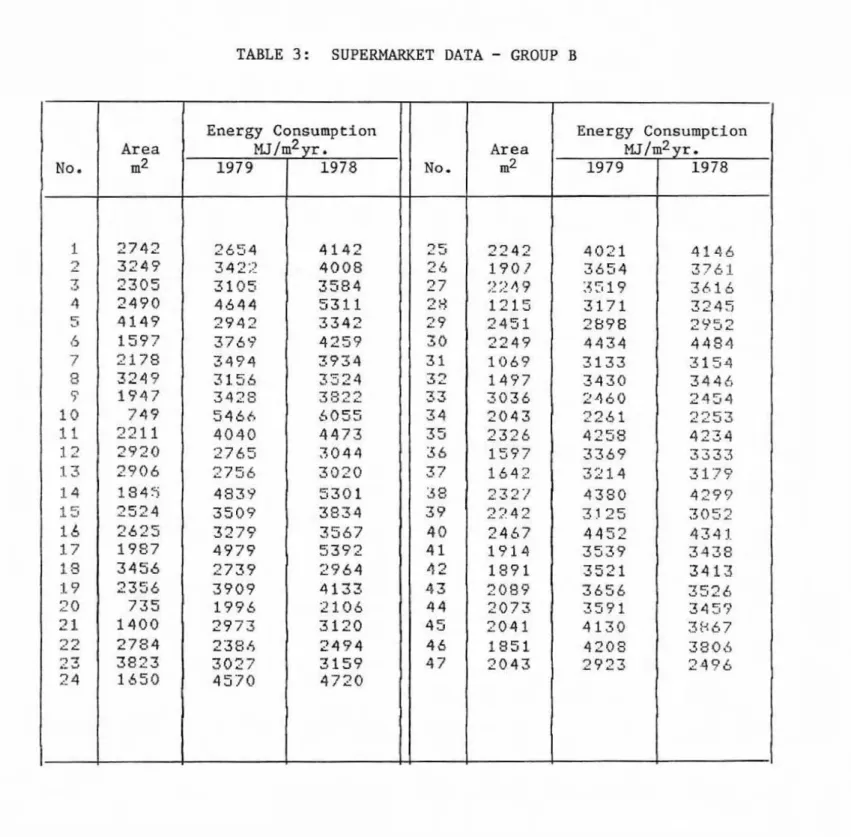
Table
1
presents
a summary of the
average,
maximum
and minimum floor
areas
and
the energy
consumption
for
both
groups.
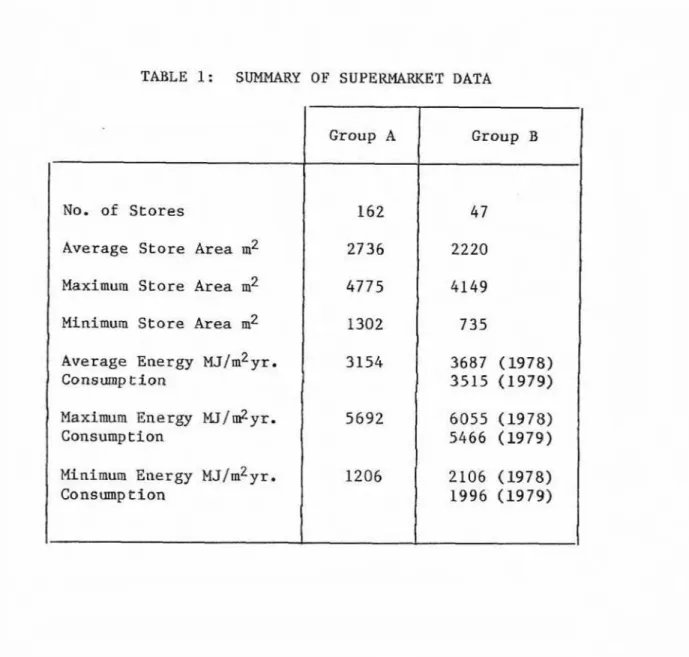
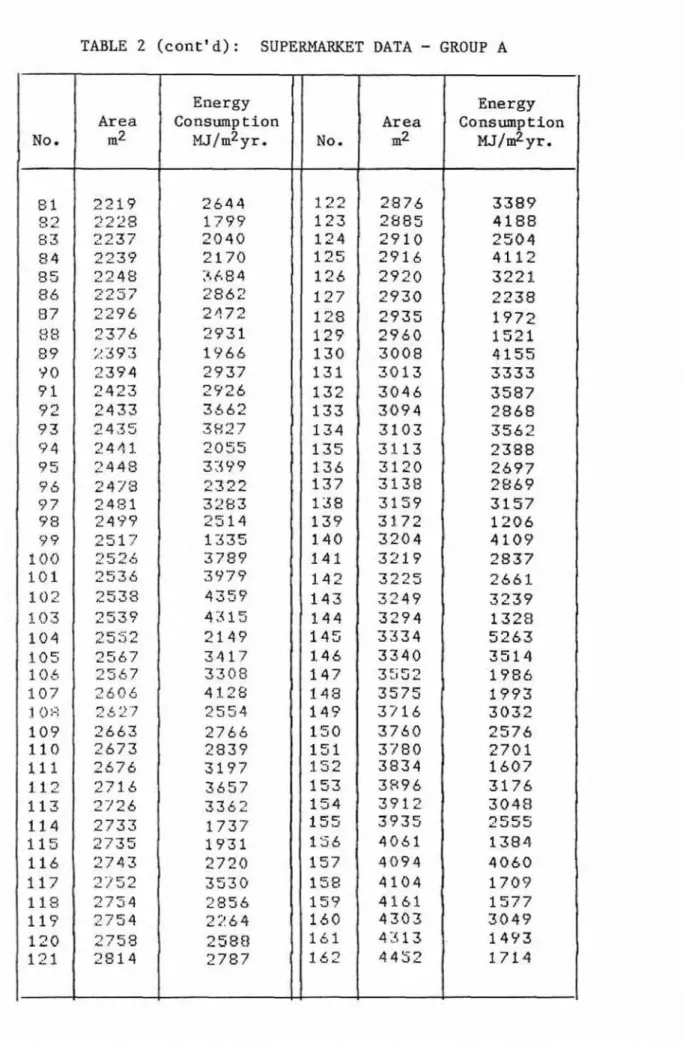
T a b l e s 2
and
3
l i s t
t h e energy consumption
and
store
areas
f o r
Groups A
and
B
r e s p e c t i v e l y ,
and
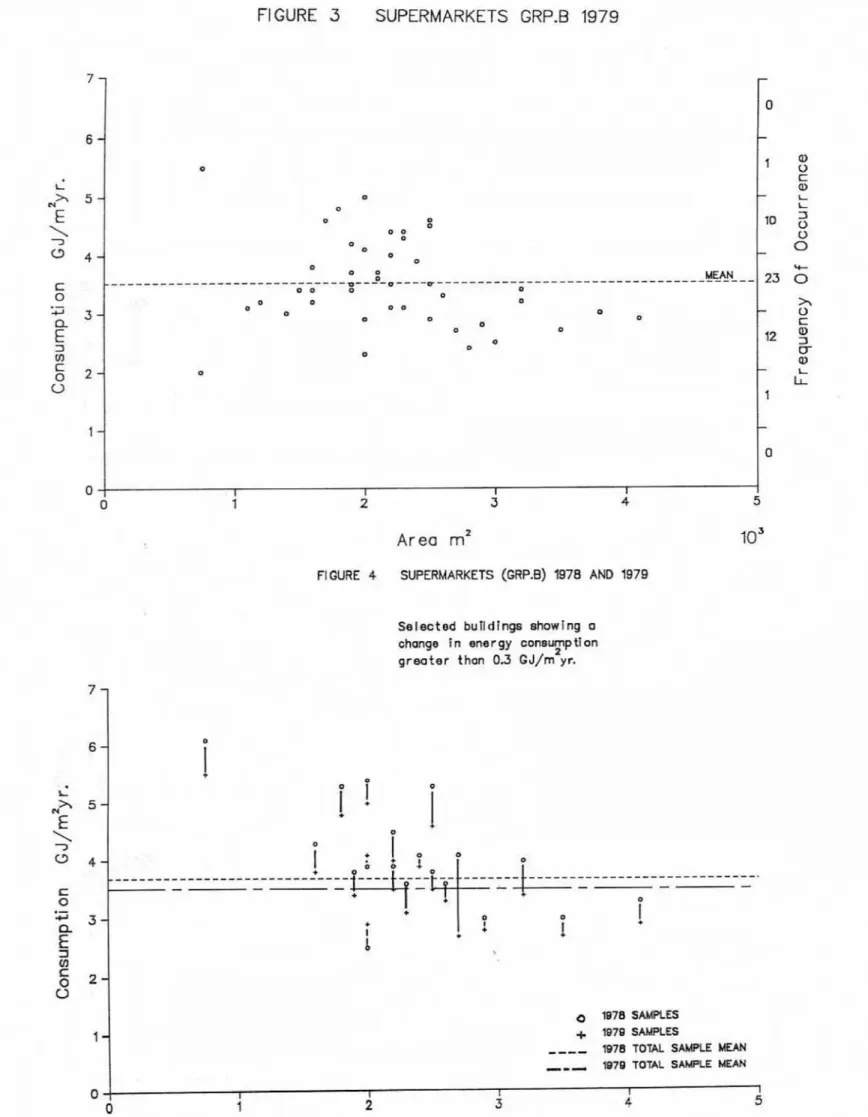
F i g u r e s
1, 2
and
3
show
p l o t s
of
t h e
annual energy cansumption versus
the
store f l o o r area.
The
v e r t i c a l
s c a l e
to
the
rFght
af
these
p l o t s
i n d i c a t e s
the
frequency of
occurrence
for
the
corresponding energy
consumption
bins shown on
the
vertical
scale
to the
left
of
each plot.
Figure
4
shows
t h e
change
in energy consumption between 1978
a n d
1979 f o r
those
s t o r e s
in
Group
3in
w h i c h the change
w a s
greater
than or
equal to
0.3
~
~
/
m
~
~
r
.
It
s h o u l d be
noted
t h a t t h e data
presented
in this
repart
w e r e
provided
by
store
managers
and that no
a t t e m p tw a s made to v e r i f y
t h e i r
accuracy.
A l s o ,
no
attempt
was
made
t o
correlate the annual energy
consumption
p e r
unit
area
with
any
other
v a r i a b l e
because
of
t h e
nature
of distribution of
the
data and
t h e
multftude of
variables Fnvolved.
ACKNOWLEDGEMENT
The author wishes to acknowledge the
contribution
of
the
supermarket
chains
who
p r o v i d e d
the
data i n c l u d e d in
this report.
The
author
a l s o wishes
t o
thank
R.W,
S d n t z e l f o r h i s asskstance
TABLE
1:
SUMMARY
OF
SUPERMARKET
DATA
No.
of
S t o r e s
Average S t o r e
Area
m2
Maximum
Store
Area
m2
Minimum S t o r e
A r e a
m2
Average Energy
MJ/m2
yr.
Consump
tion
Maximurn Energy H.I/dyr.
Consump
tion
Mfnimurn
Energy
M J J I U ~ ~ ~ .Consump
t i o n
Group
A
262
2736
4775
1302
3 1 5 4
5692
Group
B
4
7
2220
4 1 4 9
7 3 5
3587
(1978)
3515
(1979)
6055
(1978)
5 4 6 6
(1979)
1206
2106
(1978)
1996 (1979)
FIGURE 1
SUPERMARKETS
GRP,A 1977
FIGURE
2
SUPERMARKETS GRP.B
1978
Area
rn2
-
0-
P) l 2 U C a) L L 312
L) 0-
*
58 0 X-
L) C 455
0- w-
L LL 28-
a
5-
-
-
-
-
-
Area
m2
los
D O o 0 0 m e g o % 8 0 0 0 0 1 v.a:
*
0 0*
o 0 * o 0 R 0 0 D 0 * 0 V D 0 0 0 '8. 0% D 0 g o o a s -e 0*
MEAN ---99999-D--a~-9-11440,0,----0,--0,o--- o 0 o a O , O - : B 0 8 : s - 0 0 Q CI 0 5 0 0 0 8 0 0 O 0 m O 0 9 0 0 0'' 0"
m 0 0 0 0 m a D a 0 0 0 I 0 0 0 k I I Ia
12
3 4FIGURE 3
SUPERMARKETS GRP-B
1979
FIGURE 4 SUPERMARKETS (GRP.B)
l978
AM3 1979Selected bufldfnge showing a chonge i rr energy conswnpZI an
2
g r m t e r
than
0 3 GJ/m yr'0 tB7& SAIAPLEi
+
1870 SAMPLES, ,,,1878 TOTAL S-E MEAH
, -,