Publisher’s version / Version de l'éditeur:
Journal of the Illuminating Engineering Society, 17, 2, pp. 61-69, 1988
READ THESE TERMS AND CONDITIONS CAREFULLY BEFORE USING THIS WEBSITE. https://nrc-publications.canada.ca/eng/copyright
Vous avez des questions? Nous pouvons vous aider. Pour communiquer directement avec un auteur, consultez la première page de la revue dans laquelle son article a été publié afin de trouver ses coordonnées. Si vous n’arrivez pas à les repérer, communiquez avec nous à [email protected].
Questions? Contact the NRC Publications Archive team at
[email protected]. If you wish to email the authors directly, please see the first page of the publication for their contact information.
NRC Publications Archive
Archives des publications du CNRC
This publication could be one of several versions: author’s original, accepted manuscript or the publisher’s version. / La version de cette publication peut être l’une des suivantes : la version prépublication de l’auteur, la version acceptée du manuscrit ou la version de l’éditeur.
Access and use of this website and the material on it are subject to the Terms and Conditions set forth at
Interlaboratory comparison of contrast measurement
Rea, M. S.; Ouellette, M. J.; Pasini, I. C.
https://publications-cnrc.canada.ca/fra/droits
L’accès à ce site Web et l’utilisation de son contenu sont assujettis aux conditions présentées dans le site LISEZ CES CONDITIONS ATTENTIVEMENT AVANT D’UTILISER CE SITE WEB.
NRC Publications Record / Notice d'Archives des publications de CNRC:
https://nrc-publications.canada.ca/eng/view/object/?id=84ef0a4d-80ac-45bb-8e35-19f29920e1f7 https://publications-cnrc.canada.ca/fra/voir/objet/?id=84ef0a4d-80ac-45bb-8e35-19f29920e1f7S e r
TH1
National Research
Conseil national
I
1
*
1
Council Canada
de ncherches Canada
no.
1 8 4 4
c.
2
Institute for
lnstitut de
E L D G
Research in
recherche en
- - -
Construction
construction
Interlaboratory Comparison of
Contrast Measurement
by M.S. Rea, M.J. Ouellette and I. Pasini
ANALYZED
Reprinted from
Journal of the Illuminating Engineering Society
Vol. 17, No. 2, 1988
p. 61-69
(IRC Paper No. 1844)
Interlaboratory Comparison of Contrast
Measurement
M.S.
Rea
(I), M.J. OueUette (I), I.Pasini
(2)Introduction
Luminance contrast is one of the fundamental vari- ables of vision. Although repeatedly a subject for dis- cussion, there have been no systematic studies to determine whether contrast can be measured ac- curately by either laboratories involved in lighting re- search or practitioners in the field. This report focus- es on the measurement of contrast* under controlled conditions in the laboratory and in simulated, realis- tic environments. Three tasks were performed by each of four laboratories: the National Research Council Canada, Institute for Research in Construction, Ot- tawa, Canada; the National Bureau of Standards, Cen- ter for Building Technology, Gaithersburg, MD, USA; the Building Research Establishment, Watford, Eng- land; the Electricity Council Research Centre, Capen- hurst, England." Problems in contrast measurement under laboratory and simulated field conditions are identified and recommendations proposed.
Task 1 examines the influence of stray light from surrounding luminous areas under controlled labora- tory conditions. Task 2 is an investigation of consisten- cy in making photometric measurements under more realistic conditions. Finally, Task 3 examines whether inexperienced people could make consistent photo- metric measurements with a luminance photometer and brightness matches in a side-by-side comparison technique of printed materials in realistic Authors' affiliatwm ( I ) The National Research Council of Canada, In-
stitute for Research in Conshuction. (2) Public Works Canada, Depart- ment of Ele&crl Engineering.
environments.
Statistical tests were performed on the data obtain- ed for each task. The actual data are less important than the conclusions drawn from these tests, but sum- mary data tables of each task are presented for the benefit of those interested in the numerical values.
Since this report deals mainly with the results of several statistical tests, it is necessary to describe the context within which the statistically significant results were obtained. Under laboratory conditions it is possible to detect small effects that might not be noticed in less controlled, more realistic settings. Con- sequently, the importance of the statistical findings must be understood in the context within which the data were obtained. An attempt will be made to de- scribe the importance of each finding as well as its statistical significance.
Task 1 Description
The purpose of Task 1 was to assess the influence of stray light from surrounding luminous regions, and to *Although there are seueral alternative f o m of contrast the computation of the contmst of printed materials always involves a ratio of luminances at a luminous border. In this report contmst is defined simply as the ratio of the luminance of the darker wne to that of of the lighter wne, except where noted. By this definition, contrasts range from u n i t y h r very faint luminous border to approximately zero for such prominent borders as black ink on white paper.
**Each Laboratory will be referred to by numbers 1-4; these numbers do not correspond to the order given in this sentence.
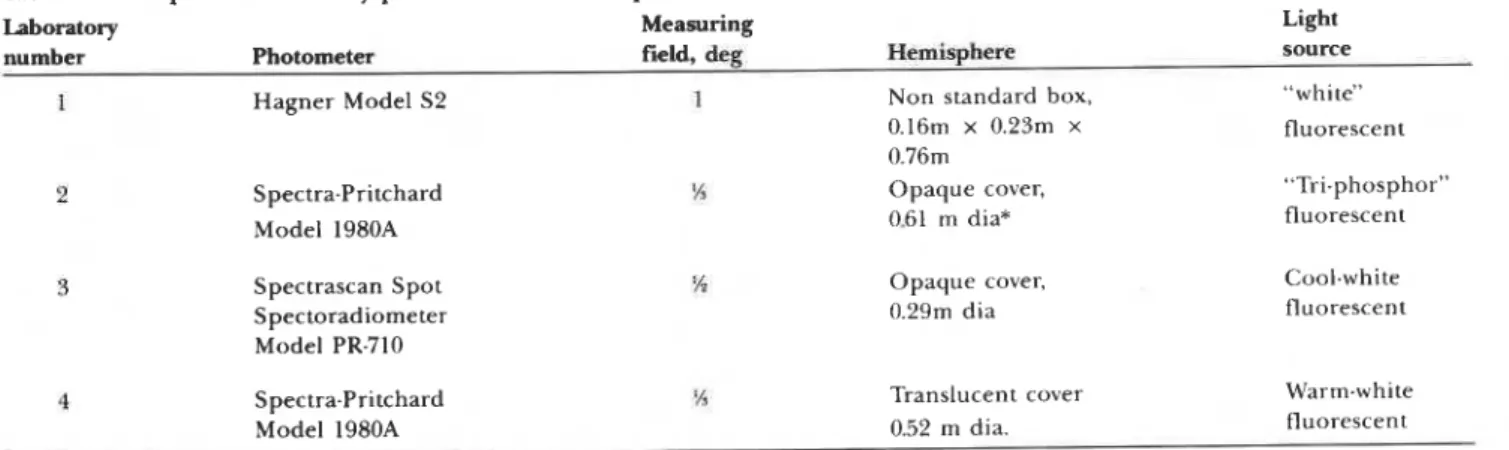
Table 1-Description of laboratory photometers and hemispheres.
Laboratory Measuring Light
number Photometer field, deg Hemisphere source
Hagner Model S2 2 Spectra-Pritchard Model 1980A Spectrascan Spot Spectoradiometer Model PR-710 Spectra-Pritchard Model 1980A
1 Non standard box,
0.16m x 0.23m x 0.76m Opaque cover, 0.61 rn dia* '16 Opaque cover, 0.29111 dia 'h Translucent cover 0.52 m dia. "white" fluorescent "Tri-phosphor" fluorescent Cool.white fluorescent Warm-white fluorescent
*Laboratmy 2 used a 03 m dia hemisphere for Task 2.
Reprinted from the Journal of the IES Vol. 17, No. 2 with the permission of the Illuminating Engineering Society of North America
Table 2-Photometric samples.
Darker Card Lighter Card Nominal Munsell Luminous Munsell Luminous Sample description notation2 reflect.* notation2 reflect.*
-4 Low luminance N 2.51 4.6 N 8.51 68.4 ratio
B Medium lumi- N 4.01 12.0 N 6.01 SOD nance ratio
C High lumi- N 5.251 22.1 N 5.51 24.6
*Luminous refictance, in percent, relative to MgO (Table 1 of reference 2,).
determine whether the measured contrast of printed materials can be reproduced by different lighting laboratories under controlled conditions. Each laboratory was instructed to make all measurements with its best calibrated photometer under standard, hemisphere lighting conditions.' Each had a dif- ferent photometer and hemisphere o r facsimile, (Table l ) , but all four used the same sample materials. Three samples were prepared from juxtaposed pairs of matte, achromatic Munsell cards (Table
2);
all six cards were 76x
89 mm. Achromatic cards were employed to minimize the impact that different light source spectral emissions and different photometer spectral sensitivities might have o n the photometric measurements. Each sample was mounted o n a (210 mmx
210 mm), white, opaque plate; and, when not in use, each was individually protected in a plastic cover. Four thin paper cover cards were placed, in turn, over the three samples during photometric measure- ments. The cover cards were white (R = 0.88) o r .black (R = 0.06) and had either large o r small square holes (70 o r 14 mm o n a side) cut in their centers and through which the border of each sample could be viewed.* The purpose of the cover cards was to de- termine how stray light from areas outside the measurement region affected the photometric measurements.The ratio of the luminance of the dark cards (L,) to that of the light cards (L,) was defined as the sam- ple contrast. All four laboratories made three measurements in random order of each of the three samples with each of the four cover cards.
Results
The luminance ratio (L,IL,) measurements were
Table 3. Each laboratory could accurately repeat its own measurements, but there were differences among laboratories, samples, and cover cards. Further, all possible interactions among these factors were statistically significant ( p
<
0.001). Although not con- clusive, it may reasonably be inferred that the statistical results were caused by stray light that af- fected measurements to different degrees.Laboratories 2 and 3 produced statistically iden- tical results as well as the lowest luminance ratio values under all conditions. Stray light from brighter adjacent regions can increase the measured luminance of darker samples so that the measured luminance ratios (L,IL,) will approach unity. The two laboratories minimized the influence of stray light on the measurements.
Laboratory 1 produced relatively higher contrast values under all conditions, probably because a non- standard lighting geometry (a box) was used. Non- standard equipment is expected to produce such discrepancies under controlled conditions.
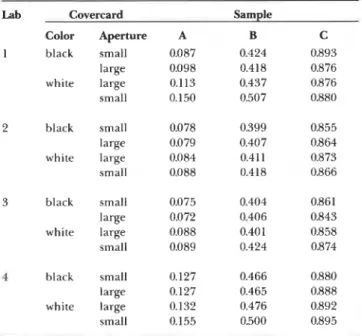
Table 3-Measured Contrast (LblL,,,) for Task 1. Each entry represents the average of three measurements.
The samples are described in Table 2.
Lab Covercard Sample
Color Aperture A B C 1 black small 0.087 0.424 0.893 large 0.098 0.418 0.876 white large 0.113 0.437 0.876 small 0.150 0.507 0.880 2 black small 0.078 0.399 0.855 large 0.079 0.407 0.864 white large 0.084 0.41 1 0.873 small 0.088 0.418 0.866
submitted to an analysis of variance (ANOVA) to determine whether there were significant differences 3 among the laboratories, the samples, and the cover cards, and whether there were significant interactions among these variables; summary data are given in
4
*Reflectance factors (R) were determined using a cool-white fluorescent light source, a Hagner model S2 photometer with 1 degree measuring field, a barium sulfate plate as a rejkence and employing a 0 degree inn'-
dent and 45 degree measurement geometry.
black small large white large small black small large white large small
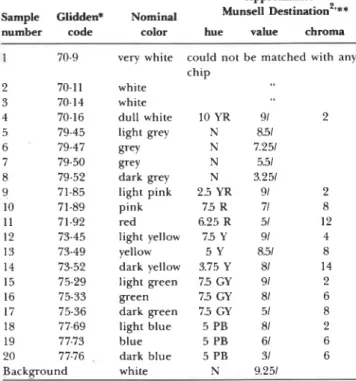
Table 4-Description of the paint samples.
Approximate Sample Clidden* Nominal Munsell ~estination"** number code color hue value chroma
I 70-9 very white could not be matched with any chip 2 70-11 white 3 70.14 white 4 70-16 dull white 10 YR 91 2 5 79-45 light grey N 851 6 79-47 grey N 7.251 7 79-50 grey N 5.51 8 79-52 dark grey N 3.251 9 71-85 light pink 2.5 YR 91 2 10 71-89 pink 75 R 71 8 11 71-92 red 6.25 R 51 12 12 73-45 light yellow 7.5 Y 91 4 13 73-49 yellow 5 Y 8.51 8 14 73-52 dark yellow 3.75 Y 81 14 15 75-29 light green 75 GY 91 2 16 75-33 green 75 GY 81 6 17 75-36 dark green 7.5 GY 51 8 18 77-69 light blue 5 PB 81 2 19 77-73 blue 5 PB 61 6 20 77-76 dark blue 5 PB 31 6 Background w h i ~ e N 9.251
*Glidden Paint Company Zne., 925 Euclid Ave., Cleveland, OH, USA 44115
**These ualues represent one of the experimenter's matches under cool- white fluorescent illumination and should only be considered as ap- proximately correct under other illuminants.
The highest luminance ratios were provided by
Laboratory 4 for two related reasons. The photometer
used was highly susceptible to internal light scatter, and in combination with a translucent hemisphere* the luminance ratios were elevated to significantly higher values. Both sources of measurement error were identified by re-measuring with another photo- meter and by covering the translucent hemisphere.
Under these conditions Laboratory 4 produced
luminance ratios almost identical to those from Lab- oratories 2 and 3, in which stray light was minimized by their procedures.
A Tukey test of multiple comparison was performed on the average luminance ratio measurements for each cover card to identify cards that influenced the measurements differently3 The white cover card with the small aperture produced significantly higher
( p
<
0.05) luminance ratios in a manner consistentwith increased stray light; the white card with the large aperture elevated the luminance ratios some what less. The two black cards produced signifi- cantly lower luminance ratios. The aperture sizes, however, were not important for the luminance ratios obtained with the black cover cards.
*The hemisphere was fabricatedfrom tmnslucent white phdie. Light in-
side the hemisphere caused the exterior surface to act as a very bright
luminous field adjaeent to the sample areas being measured.
Conclusions
The highest luminance ratios (i.e., the lowest con-
trasts) were associated with Laboratory 4, using the
small aperture white cover card; the lowest ratios were associated with Laboratories 2 and 3 using the black cover cards. The other luminance ratios were rational- ly ordered between the two extremes according to the stray light hypothesis. Statistically significant interac- tions between the cover cards and the other experi- mental variables supported the conclusion that stray light is the main cause of inconsistent results. Recommendations
1) Standard hemisphere lighting should be used
when precise comparisons between contrast measure- ments are important. Non-standard lighting geome-
tries (as used by Laboratory 1) may produce internally
consistent results, but they may be significantly dif- ferent from those produced when standard, hemi- sphere lighting is used. The hemisphere cover should be opaque to limit stray light in the photometer. An opaque cover provides the additional benefit of limiting ambient room illumination on the samples.
2) A photometer's susceptibility to stray light should
be evaluated and documented in all publications where contrast measurements are important. As in this study, black and white cover cards of the same aperture size could be placed over a reflectance sam- ple under hemisphere conditions. The ratio of the luminance ratios obtained with the black and white cover cards would be determined. Photometers yield- ing luminance ratios close to unity under these test conditions would be preferred.
3) The amount of stray light contributing to con-
trast measurements will depend upon the luminances of the areas surrounding the sample and the size of the sample. A standard cover card of low luminance and having small aperture should be used to standar- dize contrast measurements and reduce stray light.
Task 2
Description
Task 2 was designed to determine whether consis-
tent contrast measurements can be obtained under more realistic conditions than those of Task 1. Col- ored paint samples applied to a common white paper
(Table 4) were supplied for photometric measurement
to determine the importance of spectral reflectances on contrast measurements. The four laboratories were again instructed to make measurements in a hemi- sphere or facsimile as well as in a windowless environ- ment avoiding veiling reflections that simulated a realistic office. It is highly unlikely that a practitioner would have a hemisphere for standard photometric measurements. After all, one of the four lighting
laboratories didn't have one. Thus, a windowless en- vironment avoiding veiling reflections might be used as a field standard. It was therefore possible to com- pare measurements from a standard hemisphere o r facsimile with those from the proposed field standard and, further, to determine how consistent the mea- surements in the windowless environment would be.
Measurements were to be taken with the laboratory photometer as well as with a relatively inexpensive luminance photometer supplied with the paint samples (Minolta, Model nt-1 degree with a #135, 400-mm close u p lens). In this way it would be possible to compare the results from the best laboratory photometer with those from a common, less expen- sive, luminance photometer that might be used by a practitioner.
The ratio of the luminance of the paint sample (L,) to the luminance of the adjacent paper (L,) was defined as the paint sample contrast. Photometric measurements were made with each paintlpaper sam- ple placed o n top of a gray, opaque backing plate sup- plied for the task. Each laboratory was asked to report values of L, and L, for each combination of lighting geometry (hemisphere o r windowless environment), type of photometer (laboratory o r that supplied), and paintlpaper sample (20 different colors on common paper backing).
Results
A series of ANOVA's were ,performed on the lumi- nance ratios, each averaging across a different in- dependent variable to gain residual mean square er- rors for the denominators of the F ratios. For the ANOVA ignoring the paintlpaper samples as a variable there were no significant differences among laboratories, photometers, and lighting geometries, nor were there any significant ( p
2
0.5) interactions among variables. This is a relatively uninteresting analysis, however, because the variations in luminance ratios associated with the other variables are small compared to those associated with the different paintlpaper samples. In other words, the differences in the luminance ratios associated with all the other variables were not significantly larger than the (deliberately) large differences in luminance ratios associated with the various paintlpaper samples that formed the basis for the "residual error" term in this ANOVA. Consequently, these results will not be discussed further.Photometers were not significantly different in any of the other statistical analyses. This implies that under similar realistic conditions consistent photo- metric measurements can be obtained with the less ex- pensive photometers. There was, however, a barely significant ( p 5 0.05) interaction between the
laboratories and photometers in the ANOVA averag- ing across lighting geometry. This finding was pro- bably due to inaccurate readings o r recordings of one o r two samples from Laboratory 1, since the values from the two photometers agreed well for most samples for this laboratory and since all other laboratories produced statistically equivalent results with the two photometers.
Laboratories and lighting geometries were signifi- cantly different, as was the interaction between the two variables ( p 5 0.001) in the ANOVA averaging across photometers. These results were d u e to unusually low luminance ratios in the windowless en- vironment of Laboratory 3. Each laboratory provided photographs of its experimental arrangements. Ex- amination of the photographs from Laboratory 3 showed that the photometers were placed very close to the sample in the windowless environment, and that the shadow of the photometer was cast over the paint samples during measurements. Thus, a portion of the overhead ceiling luminaires responsible for veiling reflections was masked and gave unusually low luminance ratios in the windowless environment.
Paintlpaper samples were highly significant in all three analyses. Further, they interacted with all the other variables except the photometers, as stated previously. Table
5
summarizes the measurements yielding the significant interaction for lighting geom- etry, laboratory, and sample. Comparing the results from the different laboratories, there were systematic differences among the paintlpaper samples. The range of luminance ratios from the different labora-Table 5-Luminance ratio LplL, measurements for Task 2. Each cell represents the average of 2 measurements; one for each photometer type
Windowless Office Hemisphere Sample Lab 1 Lab 2 Lab 3 Lab 4 Lab 1 Lab 2 Lab 3 Lab 4
1 1.02 1.05 0.96 1.03 1.04 1.03 1.03 1.03 2 1.00 1.01 0.93 0.99 1.02 1.02 1.02 1.00 3 1.02 1.05 0.96 1.03 1.04 1.05 1.04 1.04 4 0.99 0.99 0.90 0.98 1.00 1.00 1.00 1.00 5 0.96 0.97 0.83 0.95 0.98 0.98 0.96 0.97 6 0.64 0.58 0.49 0.55 0.62 0.61 0.58 0.60 7 0.33 0.23 0.23 0.24 0.27 0.22 0.18 0.25 8 0.99 1.01 0.93 0.98 1.02 1.01 1.01 1.01 9 0.96 0.97 0.88 0.95 0.98 1.03 0.97 0.98 10 0.85 0.87 0.78 0.84 0.88 0.89 0.87 0.86 11 0.94 0.96 0.89 0.95 0.97 0.97 0.97 0.96 12 0.65 0.69 0.65 0.69 0.69 0.69 0.69 0.70 13 0.28 0.30 0.28 0.31 031 0.29 0.30 0.32 14 0.81 0.80 0.75 0.80 0.81 0.80 0.80 0.79 15 0.38 0.37 0.35 037 0.38 0.36 0 3 8 0 3 8 16 0.12 0.11 0.11 0.12 0.13 0.10 0.11 0.13 17 0.81 0.81 0.76 0.81 0.82 0.82 0.81 0.81 18 0.61 0.61 0.58 0.61 0.62 0.61 0.63 0.63 19 0.29 0.29 0.26 0.30 0.31 0.29 0.29 0.31 20 0.12 0.11 0.11 0.12 0.14 0.12 0.11 0.14
tories was only 8 percent for the paintlpaper samples (high luminance ratios). Since both photometers gave the same results, these differences must have been due to the interaction between the colored paint samples and the different light sources used in the windowless environments and hemispheres, and not due to poten. tial differences in spectral sensitivity for the two photometers. (Laboratory 1 used incandescent sources of illumination, whereas the other laborator- ies all used different types of fluorescent lamps.) A more thorough investigation would be required to determine accurately the magnitudes of photometric errors from colored samples under different light sources using different photometers. In principle, it should be possible to calculate expected differences before measurements are taken.
Conclusions
Keeping in mind the conclusions from Task 1, con- sistent results were obtained from the colored paintlpaper samples where common photometers, lighting geometries, and light sources were employed. Except for one case, the differences in luminance ratio were always less than 3 to 4 percent when these criteria were met, even in the windowless environ- ment. In total, this means that with relatively casual in- structions and moderate care in procedures (e.g., d o not place the photometer too close to the sample) con- trasts can be evaluated consistently as long as precau- tions are taken to limit stray light and to illuminate the sample with a consistent spectral power distribu- tion.
Recommendation
T h e windowless environment avoiding veiling reflections should be used as a working standard for lighting practitioners as long as the spectral power distribution of the light source is defined, the photo- meter is placed far enough away from the sample to avoid casting a shadow o n it, and, following the con- clusions from Task 1, proper evaluation has been made of the influence of stray light o n the measurements.
Task 3
It is necessary to know the contrast of the task under actual viewing conditions in order to predict visual performance in field situations. For routine measurements it is also necessary that the technique be simple to use by relatively inexperienced in- dividuals. Contrast measurements of small targets (e.g., pencil strokes o n a piece of paper) are very dif- ficult o r even impossible to obtain under actual view- ing conditions with a conventional luminance photometer. A comparison method was therefore devised to determine whether accurate contrast
measurements of printed targets, both large and small, could be obtained under realistic viewing con- ditions by inexperienced subjects recruited by the four laboratories.
Subjects were required to match the brightnesses of printed material with standard, matte, achromatic cards. Typically, subjects placed a pair of identical cards close together so that the printed area of in- terest was flanked on two sides by cards of the same luminance. These standard achromatic cards (Munsell matte, neutral cards; 32 steps in value ranging from 1.75 to 9.5) were 38 mm square and thus large enough to permit luminance measurements with a conven- tional hand-held photometer and close-up lens. All photometric measurements for this task were obtain- ed with the inexpensive photometer supplied for Task 2.
Typically, after several iterative comparisons the subject would choose a pair of standard cards that he o r she believed to match, as closely as possible, the brightness of the printed area of interest. Using the hand-held photometer the subject would then make a luminance measurement of one of the matching cards under the same lighting geometry used in making the match. This luminance measurement was followed by another luminance measurement of the actual printed area, if it was sufficiently large. The lumi- nance of small printed areas was never measured directly.
Each of the four laboratories tested ten subjects in the "windowless offices" used for Task 2; all followed the same instructions. The printed materials were presented to subjects in different, unsystematic order. In all, each subject evaluated 16 areas of various col- ors, specularities, and sizes from five printed materials (Table 6). After completing all brightness matches and luminance measurements, taking approximately 45 min, subjects completed a short questionnaire (Ap- pendix 1).
Results
Ten of the 16 printed areas were large enough for direct luminance measurements (Table 6). Every sub- ject provided two estimates of luminance for each of
the ten samples, one from direct measurement of the sample (L,) and another from measurement of a brightness-matched card (L,). The ratio of the LC value to the L, value was calculated for each subject and then used as the dependent variable in an ANOVA for statistical comparison of the four laboratories, the ten samples, and their interaction. Average values of L,IL, are given in Table 7. There were highly significant differences among the laboratories ( p 0.001), but n o significant differences among the printed samples ( p
2
0.4). The interaction among laboratories and samples was not significant( p 2 0.9).
Figure 1 shows the mean values of L,IL, averaged across all subjects. If both luminance estimates were identical, on average, then LcIL, = 1.0. When the ratio was greater than unity, then the luminances ob- tained with the matching method were overestimated in relation to the direct method. As the hand-held photometer used in this task provided luminance measurements consistent with those of the different laboratory photometers used in Task 2, it can be more strongly argued that when the ratios were greater than unity the luminances of sample material were overestimated in the matching method.
The average LJL, ratios for the achromatic samples were, within a few percent, equal to unity. A Tukey test of multiple-paired comparisons showed that there were no statistically significant differences among the luminances of the achromatic samples, and a linear regression revealed a correlation (r2) of 0.99 for the paired LC and L, values (Figure
2).
These results strongly imply that inexperienced subjects can make consistent luminance measurements with a hand-held photometer, and that they can also make ac- cur;ate luminance measurements of achromatic material using the brightness matching method with achromatic standard cards.The luminances, however, of the three blue samples were generally overestimated with the matching technique. The Tukey test showed that luminances of the blue samples were statistically higher than those of the achromatic samples. A linear regression of LC
vs L, values for the blue samples also showed systematically higher luminances for LC than for L,,
as well as a lower correlation between the two
-
T
PRINTED MATERIAL Im
Ae
Im
Cm
DL I
EBLUE ORANGE BLACK WHITE
N O M l N A L SAMPLE C O L O R
Figure 1-Average L,IL, ratios for printed materials of Task 3. Ratios greater than unity (dashed line) represent an overestimation of luminance by the brightness matching technique, relative to the photometric method. The bars represent mean LJL, ratios for the measurement areas of each printed material. Vertical lines extending from the top of the bars represent standard deviations about the means. luminance measurements (r2 = 0.73). Since subjects made accurate luminance measurements of the achromatic samples with a hand-held photometer, it is logical to conclude that the brightness matching of
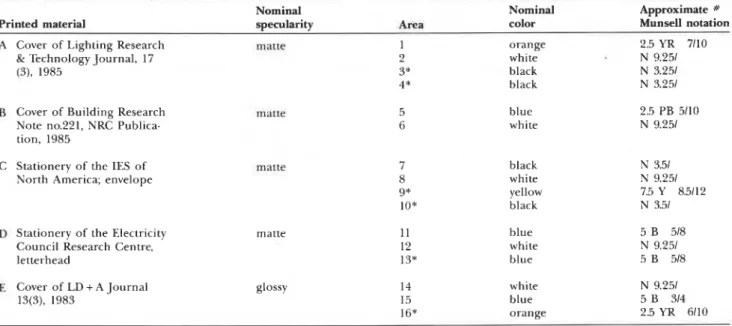
Table 6-Description of samples for Task 3. Asterisk (*) identifies areas too small for conventional photometry
Nominal Nominal Approximate #
Printed material s~ecularitv Area color Munsell notation
'
A Cover of Lighting Research matte& Technology Journal, 17 (3), 1985
orange white black black
R Cover of Building Research Note no.221, NRC Publica- tion, 1985
C Stationery of the IES of North America; envelope
D Stationery of the Electricity Council Research Centre, letterhead matte matte matte blue white 7 black 8 white 9* yellow lo* black 11 blue 12 white 13* blue
E Cover of LD
+
A Journal glossy 14 white N 9.25113(3), 1983 15 blue 5 B 314
16* orange 2.5 YR 6110
# These values represent one of the experimenters matches under cool-white fluorescent illumination and should only be considered as approx- imately correct under other illuminants.
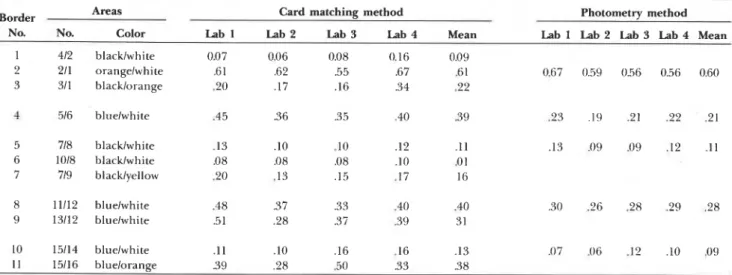
Table 7-Average measured contrast for Task 3 at each luminance border, identified by the dark and light areas on each side of the border. The areas are described more fully in Table 6
Areas
Border Card matching method Photometry method
No. No. Color Lab 1 Lab 2 Lab 3 Lab 4 Mean Lab 1 Lab 2 Lab 3 Lab 4 Mean
1 412 blacklwhite 0.07 0.06 0.08 0.16 0.09
2 211 orangelwhite .6 1 .62 .55 .67 .6 1 0.67 0.59 0.56 0.56 0.60
3 311 blacklorange .20 .17 .16 .34 .22
4 516 bluelwhite .45 .36 .3 5 .40 3 9 .23 .I9 .21 .22 .21
5 718 blacklwhite .13 .10 .10 .I2 . l l .I3 .09 .09 -12 .11
6 1018 blacklwhite .O 8 .0 8 .08 .10 .O 1 7 719 blacklyellow .20 -13 .15 .17 16 8 11112 bluelwhite .48 .37 .33 .40 .40 .30 .26 .28 .29 .28 9 13112 bluelwhite .5 1 .28 .3 7 .39 3 1 10 15114 bluelwhite . l l .10 .16 .I6 .13 .07 .06 .12 .10 .09 11 15116 bluelorange .39 .28 .50 .33 .38
chromatic samples with achromatic standard cards' produced these difficulties. It should be noted, however, that the average L,IL, ratio was close to uni- ty for the orange sample, although the measurements
were more variable (Figures 1 a n d 2). Too few
materials were tested for any general conclusions to be reached about brightness matching of chromatic samples a n d achromatic cards, but earlier published
5 0 1 O C 1 5 0 2 0 0
LUMINAhCE, c d m - 2
M E A S U R E D P H O T O M E T R l C A L L Y
Figure 2-Comparison of the photometric and bright- ness matching methods for determining the lumi- nances of samples described in Table 6. Points lying on the diagonal line represent perfect agreement between the two methods.
results are consistent with those reported In
particular, the earlier studies show that brightnessllu- minance ratios for blues are typically greater than unity. Oranges, o n the other hand, are usually closer to unity.
From the 16 different printed areas, the contrasts of
the 11 luminous borders could be evaluated with the comparison method. Border contrast for the com- parison method was defined as the luminance of the
darker area (LC,) to that of the lighter area (LC,). An
ANOVA was performed o n these ratios and, as ex- pected, the borders were significantly different
( p 5 0.001). T h e four laboratories were also
significantly different ( p
5
0.004), but the interactionbetween laboratories and borders was not. A similar ANOVA using the border contrasts obtained with the direct measurement method was also performed,
however, only five of the 11 borders could be
measured and, therefore, analyzed. For this analysis border contrast was defined as the luminance of darker area (L,,) to that of the lighter area (L,,). Again, the borders a n d the laboratories were significantly different, but in this analysis, the interac- tion between border a n d laboratory was also signifi-
cant ( p 5 0.001). The four laboratories must have
been significantly different d u e to the different spec- tral power distributions of the light sources used in each windowless environment a n d not to differences in their ability to produce accurate luminance measurements, since the laboratories were n o t significantly different in the earlier statistical analysis using L,IL, as the dependent variable. A significant interaction between border a n d sample would also be expected when the spectral power distributions were dissimilar, as was the case for the direct measurement method, since the contrast of the colored samples should be differentially affected by different light sources. T h e interaction may not have been signifi
cant in the ANOVA using the comparison method data due to the greater variability in making luminance matches to the colored samples as discuss- ed previously. Average border contrast values using the two methods are given in Table 7.
An ANOVA was also performed o n those data where contrast measurements could be obtained us- ing both the comparison and the direct measurement methods. As expected from the two previous analyses, the different borders were significantly different ( p
5
0.001) as were the two laboratories ( p 0.02). As also might be inferred from the previous discussion, the two methods were also significantly different ( p5
0.001) because of the overestimation of the luminances of the blue samples using the comparison method. This interpretation was reinforced by the significant ( p 5 0.001) interaction between the bordertype and the method used to make the measurement, indicating that the two methods agreed well for achromatic o r orange samples but differed for the blue samples. (See Table 7.)
Regarding the questionnaire, nearly all subjects found the photometer easy to use but most found the matching method difficult to use for chromatic materials. Matching achromatic samples to the achromatic standard cards was easy for most subjects. Interestingly enough, a few subjects who were ex- perienced in making photometric measurements had significantly lower L,IL, ratios ( p
<
0.039), indicating that trained subjects may make more accurate assessments of luminances of the blue materials. ConclusionsThe luminances of samples large enough for direct measurement with a luminance photometer can be evaluated accurately by most inexperienced in- dividuals. Accurate matching of achromatic standard cards to achromatic printed samples also seems to be a simple task for inexperienced people. Brightness matching of chromatic samples with achromatic cards was less successful; not only was there greater variability in the matches, but the luminances of the blue samples were generally overestimated. Subjects also reported that brightness matching of chromatic samples with achromatic standard cards was difficult. Recommendations
1) When possible, direct measurement of contrast with a luminance photometer should be made of printed materials. As this will be impossible for most reading tasks, another technique must be found for evaluating the luminance of small printed targets.
2) For achromatic materials, the matching techni- que provides results consistent with those for direct measurement. It is reasonable to conclude that, in general, matching achromatic cards with achromatic
printed materials will give satisfactory results. The utility of the matching technique for measuring luminance is clearly questionable, however, when achromatic standard cards are used to evaluate chromatic printed samples.
3) Further work will have to be undertaken before the contrast of small, chromatic printed samples can be measured routinely with confidence. It may be possible to obtain satisfactory results with the mat- ching technique if subjects can be trained to make ac- curate matches between achromatic standard cards and chromatic printed samples. Although less prac- tical, it may be necessary to use a complete array of color standards.
General Discussion
Contrast measurements are rarely, if ever, made by lighting practitioners, although estimates of contrast are specifically required by some lighting sanctioning bodies.' In fact, it is impossible to make contrast measurements of small materials (printed letters o r numbers) under normal viewing conditions with con- ventional photometric equipment. Further, the pro- cedures for making contrast measurements and the accuracy of these measurements have not previously been investigated.
In this report some of the key issues of contrast measurement of realistic printed materials were discussed. Stray light is a significant problem in mak- ing accurate determinations of contrast. Standard procedures should be devised for evaluating the per- formance of luminance photometers and for making contrast measurements of printed materials. Without such standards the accuracy of the reported values can only be uncertain.
A windowless environment without veiling reflec- tions seems to be a practical lighting standard for making contrast measurements in the field, as long as a standard light source is used and precautions are taken to minimize stray light and shadowing.
The matching technique described here for con- trast measurements of small printed materials works well for estimating luminance if achromatic standards are used to match the brightness of achromatic samples. Brightness matching of achromatic stan- dards with some chromatic samples is, however, inac- curate method of evaluating luminance, at least for in- experienced individuals. More work is required before this matching technique can be used routinely with confidence.
Acknowledgements
This study was summarized as a poster presentation at the 21st session of the Commission Internationale de ]'Eclairage, Venice, 1987. The authors wish to thank Peter Boyce, Belinda Collins, and Mike Perry for con-
ducting the various tasks and for discussions of an earlier draft. Thanks are also extended to Alan Robertson for helpful comments. Special thanks are extended to all participants from the four laboratories assisting in this study.
References
1. Blackwell, H.R. and Helms, R.N. 1973. Application procedures for evaluation of veiling reflections in terms of ESI: I. General Principles, J of the IES,
2:(no. 3).
2. ASTM 1968. Standard method of specifying color by the Munsell system, American Standard for Testing of Materials. ASTM D1534-68.
3. Neter, J., and Wasserman, W. 1974. Applied linear statistical models. Illinois: Richard D. Irwin.
4. Howett, G.L. 1986. Linear opponent-colors model optimized for brightness prediction. National Bureau of Standards, Gaithersburg, MD. NBSIR 85-3203.
5. Alman, D.H., Breton, M.E., and Barbour, J. 1983. New results o n the brightness matching of heterochromatic stimuli. J of the IES 7:(no.l).
6.Alman, D.H. 1977. Errors of the photometric system when measuring the brightness of general il- lumination light sources. J of the IES 7:(no.l).
7. Sanders, C.L., and Wyszecki, G. 1958. LIY ratios in terms of CIE-chromaticity coordinates. J. of the Optical Society of America 48(6).
8. Kaufman, J. and Haynes, H. eds. 1981. IES Lighting
Handbook, Application Volume. New York: IESNA.
Appendix 1
Subject Questionnaire for Task 3
Name Age
Time to make measurements
1. How familiar are you with making photometric measurements?
very familiar - I - I
-
I - I - I - I - not at all familiar2. How familiar are you with making measurements for other scientific purposes?
very familiar
-
I - I - I - I - I - I - not at all familiar3. How easy did you find the brightness matching with the reflectance papers?
very easy - I - I - I