HAL Id: cea-02388689
https://hal-cea.archives-ouvertes.fr/cea-02388689
Submitted on 2 Dec 2019HAL is a multi-disciplinary open access archive for the deposit and dissemination of sci-entific research documents, whether they are pub-lished or not. The documents may come from teaching and research institutions in France or abroad, or from public or private research centers.
L’archive ouverte pluridisciplinaire HAL, est destinée au dépôt et à la diffusion de documents scientifiques de niveau recherche, publiés ou non, émanant des établissements d’enseignement et de recherche français ou étrangers, des laboratoires publics ou privés.
A review on clogging of recirculating steam generators
in Pressurized-Water Reactors
Guangze Yang, Véronique Pointeau, Etienne Tevissen, Alexandre Chagnes
To cite this version:
Guangze Yang, Véronique Pointeau, Etienne Tevissen, Alexandre Chagnes. A review on clogging of recirculating steam generators in Pressurized-Water Reactors. Progress in Nuclear Energy, Elsevier, 2017, 97, pp.182-196. �10.1016/j.pnucene.2017.01.010�. �cea-02388689�
1
A review on clogging of recirculating steam generators in
Pressurized-Water Reactors
Guangze Yanga, Véronique Pointeaua,*, Etienne Tevissena and Alexandre Chagnes b,**
a
CEA Cadarache, Saint Paul lez Durance 13115, France
b
Chimie ParisTech, PSL Research University, CNRS, Institut de Recherche de Chimie Paris (IRCP), Paris 75005, France
Abstract
Corrosion product deposits in the secondary side of nuclear power plant steam generators may result in Tube Support Plate (TSP) clogging and tube fouling. Magnetite has an inverse solubility above 150 °C, which favours iron precipitation when temperature increases. Flashing and electrokinetics are two strengthening processes for precipitation in TSP clogging. Surface chemistry of magnetite particles was discussed to understand its’
interaction with TSP. Particle deposition by boiling was identified as the limiting process by performing numerical applications with nominal conditions. Guidelines drawn from this review for investigating specifically TSP clogging consist on conducting representative condition experiments and electrokinetics investigations.
Corresponding authors: *: [email protected]
Keywords
Iron; Reactor conditions; High-temperature-high-pressure test loop; Modelling studies; Precipitation; Magnetite particle deposition.
2
Nomenclature
Abbreviations
XRD: X-ray Diffraction
GDOES: Glow Discharge Optical Emission Spectrometry AFM: Atomic Force Microscopy
WRL: Wide Range Level EDL: Electrical Double Layer FAC: Flow Accelerated Corrosion NPP: Nuclear Power Plant
TSP: Tube Support Plate SG: Steam Generator
SCC: Stress Corrosion Cracking PZC: Point of Zero Charge EDF: Electricité De France
AECL: Atomic Energy of Canada Limited EPRI: Electric Power Research Institute SGOG: Steam Generator Owners’ Group HTCC: High Temperature Chemical Cleaning ASCA: Advanced Scale Conditioning Agents DMT: Deposit Minimization Treatment
PACCO: Preventive Acid Chemical Cleaning Operation
Roman symbols
a = modelling coefficient
g = standard gravity constant (9.8 m/s2) Cp = particle concentration (kg/kg) Cl = mass fraction of liquid phase Cg = mass fraction of vapour phase Cb = ion concentration in the bulk (kg/m3)
Ci = ion concentration at the solid-liquid interface (kg/m3) Cs = saturation concentration (kg/m3)
E = activation energy (J/mole) Er = re-entrainment rate (s-1) Hlg = heat of vaporization (J/kg)
ΔHl = enthalpy variation of liquid phase (J/kg) S = solubility of soluble species (kg/kg) Tl = fluid temperature (K)
Ts = surface temperature (K) Sc = Schmidt number of particles Rel = Reynolds number of liquid phase Dp = diffusion coefficient of particles (m2/s) U = friction velocity (m/s)
Ul = average velocity of liquid phase (m/s) R = universal gas constant (8.314 J/mole/K)
N = function of the nucleation sites provided by particles Mf = mass of deposit at time t (kg)
Mfg = mass of deposit at the start of crystal growth (kg)
K0 = constant (m/s)
Kd = particle deposition rate (m/s)
Kd(1φ) = particle deposition rate for one-phase flow (m/s) Kd (2φ) = particle deposition rate for two-phase flow (m/s)
3
Kt = particle transport rate (m/s) Ka = particle attachment rate (m/s)
Kb = deposition rate due to boiling process (m/s) Kdiff = diffusion rate (m/s)
Ks = sedimentation rate (m/s) Ki = inertial rate (m/s)
Kth = thermophoresis rate (m/s) Kt,s = soluble iron transport rate (m/s) Kb,s = soluble iron precipitation rate (m/s)
Kv,p = particle deposition rate in “vena contracta” mechanism (m/s) Kr = reaction rate constant (m4/kg s, if n = 2)
md = deposit mass (kg/m2)
m’ = deposit mass by crystallization fouling (kg/m2) t = time (s) n = order of reaction n’= exponent kb = Boltzmann constant (1.38 x 10⁻²³ J.K-1) tp+ = relaxation time Greek letters
β = mass transfer coefficient (m/s)
ρp/l = particle/fluid density (kg/m3)
ρm = average density of liquid/gas mixture (kg/m3) dp = particle diameter (m)
μl = dynamic viscosity of fluid (kg/m/s)
νl = kinematic viscosity of fluid (m2/s)φw = heat flux (W/m2)
φl = mass flux of liquid (kg/s)
φs = mass flux of soluble specie precipitation (kg/s)
λp = particle thermal conductivity (W/m/K)
λl = fluid thermal conductivity (W/m/K)
1. Introduction
Électricité de France (EDF) nowadays operates 58 Pressurized Water Reactors (PWR) that produce more than sixty-three thousand megawatts of installed power capacity and more than 85% of electricity in France [1]. Safety and performance of these reactors are crucial targets to ensure electrical supply to the whole national territory. Steam generators (SG) play a crucial role as a heat exchanger from the primary to the secondary flow and as one of the three safety barriers.
The steam generators in PWRs are shell-and-tube heat exchangers that use the heat from the primary reactor coolant to make steam to drive turbine generators. Figure 1 presents a cross-section of a simplified PWR recirculating steam generator. In this design, the tube bundle consists of 3000-6000 individual tubes, each welded to a thick plate (called a tube support plate (TSP)) with a hole for each tube. Secondary flow enters in SG at about 220 °C in liquid phase and exits at about 280 °C in dry steam.
4
Figure 1: PWR recirculating steam generator [1]
Steam generator in pressurized-water reactors are manufactured using materials susceptible to various forms of degradation [2]. Carbon steel, present in large numbers of pipes upstream of SG, is mainly affected by accelerated flow corrosion (FAC); SG tube materials, including alloy 600, alloy 690 and alloy 690 TT, can be affected by pitting, thinning, and intergranular stress corrosion cracking; TSP, actually made of stainless steel (13% Cr), can be affected by TSP clogging or TSP blockage phenomenon. In the early 1990’s, SG water oscillations were observed at Surry Power Units 1 and 2 in Virginia, at Kori Units 3 and 4 and Yongwang Units 1 and 2 in Korea [3,4]. This phenomenon was caused by a severe deposit build-up in the TSP quatrefoil-shaped holes. EDF Nuclear Power Plants (NPPs) have been recently affected by the same phenomenon. Between 2004 and 2006, three primary-to-secondary leaks occurred in
NPP located in Cruas (France). In-situ investigations showed that the flow holes of the uppermost TSP (8th
TSP in SG 51B) were partially or completely clogged by corrosion products [5,6] (Figure 2). This phenomenon is referred as so-called TSP clogging or TSP blockage and it was considered potentially generic for EDF NPPs.
Figure 2: Photo of TSP clogging: top view of a « clean » flow hole on the left and an entirely clogged flow hole on the right side [1].
Tube fouling (Figure 3) is a deposit on the tube surfaces which is penalizing for the heat exchanges between the primary and the secondary circuits [7,8]. Tube fouling can also induce a decrease in outlet steam pressure and a loss of efficiency of steam generators.
5
Figure 3: Photo of SG tube fouling [1].
TSP blockage is a deposit at the inlet of TSP flow holes. This phenomenon can induce high velocity zones and transverse velocities in the secondary flow, which can imply flow induced vibrations, tube cracks and leaks in some cases as it was observed in the NPP located in Cruas (France) as described above. TSP clogging phenomena can also decrease the circulation ratio of the steam generator, and therefore, the volume of water available for cooling the secondary side of the steam generator. Thus, fouling and clogging phenomena in nuclear steam generators may lead to dramatic consequences for NPP operation and may lead to safety issues [6].
In order to prevent these phenomena, various countermeasures, especially chemical or mechanical cleaning and high pH water treatment of the secondary circuit, are being implemented by EDF. Such countermeasures were found effective by foreign reactor operators who also detected these types of deposits in the 80s and 90s [9–11]. Two main processes of curative chemical cleaning are used by EDF in order to remove up to 2000 kg of deposits per SG: EPRI-SGOG and HTCC, developed by Westinghouse and Areva, respectively [6]. Three preventive chemical cleaning processes also exist which allow removing between 200 to 1000 kg of deposits per SG: ASCA, DMT and PACCO developed by Westinghouse, Areva and Comex-Lainsa, respectively [12]. The reader could find detailed information about these processes in ref. [9,12–14].
Chemical cleaning is currently the main effective method to remove most of the deposits in steam
generators. Nevertheless, it remains costly, difficult to perform and may damage certain parts of the stream generators due to the corrosive properties of the chemical cleaning solution [15]. Therefore, it appears of great interest to investigate alternative solutions to avoid TSP clogging and fouling. For this aim, it is
obviously mandatory to understand the phenomena responsible for clogging and fouling. In this context, an extensive research program was engaged in 2008 by EDF [5]. In particular, this program pays attention to thoroughly understand TSP clogging by investigating the driving mechanisms and the role of local
thermohydraulic and chemical parameters.
The present paper presents the reported situation on NPP’s fleet regarding TSP blockage and fouling and the state of the art of TSP blockage by previous numerical and experimental works, carried out in France as well as abroad. Main focuses will be given to the formation mechanisms of TSP blockage, including particle deposition and soluble species precipitation, and the role of different parameters. In the following chapter, feedbacks on the French NPPs will be discussed.
2. Fouling and TSP clogging of the French NPP fleet: Feedback analysis
2.1. SG Fouling
Fouling is usually caused by iron oxides deposition upon the surface of the SG tubes. It increases the thermal resistance of the tubes and consequently degrades the steam generator energetic performance. Plant operators need to gradually increase the opening of the steam line valve at the steam generators outlets to compensate for the lowering of pressure in the dome, until they sometimes reach the maximum
6
opening. Fouling phenomena are indirectly demonstrated in EDF NPP by measuring the SG pressure evolution and by calculating oxide mass balance.
Pujet [16] mentioned an accumulation of deposits of 200 kg per cycle per SG, which corresponds to a fouling rate of about 10 µm/year providing that the deposit is considered uniformly distributed onto the SG tubes. This estimation is in agreement with the fouling rate found by other NPP operators (0.1-10 µm/month depending on the tranche, the operating period and the location in the SG [2]). Pujet [16] found that
magnetite (Fe3O4) is the main chemical compound found in the fouling deposits of 12 NPP operating in France between 1993 and 1997 as it was also reported by other operators in other countries [17].
A relationship between fouling and secondary water conditioning was reported in the work of Corredera et
al. [5] For instance, higher pressure drop was observed when NPPs operate at pH25 °C=9.2 (pH at 25 °C)
instead of pH25 °C=9.6 in the presence of morpholine or at pH25°C=9.7 in the presence of ammonia. Likewise, among the 22 plants operating at low pH, ten of them exhibited a significant fouling in 2007 (all of them were running for 22 to 28 years with original SG). A relationship between fouling and the amount of corrosion products were also established since high quantities of corrosion products and high fouling level were observed in NPPs operating at low pH.
Except the straightforward observations mentioned above, fouling phenomena must still be thoroughly investigated since different fouling levels are observed in NPPs operating under similar conditions.
2.2. TSP clogging
2.2.1. Assessment of TSP clogging level
After the two emergency issues occurring in the French NPP located in Cruas in 2004 and 2006, EDF launched a research program to develop methods for diagnosing TSP clogging in steam generators. The main obstacle to perform accurate diagnosis of TSP clogging lies in the difficulty to observe inside the SG during operation and the absence of internal sensors [18,19].
Three different methods have been implemented to diagnosis TSP clogging by EDF [5,18,20,21]:
Televisual inspections
Televisual inspections are conducted by introducing monitoring devices holding video cameras into steam generators through their upper openings. Televisual inspections are time-consuming and the sampling analysis is limited since only one hole per tube can be inspected at a time whereas the EDF maintenance objective is to inspect 90 holes by SG [18]. For a sake of illustration, a 51B type SG has 3330 U-tubes, each surrounded by 4 quatrefoil holes which sums to a total of 3330 x 2 x 4 = 26640 holes in the uppermost plate.
Wide Range Level (WRL) monitoring in stationary regime
This method is based on recording the pressure difference between the top and the bottom of SG, which is a global thermohydraulic parameter directly linked with the magnitude of TSP clogging. The main limitation of this method is that WRL can give neither a precise idea of TSP blockage distribution nor a quantitative assessment. Therefore, this method is only used by EDF as a supplementary assessment method to televisual inspections [5].
Eddy Current probes
Eddy Current probes give access to the vertical repartition of TSP clogging [22]. However, this method is restricted to the observation of blockage levels greater than 50% [5].
7
Girard [23,24] developed a new diagnosis method in 2012 based on the analysis of the WRL dynamic response to power transients in dynamic regimes. This new method gives access to additional sensitivity information that can be used to avoid bias and uncertainties in the vertical distribution of the SG deposit.
2.2.2 TSP clogging feedbacks
In 2008, EDF published a report on TSP clogging assessment results for 900 MW NPPs equipped with 51B or 51BI SG [5]. In this study, no deposit was collected and only televisual inspections were performed. NPP located in Cruas (France) exhibited the greatest TSP clogging level likely due to the low pH value in the SG generator of Cruas NPP. Indeed, the pH25 °C was equal to 9.14 in Cruas NPP while operating pH25 °C was equal to 9.6 in other NPPs that were not affected by TSP clogging. From this feedback results, EDF concluded that low pH value of the fluid in SG may influence dramatically TSP blockage. Oxidizing conditions were also considered as an aggravating factor. However, the impact of oxidizing conditions on TSP blockage may be lower than the pH as oxidizing condition is responsible for the oxidation of magnetite into hematite which could be harder and less susceptible to be re-entrained [5][25]. Likewise, impurities such as silicon and calcium may have a negative impact since these elements can play a role in deposit consolidation [26].
Furthermore, examination of the morphology of the deposit at the inlet of the flow holes showed more clogging at the uppermost TSP and even more at the periphery than at the centre of the TSP as well as at the hot leg of SG [15].
2.3. Conclusions of NPP field experience analysis regarding fouling and TSP clogging
The NPP feedbacks regarding fouling and TSP blockage presented previously are not intended to be exhaustive or exclusive because of the limitation of available data about NPP. However, the following main conclusions can be drawn for these data:
A low pH is an aggravating factor for fouling and TSP blockage.
The main compound found in materials responsible for fouling and TSP blockage is magnetite
(Fe3O4).
The main sources of fouling and TSP blockage are corrosion products arising from the secondary
circuit.
TSP blockage is more important on the hot leg than on the cold leg, at the top than at the bottom of
SG and at the periphery than at the centre at the upper TSP.
TSP blockage has a lipping form at the inlet of flow holes.
All plants affected by a significant TSP blockage are facing SG fouling. Conversely, a plant may be
heavily fouled while showing a moderate rate of TSP blockage.
SG fouling and TSP blockage could be avoided or limited providing that feedback analysis about NPP are completed by a fine comprehension of the physical and chemical phenomena responsible for fouling and TSP blockage. For this aim, the phenomenology of these processes is addressed in the following
paragraphs.
3. Phenomenology
As mentioned previously, carbon steel components at the upstream of SG can undergo corrosion
phenomena called flow accelerated corrosion (FAC) [27–30]. FAC normally occurs in turbulent flow regions where the high flow rate accelerates dissolution of the protective oxide film on carbon steel materials. Indeed, various authors showed by using the Pourbaix diagram [2,31–34] that iron is oxidized into
8
magnetite around 200 °C and pH200 °C>6 (pH25 °C>9) in deionized and degassed water (Eh = -0.4 V) according to the following reaction (Figure 4):
3𝐹𝑒(𝑠)+ 4𝐻2𝑂(𝑙)↔ 𝐹𝑒3𝑂4(𝑠)+ 4𝐻2(𝑔) (𝐸𝑞. 𝐼)
Figure 4: Pourbaix diagram for iron at 200 °C calculated with PHREEQCEA; pH25 °C>9 corresponds to pH200 °C>6.
Magnetite dissolution can then occur at oxide-water interface with dihydrogen diffusing through oxide layer pores following the Sweeton and Baes reaction [2] :
𝐹𝑒3𝑂4(𝑠) + 3(2 − 𝑏)𝐻++ 𝐻
2(𝑔) ↔ 3𝐹𝑒(𝑂𝐻)𝑏(2−𝑏)++ (4 − 3𝑏)𝐻2𝑂(𝑙) (𝐸𝑞. 𝐼𝐼) where b = 0,1,2,3.
Finally, Fe (II) soluble species are carried into SG. Meanwhile, the protective magnetite layer formed by reaction (I) may be eroded into magnetite particles, which can be carried by the fluid. The range of magnetite particle size varies between 1 to 3 µm in ammonia conditions and 0.1 to 0.5 µm in morpholine conditions according to EPRI measurements in NPP [2].
The main factors of FAC are temperature, pH and dissolved oxygen, chemical composition of carbon steel and fluid dynamics [28]. Effects of temperature and pH will be discussed later in the section describing magnetite solubility. Concerning the dissolved oxygen, FAC of the feedtrain is inhibited when oxygen concentration is greater than 5 ppb in the secondary circuit [35–38]. The chemical composition of carbon steel also affects FAC rate. Likewise, Tsuruta et al. [39] showed that the chemical composition of carbon steel also affects FAC rate. Indeed, the addition of 1 wt% Cr in carbon steel decreases the FAC rate by one order of magnitude. The increase of chromium content decreases oxide layer porosity, making oxide layer less soluble than neat magnetite [42]. Finally, thermohydraulic effects cannot be neglected since FAC is increased by strong turbulences. Thus, regions with geometrical singularities, i.e. bends and TSP, promote FAC. EDF progressively replaces carbon steel in these regions by stainless steel, which is less affected by FAC in nuclear power plants [42–47]. Nowadays, the most recent EDF TSPs are made of 13 wt% Cr stainless steel [2,48]. Surface roughness is considered to have similar effects because of the creation of local turbulences. Fluid velocity is also an encouraging factor, which accelerates ferrous iron transport into the fluid and shifts the equilibrium of reaction (II) towards magnetite dissolution.
9
Soluble iron species and magnetite particles carried into SG are considered the source terms of SG deposit phenomena. In a general point of view, SG deposit formation can be summarized by two main mechanisms as illustrated in Figure 5: soluble iron precipitation and particle deposition.
Figure 5: Phenomena governing SG deposits 3.1. Chemical phenomenology – soluble iron precipitation
3.1.1. Mechanism studies
Iron ions produced by FAC mechanism can precipitate on SG surfaces, forming SG deposits. This
phenomenon is also called “crystallization fouling” [49–51]. The precipitation reaction is actually the reverse equilibrium of magnetite dissolution reported in Eq. (II).
Crystallization fouling describes the deposits formed on the surface itself, tenacious and difficult to remove. On the other hand, the term “sludge” is often used to describe crystals of softer deposits formed in the bulk liquid, which arrive at the surface as particles and accumulate in a loose agglomeration rather than in a more oriented matrix.
Crystallization fouling involves three basic steps: attainment of supersaturation, formation of nuclei and growth of crystals [52]. The effects of temperature, pH, presence of particles, surface conditions and electrokinetic mechanism are discussed in the following paragraphs.
3.1.1.1. Attainment of supersaturation- magnetite solubility
Supersaturation can be reached [51] (i) by decreasing the fluid temperature in the presence of normal solubility salts, i.e. salts exhibiting an increase of their solubility when temperature increases, (ii) by
increasing the fluid temperature in the presence of inverse solubility salts, i.e. salts exhibiting a decrease of their solubility when temperatures increases, (iii) by evaporating the fluid in order to reach the solubility limit, and (iv) by changing the pH.
Therefore, the investigation of influence of pH and temperature on the magnetite solubility in SG is of great interest.
Numerous studies showed that magnetite solubility decreases with an increase in pH up to 11 at 25 °C [27,28,53,54]. Similar evolutions have been found at higher temperatures up to 150 °C [31]. For instance, a local increase of pH25 °C from 9.0 to 9.6 induces a decrease of magnetite solubility from 11 to 1 ppb when the solution is conditioned by morpholine and ammonia. Such a decrease of magnetite solubility favours supersaturation attainment, and thus crystallization fouling. However, an increase of the pH is advisable in order to decrease both the FAC rate and the initial concentration of soluble species at the inlet of SG (Eq. II) [5].
As shown in Eq. (II), soluble species can also precipitate when the local pH is too high. Therefore, in order to avoid a local increase of the pH, French NPP operators use volatile amines such as morpholine,
10
ammonia and ethanolamine, Among these three amines, morpholine exhibits the best water/vapour partition coefficient of 1 [55].
Temperature also influences the magnetite solubility. In previous studies, some authors investigated the variation of FAC for carbon steel under single-phase flow and found that the maximum FAC rate occurs at temperatures ranging from 130 °C and 150 °C in neutral and alkaline solutions (7 < pH25 °C < 9) [53,56,57] while the maximum FAC rate of carbon steel in two-phase flow was observed at about 180 °C [58]. Conversely, De Bouvier [40] recently reported that the maximum of FAC rate occurs between 150 °C and 180 °C. Therefore, the highest solubility of magnitude is expected between 150 °C and 180 °C as the greatest FAC rate temperature matches with the maximum of magnetite solubility [5]. It was observed that the maximum of solubility is located at about 150 °C whatever the pH ranging from 8.75 and 9.60 in the presence of ammonia at 0.1 and 2 ppm, respectively. Above 150 °C, magnetite solubility decreases with an increase of temperature.
The tube fouling phenomenon in the secondary circuit is particularly affected by supersaturation resulting from the heating effect of the primary flow circulating inside the SG tubes.
In SG, the temperature of secondary flow varies from 220 to 280 °C. At these temperatures, boiling occurs in the secondary circuit besides the heating effect. Vapour formation will favour the attainment of
supersaturation by concentrating the solution. Moreover, magnetite precipitation in Eq. (II) is increased by the boiling which encourages dihydrogen gassing. More TSP blockage is observed at the top of SG likely due to the boiling process in the uppermost regions and the “flashing” phenomenon (more details in section 4).
3.1.1.2. Formation of nuclei
Formation of nuclei (also called nucleation) refers to the process by which the smallest stable aggregates of a crystalline phase are formed in a crystallization system. Nucleation is influenced by the presence of impurities and surface properties such as roughness [52]. These aggregates act as building blocks for crystal formation. Factors that can speed up nucleation include the presence of impurities and the surface conditions [52].
The effect of the presence of particles on fouling due to calcium sulphate or sodium aluminium silicate crystallization onto a plate heat exchanger has been reviewed by Bansal et al. [51]. The solution containing soluble species was conditioned between 40 and 55 °C. It appears that crystallization rate usually
increases in the presence of particles likely because crystalline particles in solution play the role of nucleation sites [60]. Depending on the turbulence phenomena, some of the particles are able to settle in the regions where the conditions are not conducive to crystallization such as high turbulent regions like in the inlet of TSP. Later in the present paper, a specific TSP clogging model including particle effect will be presented and applied to the inlet of TSP.
An inverse effect of the presence of particles as seeds on crystallization rate has also been mentioned [61,62]. Indeed, the introduction of seeds is usual in many industrial applications to achieve crystallization on these seeds in the bulk, decreasing available soluble species and preventing fouling on the heat transfer surfaces [51]. For instance, it has been reported that calcium sulphate deposits have been prevented in sodium chloride salt plants by maintaining about 20 grams per litter of calcium sulphate solids in
suspension [51].
These competing effects make it difficult to define the role of particles in soluble species precipitation mechanism. However, most of the recent studies showed a benefit effect of the presence of particles to fouling formation [63–66].
11
Surface morphology effect on calcium carbonate crystallization fouling was experimentally studied by Lei et al. [50]. They highlighted that the fouling weight became five times more when the average surface
roughness varied from 0.1 to 0.3 μm. From this study, the authors demonstrated that a mirror smooth
sample leads to the best antifouling surface.
3.1.1.3. Growth of crystals
Nucleation is followed by crystal growth. Minute crystal particles that are formed during nucleation
subsequently grow into crystals. In general, two main mechanisms are considered [51,52]: transport of ions from the bulk to the liquid-crystal interface and surface integration of ions into the crystal lattice.
Electrokinetic mechanism seems to affect the growth of crystals. Electrokinetic phenomenon only occurs in the presence of a charge fluid or a charged surface as well as when the fluid velocity changes. At the
surface of an ionic fluid and charged solid, a charge zone called Electrical Double Layer (EDL) appears [67]. This latter is constituted of two zones of opposite sign, i.e. one in the solid and another one in the liquid. When the liquid’s velocity changes, there is a disturbance of the EDL responsible for local surface charge variation. This is the so-called electrokinetic phenomenon. In the case of TSP blockage, both non clogged and magnetite clogged TSP are charged negatively under SG conditions [68].
Thus, a fluid layer constituted of positive charge is created onto the TSP surface. At the inlet of TSP, the fluid accelerates due to the geometry at the vicinity of TSP, which induces a flux of positive ions in the same direction as the fluid in the EDL. Consequently, TSP surface becomes negatively charged, favouring the transport of Fe(II) cations from the bulk to TSP and its precipitation onto the TSP surface.
Scenini et al. [69] recently investigated the role of electrokinetic effects in corrosion deposit formation in primary circuit. A miniature flow cell was designed in order to accelerate fluid flow and produce negatively charged regions onto electrodes evidenced by recording polarization curves. X-Ray Diffraction (XRD) and Glow Discharge Optical Emission GDOES analyses of the polarized electrodes showed that anodic
processes resulting from electrokinetic phenomena can increase oxide deposition by a factor of 12. Similar tests could be envisaged in secondary circuit conditions to investigate the contribution of electrokinetic mechanism to TSP blockage.
3.1.2. Crystallization fouling models
The “classical” modelling approach for crystallization fouling does not take into account the nucleation step but considers only crystal growth. In this approach, the precipitation rate can be transport controlled, surface reaction controlled, or a combination of both [51].
Transport of ions is estimated by [52]:
𝑑𝑚′ 𝑑𝑡
⁄ = 𝛽(𝐶𝑏− 𝐶𝑖) (1) Reaction-controlled rate is modelled by [51,52]:
𝑑𝑚′ 𝑑𝑡
⁄ = 𝐾𝑟 (𝐶𝑖− 𝐶𝑠)𝑛 (2)
where m’ is the mass deposited per unit area, Cb is the concentration of the ions in the bulk, Ci is the
concentration of the ions at the solid-liquid interface, Cs is the saturation concentration, is the mass
transfer coefficient, Kr is the reaction rate constant and n is the order of reaction.
12 𝐾𝑟 = 𝐾0 exp (−𝐸/𝑅𝑇𝑠) (3)
where K0, E and R stand for the Arrhenius constant, activation energy and gas constant, respectively.
The “classical” deposition rate law approach discussed above does not consider the effect of nucleation even though such an effect is known to have a major impact on crystallization. The presence of particles in the process solution and the increasing amount of crystalline deposits onto the surface have been identified as the sources of nucleation sites and modelled in a modified deposition rate law by Bansal et al. [51] in the case of calcium sulphate precipitation. Considering the precipitation is reaction controlled, the modified deposition rate is expressed as:
𝑑𝑚′ 𝑑𝑡
⁄ = 𝐾𝑟 (𝐶𝑖− 𝐶𝑠)𝑛𝑁(𝑀𝑓⁄𝑀𝑓𝑔)𝑛′ (4)
where N is a dimensionless function of the nucleation sites provided by particles present in the process solution, Mfg denoted the total deposit mass when the crystal growth starts and Mf represents the total deposit mass at time t .
No clear explanation is given regarding the value of N in the work of Bansal et al. [51]. N = 1 was chosen when the particles present in the process solution were filtered out by the 1 μm in-line filter. Thus, particle size seems to be related to this value. The value of n’ depends on the fouling conditions. For cases where new deposits keep on growing on the top of the existing ones, the increase in the deposit mass may have a little impact, i.e. low value of n’ are used in Eq. (4). In contrast, when the deposits spread along the surface, the increase in the deposit mass may have a stronger effect on the deposition rate and high value of n are used in Eq. (4). No value of n’ is proposed by Bansal et al. [51] whereas Smith and Sweett [71] proposed a value of 2/3 in a similar model for calcium sulphate precipitation.
This modified model seems to be the most developed model for crystallization fouling in the literature as it includes the effect of the presence of particles and the effect of deposit build up. However, many other processes or parameters, like supersaturation attainment, boiling, electrokinetic mechanism, deposit dissolution and initial surface roughness, are not taken into account, which add further complications to the basic concepts already discussed [49].
3.1.3. Surface chemistry of magnetite particles
Papers indicate that the surface interaction force is dominated by the Van der Waals attraction and the diffuse layer repulsion in the absence of steric hindrance and strong solvation force [72–74]. In a SG system, particles are transported from the bulk to the surface. If the particle and the substrate are oppositely charged, there would be no diffuse layer repulsion and the particle deposition rate would be equal to the mass transfer rate. If the particle and the surface have the same sign of charge, the diffuse layer repulsive force would decrease the deposition rate. In this particular case, the deposition rate is lower than the mass transfer rate.
The sign of the charge on the surface of a metal oxide at any given pH is determined by the point of zero charge (PZC) [75]. The surface is negative when the pH is greater than the PZC and positive when the pH is lower than the PZC. There are only very limited experimental data on the temperature dependence of the PZC of iron oxides, and almost all experimental data are limited to temperatures below 95 °C. Tewari and Mclean [76] firstly reported that the PZC of magnetite is equal to 6.5 at 25 °C. Sankaya [77] proposed a PZC value of magnetite equal to 5 at 25 °C. Schoonen [78] predicted that the PZCs for magnetite and hematite at 270 °C are equal to 4.6 and 6.7, respectively. In a recent study, Barale et al. [68] measured between 5 and 320 °C the PZCs of typical oxides (magnetite (Fe3O4), nickel ferrite (NiFe2O4) and cobalt ferrite (CoFe2O4) recovered from PWR primary circuits . They gave PZC values of magnetite of 5.2 and 5.9
13
at 250 °C and 285 °C, respectively. PWR secondary water is conditioned at pH25 °C > 9, which corresponds to a pHvalue from 6 to 7 between 200 and 285 °C [2,40]. At these pH,, magnetite particles are predicted to be negatively charged as well as the surface of Alloy 600 and TSP under SG conditions [15,79,80].
Therefore, magnetite particles may be repelled from SG tubes and TSP. Conversely, feedbacks show that magnetite particles are deposited onto SG tubes and TSP. Thus, the attachment step is really essential to predict magnetite particle deposition.
Delaunay [81] studied the effects of the presence of impurities on magnetite surface charge by sorption experiments. Suspension of magnetite particles containing impurities such as Cu, Zn and Al were prepared in alkaline media for zeta potential measurements at 25 °C. Zetametry measurements showed that the addition of impurities induces changes in magnetite surface charge from negative to neutral values or even positive values. The presence of impurities may thus decrease repulsive effects between magnetite
particles and TSP or SG tubes, and then encourage deposition phenomenon.
Burrill [82] studied the effect of temperature on magnetite particle deposition onto Zircaloy-4 tubes from 28 °C to 80 °C at pH 10 at magnetite concentration of 350 ppm. He stated that an increase of fluid temperature is responsible for an increase of the deposition rate. However, the electrostatic repulsion should tend to be more important and decrease the deposition rate as the zeta potential of magnetite increases with the temperature [76]. Burrill explained this encouraging effect of temperature to the increase of the number of particles smashing onto the surface at high temperature.
AECL investigated the effect of amines on the tube fouling rate [79,83] from 1994 to 2000. It was
postulated that the amine, used for pH control, are absorbed onto the surface of magnetite and changes its surface potential. The magnetite deposition rate onto Alloy 600 may be decreased in the presence of amine because protonated amine adsorbed onto magnetite particles diminishes the repulsion force between magnetite (negatively charged) and Alloy 600 (negatively charged) by increasing the surface charge of magnetite particles [84]. The measurements were performed in a high-temperature recirculating loop, which allowed to produce nominal experimental conditions (T = 270 °C, P = 5.6 bars) and steam quality at test section varying from 25% to 51%. During each experiment, a suspension of radioactive magnetite particles was continuously injected into the loop, and the deposition of colloidal particles onto the test section was
monitored by on-line γ-ray detector. The AECL experimental loop has been found to be the most
performant facility regarding the high-pressure and high-temperature capabilities by a review of existing experimental loops in the literature. Although the achieved conditions are still different from the
characterized ones of most TSP blockage configuration (T = 277.2 °C, P = 61.5 bars, void fraction = 85%), the results obtained with this loop seem to be the best ones for an extrapolation to TSP blockage compared to other conducted experimental studies. The reader can get more details about this experimental loop in the report written by Turner et al. [83].
Deposition rates of magnetite onto Alloy 600 surfaces were measured by means of this high-temperature loop. The effect on two parameters on the deposition rates was studied:
Tube surface morphology
Amines used for pH control (morpholine, ethanolamine, ammonia and dimethylamine)
The main conclusions drawn from this work are [83]:
The nature of the amine used for pH control affects the magnetite deposition rate.
The deposition rate of magnetite increases with increasing concentration of amine at constant pH.
The particle deposition rate can be affected by the tube surface morphology, i.e. the rate is significantly higher on surfaces covered with porous deposits.
The heat transfer mechanism and the steam quality strongly affect the deposition rate, i.e. the
14
AECL undertook a follow-up program around 2000 to confirm that amine adsorption affects the particle deposition rate by altering the surface interaction potential between the particles and the surface of Alloy 600 [79]. This program included investigation of amine adsorption onto magnetite surface by Laser Raman spectroscopy and determination of the effect of amine adsorption on the surface potential by means of electrophoretic mobility measurement and Atomic Force Microscopy (AFM). This study was finally completed by performing high-temperature loop tests.
The main conclusion is that amines exhibiting the highest base strength (to reduce the concentration of amine required to achieve the target pH) and the largest molecular size (to obtain a large footprint on the surface of magnetite and to reduce the amount of adsorption for a given amine concentration) lead to weak adsorption onto magnetite particles and low deposition rate. However, it seems difficult to identify an amine which fulfils all the criteria. For example, low amine adsorption is obtained with morpholine due to its large molecular size but this molecule is not perfect because of its relatively low base strength. Finally, loop tests highlighted in this study that morpholine is responsible for more deposition than ammonia at the same pH. The same study with ethanolamine was performed by the authors but data are not available in the literature. One should notice that low adsorption onto magnetite particles is not the only criterion to select amines. For example, the presence of copper in the alloys, which is susceptible to induce ammonia corrosion by
forming a stable complex Cu(NH3)62+, will limit enormously the use of ammonia [55,85]. AECL established a
test to evaluate the deposit-control properties of amines or other chemicals in the PWR secondary water chemistry. They provided a large amount of interesting results for understanding the amine effect on magnetite deposition onto alloys surface in order to describe fouling phenomenon [5]. More NPP field data should be collected to thoroughly compare the morpholine and ammonia chemistry as no obvious
difference has been observed when morpholine or ammonia are used at the same pH in plants [5]. Concerning the possibility of extrapolating these results to TSP blockage, it is too premature to predict amine effect before well determining TSP blockage formation mechanisms. Representative loop tests at the 8th TSP are necessary for validation as well.
3.2. Physical phenomenology – magnetite particle deposition
Large numbers of studies have been carried out from the 1980s on magnetite particle deposition following the detection of SG fouling and TSP clogging. It is fairly well established that deposition of colloidal
particles onto a surface in forced convective regime is a two-step process occurring in series [84,86]: the transport of particles from the bulk of the liquid to the vicinity of surface and their attachment [82,87]. Burrill [82,88] found that the deposition rate onto SG tubes increases linearly with magnetite concentration
up to 300 ppm at 25 °C, pH 7 and with Reynolds number of 1.2 x 10⁵. A number of studies of magnetite
concentration effect under boiling water reactor conditions showed similar trend [89–94]. Based on this linear dependency with the concentration in the bulk Cp, the particle deposition quantity is generally expressed by [84,86]: 𝑚𝑑(𝑡) = 𝜌𝑙𝐶𝑝𝐾𝑑𝑡 (5) With, 1 𝐾𝑑 ⁄ = 1 𝐾 𝑡 ⁄ + 1 𝐾⁄ (6)𝑎
Turner and Godin [84] highlighted the potential influence of particle surface charge on deposition. If the particle and surface have the same sign of surface charge, then the particle deposition rate can be limited by the rate of attachment (Kt >> Ka). Conversely, if the particle and surface have surface charges of
15
opposite sign, then the rate of deposition can be limited by the particle transport rate to the surface (Kt << Ka).
Turner et al. [95] extended the previous deposition rate expression in two-phase flow situation (2φ), by introducing a deposition contribution from boiling process Kb:
𝐾𝑑(2𝜙) = 𝐾𝑑(1𝜙) + 𝐾𝑏 (7)
where the deposition rate for one-phase flow Kd(1φ) (m/s) is given by Equation (6).
They also developed the particle transport rate Kt accounting for diffusion (Kdiff), inertial coasting (Ki) and thermophoresis (Kth):
𝐾𝑡= 𝐾𝑑𝑖𝑓𝑓+ 𝐾𝑖+ 𝐾𝑡ℎ (8)
3.2.1. Transport step - 𝑲𝒕
3.2.1.1. Inertial coasting
Flow carrying magnetite particles in SG is highly turbulent [82,96], which can be separated into three layers: the centre region of flow, the buffer zone where the velocity fluctuations decrease as the distance to the wall decreases and the laminar boundary layer which is theoretically devoid of turbulence. The magnetite particles can reach the wall through the laminar layer providing that their initial momentum is high enough. Friedlander and Johnstone [97] were the first to propose inertial coasting as an important step in particle deposition. The thickness of each layer depends on the physical parameters of the system. Burrill [82] firstly stated that more magnetite particles are deposited when the velocity of the flow increases due to the decrease of the boundary layer thickness.
Thomas et al. [90] published the first experimental work on magnetite deposition from a turbulent liquid in SG tubes in 1974. They found that the deposition rate increases linearly with Reynolds number from 1700 to 1.85 x 10⁵, corresponding to a water velocity evolution from 0.03 to 3 m/s. They suggested that a particle, once deposited, would not be detached from the surface if the fluid Reynolds number remains unchanged regarding deposit removal [98].
Hirano et al. [99] presented a Japanese study of the effect of flow rate on TSP blockage in 2010. The work was carried out at 270 °C using a high-velocity test loop with quatrefoil type flow-hole TSP structure. Test solution in the feed water tank and the spare tank were adjusted to pH25°C 9.3 using ammonia. The concentration of hydrazine in the both tanks was maintained at 200 ppb, and dissolved oxygen
concentration was maintained below 5 ppb by bubbling with high purity nitrogen gas. 500 ppb of magnetite particles of 0.4 μm were injected into the test section. The numerical analyses around the flow hole were conducted after 500 hours. The obtained results lead to the following conclusion:
The amount of scale deposition and the differential pressure caused by scale adhesion at the inlet
of quatrefoil-type flow hole increases when the flow rate increases from 2.5 m/s to 5.9 m/s.
Localized pressure drop and localized increase of turbulent energy are suggested to contribute to
deposition formation.
The results are consistent with each other. The authors predicted that the mass transfer step dominates the attachment step at high Reynolds numbers (>105). Very limited studies stated that an increase of fluid velocity does not affect magnetite deposition rate [89,91].
An expression of the inertial rate is given below, which is used in an EDF modelling tool designed to study SG deposit phenomena [15]:
16
where the empirical parameters ai vary as a function of the dimensionless relaxation time tp+ given by:
𝑡𝑝+= 𝜌𝑝𝜌𝑙𝑑𝑝2𝑈2 18𝜇𝑙2 ⁄ (10) 𝑎𝑖 = min [𝐴, 0.12] (11) with A=max (0.00038𝜌𝑙 𝜌𝑝𝑡𝑝 +𝑒0.48𝑡𝑝+, 0.0003(𝑡 𝑝+)2) 3.2.1.2. Diffusion
Diffusion often explains the net flux of molecules from a region of higher concentration to one of lower concentration [100]. By assuming a homogeneous distribution of magnetite particles concentration in PWR secondary flow, diffusion or self-diffusion describes the random motion of the molecules.
Particle diffusion is generally given by the following expression:
𝐾𝑑𝑖𝑓𝑓 = 𝑎𝑑𝑖𝑓𝑓𝑈𝑆𝑐−23 (12) with the empirical parameter adiff = 0.031 as suggested by Turner [95].
The Schimidt number (Sc) of particles depends on the kinematic viscosity of the fluid (νl in m2/s) and the diffusion coefficient of particles (Dp in m2/s):
𝑆𝑐= 𝜈𝑙 𝐷𝑝⁄ (13)
The diffusion coefficient (Dp) is proportional to the liquid phase temperature (Tl) and inversely proportional to the particle diameter (dp) and the dynamic viscosity of the fluid (μl) as expressed in the following equation:
𝐷𝑝= 𝑘𝑏𝑇𝑙
3𝜋𝜇𝑙𝑑𝑝
⁄ (14)
Basset et al. [86] gathered inertial coasting and diffusion, including inertial effects (9) into diffusion
phenomenon and proposing the same expression as eq. (12) with adiff = 0.084. Inertial effects may be thus more important than particle diffusion (0.053 vs 0.031).
3.2.1.3. Thermophoresis
Thermophoresis induces particle transport due to the presence of a gradient of temperature. It may be a prenominal process in tube fouling formation [2].
Thermophoresis rate Kth (m/s) is given in the EDF modelling tool by the following relationship with athermo = 0.042 [15]:
𝐾𝑡ℎ = −𝑎𝑡ℎ𝑒𝑟𝑚𝑜𝜈𝑙𝜙𝑤
(𝜆𝑝+ 2𝜆𝑙)𝑇𝑙
⁄ (15)
3.2.1.4. Sedimentation
Sedimentation does not seem to occur in TSP blockage formation at first sight because TSP has a vertical direction. However, Rummens [101] has predicted a flow stagnant region by flow velocity analysis at the
17
outlet of TSP where sedimentation can be the predominant phenomenon for the particle transportation onto the TSP upper surface.
Sedimentation corresponds to the tendency of particles to settle onto a surface due to forces like gravity, centrifugal acceleration or electromagnetism. In the EDF model presented by Prusek, only gravity force is taken into account [15].
Sedimentation phenomena depend on the angle between the surface direction and the vertical direction: if the surface direction is vertical, no particles can be deposited by gravity force; if the angle is 90°,
sedimentation rate Ks (m/s) can be expressed as in Eq. (16) in the Stockes regime and as in Eq. (17) above
this regime: 𝐾𝑠=(𝜌𝑝− 𝜌𝑙)𝑑𝑝 2𝑔 18𝜇𝑙2 ⁄ (16) 𝐾𝑠= 0.153 ((𝜌𝑝− 𝜌𝑙)𝑑𝑝 1.6𝑔 𝜇𝑙0.6𝜌 𝑙0.4 ⁄ ) 0.714 (17)
Particular Reynolds number determines the regime and its expression can be found in the section A.1.3 of the Prusek thesis [15].
3.2.1.5. Boiling
Thomas and Grigull [90] pointed out the importance of the "boiling factor". They performed a series of experiments on the deposition of magnetite in single- and two-phase flow [86]. They suggested that, in the case of nucleate boiling, the rate of deposition increases linearly with the heat flux. The authors suggested a possible correlation between the increase of deposition rate and the number of bubbles formed per unit surface area and time. According to them, the formation of bubbles produces an increase in the turbulence in the boundary layer adjacent to the wall, combined with an increasing flow of water and magnetite in the direction of the wall to replace the space occupied by the leaving bubbles. Based on this suggestion, the following deposition rate Kb (m/s) describing the boiling process has been proposed by EDF:
𝐾𝑏 = 𝜙𝑤𝑎𝑏
𝜌𝑚𝐶𝑙𝐻𝑙𝑔
⁄ (18)
where the deposition rate is proportional to heat flux φw (W/m2), the empirical parameter ab is equal to 0.05 as suggested by Prusek [15] and ρm is the average density of liquid/gas mixture (kg/m3).
3.2.2. Attachment step – Ka
Based on the AECL experimental results, the attachment rate Ka (m/s) has been found to follow the Arrhenius law [84]:
𝐾𝑎= 𝐾0exp(−𝐸 𝑅𝑇𝑠⁄ ) (19)
where E (J/mole) represents the activation energy for attachment which depends on the pH and the fluid temperature [84]. The best fit of Eq. (19) to the experimental data gives the following expression for pH25 °C ranging from 8.8 to 9.2 and Ts ranging from 242 to 298 °C:
18
3.2.3. Numerical application under TSP clogging conditions
In this section, numerical applications are applied to the above deposition rate (K) expressions under the 8th TSP conditions (T = 277.2 °C, P = 61.5 bars, pH25 °C = 9.2, void fraction = 85%) in order to identify the main phenomena responsible for particle deposition. Numeric values of each parameter are listed below (water properties were calculated by using the SteamTab software).
ρp = 5000 kg/m3 (magnetite density).
ρl = 755.7 kg/m3 (water density at 277 °C and 62 bars).
ρv = 31.32 kg/m3 (steam density at 277 °C and 61 bars).
ρm = 31.32*85% + 755.7*(1 – 85%) = 140.0 kg/m3.
μl = 1.860*10-5 Pa.s (water dynamic viscosity at 277 °C and 62 bars).
νl = μl/ρl = 2.461*10-8 m2/s.
Tl = 277.2 °C = 550.4 K.
dp is fixed to 1*10-6, 5*10-7 m and 1*10-7 m for three-case calculations, representing the measured
sizes in NPP, as previously mentioned in section 3.
Friction velocity, U, is generally supposed to be 1/10 of mean flow velocity Uz. Uz = 2.73 m/s has
been proposed by an EDF modelling tool (THYC) as the mean flow velocity at the inlet of TSP.
Heat flux is calculated as below:
𝜙𝑤=(𝑇𝑝𝑟𝑖𝑚𝑎𝑟𝑦− 𝑇𝑠𝑒𝑐𝑜𝑛𝑑𝑎𝑟𝑦)𝜆𝑆𝐺 𝑡𝑢𝑏𝑒⁄𝑆𝐺 𝑡𝑢𝑏𝑒 𝑡ℎ𝑖𝑐𝑘𝑛𝑒𝑠𝑠
Primary flow temperature is estimated to be about 300 °C and secondary flow temperature is
equal to 277.2 °C.
λSG tube is estimated to be around 15 W/m/K.
51B type SG tube has a thickness of 1.07*10-3 m.
λp of magnetite particles is estimated to be the same with SG tube (alloy 600) = 15 W/m/K.
λl = 0.586 W/m/K (water thermal conductivity at 277 °C and 62 bars).
Cl = 0.206, as mean liquid mass fraction of diphasic flow in TSP (THYC sources).
Hlg = 1.56*106 J/kg at 550 K.
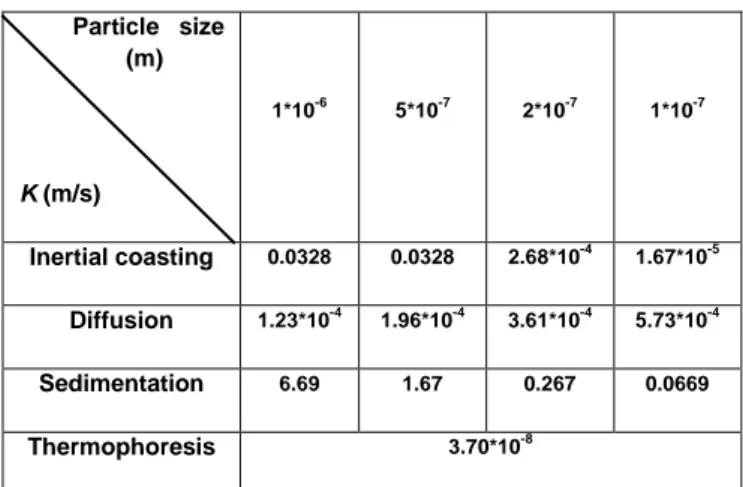
The calculated rates (K) of each transport phenomenon are then presented in Table 1.
Particle size (m) K (m/s) 1*10-6 5*10-7 2*10-7 1*10-7 Inertial coasting 0.0328 0.0328 2.68*10-4 1.67*10-5 Diffusion 1.23*10-4 1.96*10-4 3.61*10-4 5.73*10-4 Sedimentation 6.69 1.67 0.267 0.0669 Thermophoresis 3.70*10-8
Table 1 : Transport rates (K) following different phenomena and particle sizes at 100 nm, 500 nm and 1 µm.
Sedimentation is found to be the predominant phenomenon for each particle size. However, it is important to highlight that this calculation is applicable only onto the perpendicular surface at the outlet of TSP since sedimentation was predicted only to occur onto this region. Its predomination at the outlet of TSP is
19
will not be considered. Thermophoresis seems to be meaningless. As for inertial coasting, it prevails diffusion for particles larger than 200 nm and the tendency reverses for particles smaller than 200 nm. Following Eq. (8), transport rate of magnetite particles (Kt) can be calculated for each particle size by
summing inertial, diffusion and thermophoresis rates. Attachment rate (Ka) can be deduced from Eq. (20)
by assuming that Ts = Tl = 550.4 K. Monophasic Deposition rate (Kd(1φ)) can then be obtained by using Eq.
(6). Finally, boiling effect (Kb), calculated by Eq. (18), should be added to calculate the value of the final
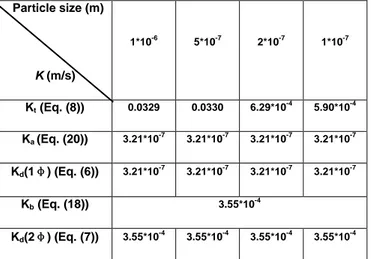
Kd(2φ) in Eq. (7). These values are reported in Table 2.
We firstly note that transport rate (Kt) is largely higher than attachment rate (Ka) with a difference of three
orders of magnitude. The one-phase deposition rate (Kd(1φ)) is practically equal to attachment rate. The
magnetite particle deposition is thus limited by attachment step in TSP clogging formation conditions. This is consistent with the previous phenomenological analyses, indicating the same sign of surface charge for TSP and magnetite particles (negatively charged).
Particle size (m) K (m/s) 1*10-6 5*10-7 2*10-7 1*10-7 Kt (Eq. (8)) 0.0329 0.0330 6.29*10-4 5.90*10-4 Ka (Eq. (20)) 3.21*10 -7 3.21*10-7 3.21*10-7 3.21*10-7 Kd(1φ) (Eq. (6)) 3.21*10 -7 3.21*10-7 3.21*10-7 3.21*10-7 Kb (Eq. (18)) 3.55*10-4 Kd(2φ) (Eq. (7)) 3.55*10 -4 3.55*10-4 3.55*10-4 3.55*10-4
Table 3 : Calculated values of particle transport rates (Kt), attachment rates (Ka), one-phase deposition rate (Kd(1φ)),
boiling rate (Kb) and two-phase deposition rate in case of boiling (Kd(2φ)).
An enormous effect of boiling process has been highlighted by this numerical application, which means that in case of bubble formation for a liquid in contact with a heating surface, particle deposition favoured by boiling is the limiting process of magnetite deposition and surface chemical phenomenology seems to be negligible. Real TSP temperature determination (Ts) seems to be important to better evaluate the boiling
rate.
4. Specific TSP blockage modelling
Based on the two basic mechanisms involved in TSP blockage, i.e. soluble iron precipitation and particle deposition, specific models have been recently proposed in France for SG deposits. Pujet [102] firstly
described a specific model to predict fouling thickness and thermal performance degradation of SG in PWR. This model is based on the following assumptions of fouling formation mechanisms:
Iron oxide particle deposition forms a porous layer onto the surface;
Soluble iron precipitation inside the porous layer generates a dense inner layer near the tube
surface;
The dense inner layer is detrimental to heat transfer from primary to secondary water and plays a
major role in the loss of thermal performance of SG.
Governing equations for porous layer and dense layer build-up can be found in Pujet’s work [102]. This model has been tested on laboratory experiments and applied to three PWR units, providing reasonably
20
good results. The main conclusion of these calculations is that iron solubility in the SG should be kept as low as possible during normal plant operation in order to minimize SG fouling.
In 2013, Prusek [1] developed a deposit process for modelling the TSP blockage in order to include it in the EDF reference code for modelling two-phase thermal-hydraulic phenomena at the sub-channel scale. A consecutive two-step mechanism was proposed in this model for TSP blockage, similar to the fouling formation mechanisms discussed above: Particle deposition followed by a strengthening process called “flashing” occurring due to precipitation phenomena in the porosity of the particle deposit.
According to Prusek, two special mechanisms, i.e. “vena contracta” and “flashing” are used to describe
particle transport and soluble species precipitation for TSP blockage, respectively.
4.1. Vena contracta
Rummens [101] was the first to propose a particle deposition mechanism where a sudden contraction in the flow circulation occurs. A conceptual figure of the vena contracta is shown in Figure 6. It is important to notice that this figure does not represent exactly the real geometry of a TSP flow hole. It just allows describing the main hydraulic phenomena when a flow passes through the contraction.
The “lipping” phenomenon observed in the field can be attributed to this “vena contracta” region. Indeed, at the inlet of this region, the mainstream flow separates from the wall following the sharp contraction. A low-velocity recirculation zone is created. In this zone, the particle deposition is encouraged and a tiny deposit can begin to grow. As the deposit grows, the flow contraction becomes more and more important, and consequently, the particle deposition is more and more favoured.
Figure 6: Pattern of vena contracta region [1,69]
Considering that the particle deposition exclusively results from this “vena contracta” mechanism, the
deposition rate Kv,p (m/s) proposed in this work [1] has to take into account the main parameters that
influence the TSP clogging and the self-sustained phenomenon represented by kv:
𝐾𝑣,𝑝 = 𝑎𝑣𝑘𝑣(𝜌𝑝− 𝜌𝑙)𝐶𝑔𝑑𝑝2𝑈𝑧2⁄ (21)𝜇𝑙
This equation shows that:
The higher the density of particles, the vapour mass fraction (Cg) and the particle size are, the more the deposition rate increases;
The higher the fluid kinetic energy is (Uz2), the more the deposition rate increases;
21
The empirical dimensionless parameter av should a priori be experimentally determined by representative TSP clogging formation experiments at the SG scale. This parameter is supposed to be constant all over the SG and it allows one to calibrate the deposition rate. However, its value was calculated by means of a mathematical method by Prusek in well-defined simulation conditions. Two values were proposed: 0.0008 and 0.00087 [1].
4.2. Flashing
This phenomenon can be attributed to a sudden decrease in pressure which is created at the inlet of flow holes due to the presence of the sharp contraction. This pressure reduction can be related to a liquid enthalpy reduction ΔHl (J/kg) which may induce a local change from liquid to steam. Due to the
vaporization, the mass fraction of soluble species in liquid locally increases as they cannot be transported by the steam. If the concentration reaches the solubility, a local precipitation occurs. This so called “flashing” precipitation may act as a deposit cementing agent and strengthen a preliminary particle deposit.
The flux of soluble species precipitation φs (kg/s)has been given as below, considering all the soluble species precipitate:
𝜙𝑠= 𝜙𝑙𝛥𝐻𝑙 𝐻 𝑙𝑔𝑆
⁄ (22)
Where φl represents the mass flux of liquid (kg/s); and S represents the solubility of soluble species (kg/kg)
4.3. Results
The deposit simulations based on these two mechanisms have been performed over a period of 22 years, which corresponds to the working period of SG before televisual inspections. Two simulations have been performed:
Simulation 1: only the flux of particle deposition is taken into account, calculated by equation (21);
Simulation 2: the strengthening process “flashing” is taken into account.
The main conclusions are:
“Flashing” seems to be a limiting factor for deposition;
The mean blockage rate is more important in hot leg than in cold leg;
The mean blockage rate is more important at the top than at the bottom of SG;
Simulation 2, taking into account “flashing” process allows to have a better representation of asymmetry between hot leg and cold leg;
TSP blockage has the special feature to be more important at the periphery than at the centre;
A reduction of magnetite solubility in SG seems to be an interesting remedy for reducing TSP
blockage.
These conclusions deduced from modelling have a good consistency with the observations. The proposed two-step mechanism seems to predict that TSP blockage localization is controlled by particle deposition and deposit morphology (density, porosity etc.) is controlled by strengthening process, which has a cementation effect. However, the main limitations in this model may be:
Neglected temperature effects in terms of both particle deposition and soluble iron precipitation by boiling.
22
Neglected impacts of TSP blockage on thermohydraulic flow parameters
Non-implementation of another strengthening mechanism proposed in the literature: electrokinetic
phenomenon [1,15,103,104]
5. Conclusions
After the Cruas events of SG tubes leaks, EDF started firstly a research program to identify which operating conditions could promote TSP blockage and which evolutions could be planned. Among operating
parameters, secondary circuit pH was identified as an aggravating factor for TSP clogging as well as tube fouling. Recently, it has been planned to remove at most copper alloys components and raise the operating pH to 9.6. The next question concerns the waste management constraints within the regulation frame. Compared to tube fouling, TSP blockage is an even more complicated phenomenon, governed by a specific geometry and large numbers of thermohydraulic and chemical parameters. Evaporation effects by heat based on the inverse solubility of magnetite cannot be only taken into account to define TSP clogging formation. Prusek proposed a specific model for TSP blockage including TSP specific geometry and
induced thermohydraulic changes. Two consecutive steps have been proposed to explain the “lipping form” observed: particle deposition due to vena contracta mechanism and iron precipitation responsible for fouling consolidation. Electrokinetic contribution should be probably considered and studied in TSP blockage formation but its contribution remains unknown.
Series of interesting works conducted by AECL in the 90s with high-temperature two-phase flow loop, investigating the effects of different amines present a great interest. Amines having high base strength and large molecular size have been found to correlate with low magnetite deposition rate in SG.
In the future works, determining the driving mechanisms appears the most important in a first approach, which allows subsequently investigating the effects of different parameters and identifying optimist
operating conditions. For this purpose, the design of a new test loop allowing to reproduce TSP geometric configuration and representative thermohydraulic and chemical conditions of the 8th TSP (T = 277.2 °C, P = 61.5 bars, void fraction = 85%) seems indispensable to understand the phenomena involved in fouling and TSP blockage. Fine TSP blockage solid characterizations should then be conducted to contribute to elucidate the fouling and TSP blockage mechanisms. Investigation of the electrokinetic effect, which may be another strengthening mechanism of iron precipitation, should be conducted to evaluate its contribution to TSP clogging formation. The experimental deposit and protocol developed by Scenini [69] seem adapted to this purpose. Advanced modelling works should simultaneously be carried out with representative test loop experiences and electrokinetic studies, to well define local parameters. Parametric studies can then be performed and in the end, it is expected to establish a complete TSP blockage formation model which will guide NPP field operations.
References
[1] T. Prusek, E. Moleiro, F. Oukacine, A. Adobes, M. Jaeger, M. Grandotto, Deposit models for tube
support plate flow blockage in Steam Generators, Nucl. Eng. Des. 262 (2013) 418–428. doi:10.1016/j.nucengdes.2013.05.017.
[2] S. Delaunay, Réactivité de la magnétite dans les conditions représentatives du circuit secondaire
des réacteurs à eau sous pression, PhD thesis, Université Pierre et Marie Curie, 2010.
[3] H.E.C. Rummens, J.T. Rogers, C.W. Turner, The Thermal Hydraulics of Tube Support Fouling in
Nuclear Steam Generators, Nucl. Technol. 148 (2004) 268–286.
[4] P. Schindler, E. Tevissen, V. Pointeau, A. Ungar, COLENTEC: A new approach to investigate tube
support plate clogging of Steam Generators, Nuclear Plant Chemistry Conference, Paris, France, 2012.
23
[5] G. Corredera, M. Alves-Vieira, O. De Bouvier, Fouling and TSP blockage of steam generators on
EDF fleet: identified correlations with secondary water chemistry and planned remedies, International Conference on Water Chemistry of Nuclear Reactor Systems, Berlin, Germany, 2008.
[6] H. Bodineau, T. Sollier, Tube support plate clogging up of French PWR steam generators, Eurosafe
Forum, Paris, France, 2008. http://inis.iaea.org/Search/search.aspx?orig_q=RN:44067716 (accessed January 4, 2016).
[7] R. Varin, Characterization on PWR steam generator deposits, EPRI Report TR-1060048 (1996).
[8] H. Demasles, P. Mercier, P. Tochon, Guide de l'encrassement des échangeurs de chaleur, Editions
Greth, ISBN: 2-9502555-5-8, Le Bourget du Lac, France, 2007.
[9] P. Balakrishnan, P. Mcsweeney, C. Forst, P. Walmsley, A Chemical Cleaning Process for Nuclear
Steam-Generators, Nucl. Technol. 55 (1981) 349–361.
[10] S. Tsubakizaki, H. Ando, Y. Takei, T. Naganuma, Y. Sakamoto, T. Nishi, Improved Reliability of High-AVT (High-pH Water Treatment) Application to Combined Cycle Plants, Mitsubishi Heavy Ind. Tech. Rev. 52 (2015) No.2.
[11] H. Takamatsu, T. Matsunaga, R.M. Wilson, T. Kusakabe, Sludge collector performance in steam generators of pressurized water reactor, Nucl. Eng. Des. 200 (2000) 295–302. doi:10.1016/S0029-5493(99)00323-4.
[12] F. Carrette, Décontamination et Nettoyage chimique en centrales à réacteur à eau sous pression, corrosion dans les centrales Forum, Saclay, France, 2015.
[13] F.V. Puzzuoli, P.J. Leinonen, G.A. Lowe, B. Murchie, Steam generator cleaning campaigns at Bruce A: 1993-1996, Proc. Fourth International Conference CANDU Maintenance. (1997) 355–85.
[14] A.L. Rufus, V.S. Sathyaseelan, M.P. Srinivasan, P.S. Kumar, S.N. Veena, S. Velmurugan, S.V. Narasimhan, Chemistry aspects pertaining to the application of steam generator chemical cleaning formulation based on ethylene diamine tetra acetic acid, Prog. Nucl. Energy. 39 (2001) 285–303. doi:10.1016/S0149-1970(01)00004-X.
[15] T. Prusek, Modélisation et simulation numérique du colmatage à l’échelle du sous-canal dans les
générateurs de vapeur, PhD thesis, Aix-Marseille Université, 2012. http://www.theses.fr/2012AIXM4333 (accessed January 7, 2016).
[16] S. Pujet, Encrassement secondaire des GV: Analyse du REX et des essais en laboratoire sur le labotoire et le dépôt de produits de corrosion, EDF R&D Report HI-84/02/008 (2002).
[17] Investigation of Steam Generator Corrosion Products Under Typical PWR Operating Conditions, EPRI Report, TR-3068, 1984.
[18] S. Girard, State of the Art of Clogging Diagnosis, in: Phys. Stat. Models Steam Gener. Clogging Diagn., Springer International Publishing, 2014: pp. 15–24.
http://link.springer.com/chapter/10.1007/978-3-319-09321-5_3 (accessed December 16, 2015). [19] S. PAILLARD, A. Skarlatos, G. Pichenot, G. Cattiaux, T. Sollier, Simulation of eddy current testing of
steam generator tubes in the proximity of support plates quadrefoil-shaped holes with an hybrid finite FE-VIM model, ICNDE, Berlin, Germany, 2010.
[20] O. Moreau, K. Beddek, S. Clenet, Y. Le Menach, Stochastic Nondestructive Testing Simulation: Sensitivity Analysis Applied to Material Properties in Clogging of Nuclear Powerplant Steam Generators, IEEE Trans. Magn. 49 (2013) 1873–1876. doi:10.1109/TMAG.2013.2243409.
[21] A. Skarlatos, C. Gilles-Pascaud, G. Pichenot, G. Cattiaux, T. Sollier, A hybrid volume integral-finite elements approach for the simulation of eddy current inspection of steam generator tubes in the region of quadrifoiled support plate, Am. Inst. Phys. (2010).
[22] N. Ida, H. Hoshikawa, W. Lord, Finite element prediction of differential eddy current probe signals from Fe3O4 deposits in PWR steam generators, NDT Int. 18 (1985) 331–338. doi:10.1016/0308-9126(85)90163-4.
[23] S. Girard, T. Romary, J.-M. Favennec, P. Stabat, H. Wackernagel, Sensitivity analysis and dimension reduction of a steam generator model for clogging diagnosis, Reliab. Eng. Syst. Saf. 113 (2013) 143–153. doi:10.1016/j.ress.2012.12.012.
[24] S. Girard, Diagnostic du colmatage des générateurs de vapeur à l’aide de modèles physiques et
statistiques, PhD thesis, Ecole Nationale Supérieure des Mines de Paris, 2012.
https://pastel.archives-ouvertes.fr/pastel-00798355/document (accessed December 16, 2015). [25] M. Guillodo, P. Combrade, M. Foucault et al., A parametric study of hematite reduction in steam
generator secondary side chemistry conditions, Water Chemistry in Nuclear Reactor Systems, San Francisco, CA, Oct. 11-14 (2004).
[26] C.W. Turner, Physical and chemical factors affecting sludge consilidation, AECL Report, TR-11975, 1997.
![Figure 1: PWR recirculating steam generator [1]](https://thumb-eu.123doks.com/thumbv2/123doknet/12949522.375775/5.892.276.608.55.362/figure-pwr-recirculating-steam-generator.webp)
![Figure 3: Photo of SG tube fouling [1].](https://thumb-eu.123doks.com/thumbv2/123doknet/12949522.375775/6.892.335.555.52.220/figure-photo-sg-tube-fouling.webp)


![Figure 6: Pattern of vena contracta region [1,69]](https://thumb-eu.123doks.com/thumbv2/123doknet/12949522.375775/21.892.274.616.589.809/figure-pattern-of-vena-contracta-region.webp)
