Noninvasive stress testing of myocardial
perfusion defects: head-to-head comparison
of thallium-201 SPECT to MRI perfusion
Gabriella Vincenti, MD,
aRene
´ Nkoulou, MD,
aCharles Steiner, MD,
bHestia Imperiano, MD,
bGiuseppe Ambrosio, MD,
dFranc
¸ois Mach, MD,
aOsman Ratib, MD,
bJean-Paul Vallee, MD,
cand Thomas H. Schindler, MD
aBackground. To evaluate the diagnostic value of magnetic resonance imaging (MRI) of myocardial perfusion in the assessment of flow-limiting epicardial stenosis in a head-to-head comparison with abnormal thallium-201 (201TI) single photon emission tomography (SPECT) studies in patients with predominantly known coronary artery disease (CAD).
Methods and Results. Twenty-one patients (mean age 65 ± 10 years) with reversible myocardial perfusion defects on201TI-SPECT images during dipyridamole-stimulated hyper-emia were recruited for study purpose. Within 5 days of the201TI-SPECT study, myocardial perfusion was studied again with MRI during dipyridamole stimulation and at rest. Overall,
201TI-SPECT identified 30 reversible regional perfusion defects. The sensitivity to detect
hyp-operfused segments was 70% (21/30) with the GRE-MRI perfusion analysis with201TI-SPECT as reference. When patients were subgrouped according to the extent of regional reversible perfusion defects on 201TI-SPECT, mild- (SDS: 2-4), moderate- (SDS: 5-8), and severe-(SDS > 8) perfusion defects were also identified by GRE-MRI perfusion analysis in 75% (6/8), in 56% (9/16) and 100% (6/6), respectively.
Conclusions. GRE-MRI first-pass stress perfus\ion imaging may not identify up to 30% of mild-to-moderate perfusion defects in a group of preselected patients with predominantly known CAD and abnormal201TI-SPECT studies. (J Nucl Cardiol 2009;16:549–61.)
Key Words: Cardiac imagingÆ coronary artery disease Æ ischemia Æ MRI Æ SPECT
INTRODUCTION
According to the ischemic cascade,1stress-induced reductions in regional myocardial perfusion as a con-sequence of flow-limiting epicardial stenosis commonly precede a reduction in systolic function. Nuclear imag-ing, therefore, has focused on imaging of myocardial perfusion during bicycle-exercise or pharmacologic
vasodilation and at rest for the identification of flow-limiting epicardial stenoses. Numerous studies have shown a higher sensitivity for nuclear perfusion imaging than for stress echocardiography with evaluation of regional systolic function (85% vs 75%) in the detection of the CAD process, while a higher specificity was observed for stress echocardiography (88% vs 79%).2,3 More recently, cardiac magnetic resonance imaging (MRI) has emerged as a new and promising cardiac imaging modality to assess myocardial perfusion at rest and during pharmacologically induced hyperemia using gadolinium contrast agent and intravascular first-pass imaging.4 In a total of 15 studies comprising 355 patients, MR first-pass perfusion imaging during vaso-dilator stress revealed a mean sensitivity of 77% and specificity of 85%.5 In particular, MRI affords the advantage of a spatial resolution as high as 2-3 mm that even enables the imaging of stress-induced subendo-cardial flow reductions.6 Conversely, scintigraphic myocardial perfusion imaging with thallium-201 (201TI) and single photon emission tomography (SPECT)
From the Department of Internal Medicine,aCardiovascular Center, Nuclear Cardiology; Department of Radiology,bDivision of Nuclear Medicinel; Department of Radiology,c University Hospital of Geneva, Geneva, Switzerland; Division of Cardiology,dUniversity Hospital of Perugia, Perugia, Italy.
Received for publication Jan 19, 2009; final revision accepted May 1, 20092, 2009.
Reprint requests: Thomas H. Schindler, MD, Department of Internal Medicine, Cardiovascular Center, Nuclear Cardiology, University Hospital of Geneva, Rue Micheli-du-Crest 24 CH-1211, Geneva, Switzerland; [email protected].
1071-3581/$34.00
CopyrightÓ 2009 by the American Society of Nuclear Cardiology. doi:10.1007/s12350-009-9097-6
provides relatively high contrast resolution owing to the high myocardial first-pass extraction fraction of201TI as high as 80-85%.7 While myocardial scintigraphy with
201TI-SPECT has a low effective spatial resolution of
about 20 mm, its high contrast resolution may allow the detection of even mild regional differences of the myocardial perfusion during bicycle-exercise stress or pharmacologically induced hyperemia.8-10 This may allow not only the identification of advanced flow-lim-iting epicardial lesions but also of early stages of subclinical and diffuse CAD as it has also been descri-bed for PET imaging.8,9,11,12 Currently, the diagnostic value of MR first-pass perfusion imaging in the identi-fication of flow-limiting epicardial lesions as compared to cardiac SPECT as reference remains uncertain.
In view of marked differences in the methodology of cardiac201TI-SPECT and MRI, we aimed to evaluate the diagnostic value of MR perfusion imaging in the assessment of flow-limiting epicardial stenosis in a head-to-head comparison with abnormal 201TI-SPECT studies in patients with predominantly known coronary artery disease (CAD).
PATIENTS AND METHODS
Twenty-one patients (mean age 65 ± 10 years, 20 men, 1 women) with a history of angina pectoris and predominantly known CAD were studied (Table1). Of these patients, 14 patients had had previous myocardial infarction (Table2).201TI-SPECT was performed using standard protocol with dipyridamole-induced hyperemic flow increases and redistribution images after 4 hours. Only patients with 201TI-SPECT identified reversible perfusion defects were recruited for study purpose. In these patients, fast gradient-echo (GRE) magnetic res-onance (MR) first-pass perfusion imaging was performed within 5 days of the 201TI-SPECT study applying the same vasomotor-stress protocol. Coronary angiography was performed within 2 weeks of cardiac perfusion imaging studies. Between cardiac perfusion imaging and coronary angiography, no clinical events were noted. Any anti-ischemic medication was stopped at least 12 hours before each study. In addition, no patient consumed beverages containing caffeine (tea, coffee, coca-cola, and chocolate) at least 24 hours before each cardiac perfusion study. None of the patients had a history of bronchial asthma and none was taking aminophylline or related medication.
THALLIUM-201 MYOCARDIAL PERFUSION IMAGING
For myocardial perfusion imaging with 201 Tl-SPECT, we used a standard protocol with imaging
acquisition immediately after increasing coronary flow due to dipyridamole stimulation and redistribution images after 4 hours. Dipyridamole was infused over 4 minutes (total dose 0.56 mg/kg), monitoring ECG and blood pressure every minute, followed by an injection of 1.5 MBq/kg of 201TI 3 min from the end of the dipy-ridamole infusion. The myocardial perfusion data were acquired with SPECT using standard acquisition proto-cols. SPECT images were obtained with a rotating camera (CardioMD, Philips Medical Systems). Thirty-two planar images (64 9 64 pixel matrix, 400 mm field of view, 60 s per image) were acquired over a 180° arc from the right anterior oblique position to the left pos-terior oblique position. From the transaxial tomograms, short-axis and long-axis myocardial slices were reori-ented and the corresponding polar maps were submitted to visual and semiquantitative analysis.13
Before image acquisition, a 5-s transmission scan over the heart was performed to acquire a valid attenu-ation map. Tomographic reconstruction was performed with AutoSpect and Vantage Pro programs (Philips Medical Systems).13 All emission images were auto-matically corrected for nonuniformity, radioactive decay, and motion during acquisition. The noncorrected stress scintigraphic perfusion images were reconstructed by filtered back-projection with a Butterworth filter Table 1. Patient characteristics
n 21 Sex, F/M 1/20 Age, years 65 ± 10 BMI, kg/m2 27 ± 3 Obesity 8 (38) Hypertension 14 (66) Diabetes mellitus 7 (33) Hypercolesterolemia 16 (76) Smoking 16 (76) CAD in family 9 (43) Medication Beta-Blockers 15 (71) ACE-Inhibitor 14 (66) Calcium-channel blocker 8 (38) Nitrate 4 (19) LVEF (%) 52 ± 9 Known CAD 19 (90) Vessel disease Single 3 (16) Double 5 (26) Triple 11 (58) Myocardial infarction 14 (66)
Values are mean ± SD or n (%).
(order, 5; cutoff, 0.66). Attenuation maps, corrected for
201TI downscatter, were reconstructed by use of a
Bayesian prior approach after logarithmic inversion and normalization to a reference scan and the application of a Butterworth filter (order, 5; cutoff, 0.50).
MAGNETIC RESONANCE IMAGING A 1.5 T scanner (Siemens Magnetom Espree) with a phased-array receiver coil was used. Balanced steady-state free precession (SSFP) cine imaging (parallel imaging technique GRAPPA 2) with retrospective gat-ing was acquired in vertical long axis (two chambers), horizontal long axis (four chambers), and in multiple short-axis views covering the left ventricle, for the assessment of left ventricular function. Typical param-eters were repetition time (TR) 3.42 ms, echo time (TE) 1.51 ms, flip angle 50°, leading to a spatial resolution of 1.8 9 1.3 9 8 mm3. Subsequently, dipyridamole (0.56 mg/kg) was infused over 4 minutes monitoring ECG and blood pressure every minute. Three minutes after finishing the dipyridamole infusion (waiting peak vasodilation), bolus injection of gadolinium contrast
(0.1 mmol/kg Gadoteric acid, Dotarem, Guerbet) was performed. MR first-pass stress perfusion study was acquired in three short-axis planes (basal, middle, and apical) and in one vertical long-axis plane every one heart beat (single shot acquisition) with a saturation-recovery turbo-FLASH gradient-echo (GRE) sequence, delayed time of 90 ms, and parallel imaging technique read out (GRAPPA 3). Typical parameters were repetition time (TR) 1.92 ms, echo time (TE) 0.88 ms, and flip angle 15°, leading to a spatial resolution of 2.9 9 3 9 8 mm3. Additional gadolinium 0.1 mmol/kg was injected for the delayed contrast enhancement imaging acquired after 10 minutes to allow for the clearance of the first contrast agent injection. Delayed enhancement (DE)-MRI was performed with a segmented FLASH 3D inversion-recovery technique: inversion time set to null normal myocardium. Additional PSIR 2D sequences were acquired in the vertical long axis, horizontal long axis, and short-axis planes for a more accurate analysis of the hyper-enhanced regions. After the acquisition of the first-pass stress perfusion images, 240 mg aminoph-ylline was administered intravenously in order to reverse the vasodilatory effects of dipyridamole and, thereby, Table 2. Angiographic (percentage luminal narrowing) data, perfusion abnormalities on201Tl-SPECT and GRE-MRI
Patient
no.
LM
LAD
LCX
RCA
Infarct
location
201Tl-SPECT
Perfusion
abnormalities
201Tl-SPECT
Perfusion
abnormalities
MRI
1 – – – 100 Lat, Inf Inf, Sep Inf, Sep
2 – 100 72 – Inf Ant, Lat –
3 – – 61 100 Inf Inf Inf
4 – 64 100 100 – Lat, Inf Lat, Inf
5 – 57 100 100 – Lat, Inf Lat, Inf
6 – – 100 100 Lat, Inf Lat, Inf Lat, Inf
7 – – 100 100 – Inf –
8 – 98 – 56 Inf Ant, Lat –
9 – 65 53 75 – Inf –
10 – 100 – 56 Ant, Sep Ant, Sep –
11 – 100 – 100 Ant, Sep, Inf Ant, Sep, Inf –
12 – – – 88 – Inf –
13 – 100 – – Ant Ant, Sep Ant, Sep
14 – 89 – – Ant Ant, Sep Ant, Sep
15 – – 86 – – Lat, Inf –
16 – – 83 – Lat, Inf Lat, Inf Lat, Inf
17 – 100 – – – Ant, Sep Ant, Sep
18 – 100 100 – Inf Ant, Inf Ant, Inf
19 – 100 – 100 Inf Ant, Inf Ant, Inf
20 – 100 – 100 Inf Ant, Inf Ant, Inf
21 – 61 79 92 Inf Lat, Inf Lat, Inf
–, No abnormality; Ant, anterior wall; Sep, interventricular septum; Lat, lateral wall; Inf, inferior wall; LM, left main artery; LAD, left anterior descending artery; LCX, left circumflex artery; RCA, right coronary artery.
to avoid lingering effects of dipyridamole on the assessment of rest perfusion following the stress pro-tocol. Subsequently, first-pass perfusion imaging was repeated at rest using the same dose of contrast agent (0.1 mmol/kg).
IMAGE ANALYSIS
Myocardial Scintigraphy
Visual interpretation was performed on eight short-axis planes (from apex to base), eight vertical long-short-axis planes and eight horizontal long-axis planes both during stress test and at rest (total of 24 slices). Segments with ‘‘reversible’’ perfusion defects were considered ische-mic while segments with ‘‘fixed’’ perfusion defects during stress and at rest identified necrosis. Quantitative and observer-independent evaluation of 201Tl-SPECT was performed using a 20-segment model.14 Each seg-ment was scored using a 5-point scoring system (0 = normal, 1 = mildly, 2 = moderate, 3 = severe reduction of radioisotope uptake, and 4 = apparent absence of detectable tracer uptake in a segment). A summed stress score (SSS) was obtained by adding the scores of the 20 segments of the stress images.14 Simi-larly, a summed rest score (SRS) was obtained by adding the scores of the 20 segments on the rest images. For the assessment of the extent of myocardial ischemia, a summed difference score (SDS) was calculated by sub-tracting the SRS from the SSS. A SSS \ 4 was considered normal, 4–8 mildly abnormal, 9–13 moder-ately abnormal, and [13 severely abnormal perfusion.14 Further, a SDS C 2 identified ischemia, while a SDS \ 2 was considered a normal. The extent of regional reversible perfusion defects on 201TI-SPECT was graded according the SDS value. According to this, a SDS of C2-4, [5-8, and [8 defined mild, moderate, and severe reversible perfusion defects, respectively. Finally, the left-ventricular ejection fraction (LVEF) at rest and after dipyridamole stress test was evaluated by gated SPECT.
MR Perfusion Imaging
MR stress and rest perfusion images and delayed enhancement images in equivalent slices were evaluated by two independent observers according to the AHA 17-segment model.15Two expert observers, aware of the results of the201TI-SPECT study, independently evalu-ated the MR perfusion images, and in the case of disagreement between both observers, consent was achieved in a joint reading. The analysis of perfusion images was visual, based on gadolinium signal intensity on first-pass images during vasomotor stress and its
difference from the images at rest. GRE-MR gadolinium first-pass stress and rest perfusion images of three short-axis planes (basal, middle, and apical) and in one ver-tical long-axis plane were visually compared side-by-side. Abnormal perfusion was defined as a signal reduction (myocardium being black) at the peak bolus during stress test but not at rest; normal perfusion was defined as myocardium being bright both during stress and at rest. Criteria indicative for true hypoperfusion vs artifacts were subendocardial signal intensity reduction persisting longer than the contrast-medium first-pass through the left ventricle cavity (susceptibility artifacts tend to be worst during peak concentration of gadolin-ium in the RV and LV cavities and tend to disappear rapidly), signal intensity reduction in several slices, perfusion defect tending to follow the typical perfusion territory of a coronary artery, absence of breathing motion, and triggering artifacts during CM first-pass.16 Ischemic segments were scored with a four-point scale: 0, normal; 1, probably normal; 2, probably abnormal; 3, definitely abnormal. This scoring system was chosen to allow dichotomization of results into normal (B1) and abnormal (C2). Hyperenhanced regions on DE-CMR were assumed to represent myocardial infarction unless isolated midwall or subepicardial hyperenhancement was found.17 Necrosis appeared hyper-enhanced com-pared with normal myocardium in delayed enhancement. In presence of necrosis, residual ischemia was defined as perfusion defect more extensive than the region of delayed enhancement.
Coronary Angiography
Standard coronary angiography of the left and right coronary arteries in multiple views was performed according to the Judkins technique. Angiograms were analyzed visually by two experienced observers who identified the stenotic segments. The luminal diameter of the stenosed artery was evaluated with quantitative coronary angiography (QCA) in the projection that demonstrated the most severe stenosis. Morphologically significant stenosis was defined as C50% diameter stenosis.
Statistical Analysis
Data are presented as mean ± SD for quantitative and absolute frequencies for qualitative variables. For comparison of differences, appropriate t tests for inde-pendent or paired samples were used (Statistical Analysis Software Institute, Cary, NC, USA). Differ-ences in the agreement of myocardial perfusion defects were analyzed with the x2 test. Two-tailed P values \0.05 were considered to be statistically significant.
RESULTS
Clinical Characteristics
Table1summarizes the characteristics of the study population. All patients had a history of angina pectoris, 19 with known CAD and two with suspicion for CAD. Of these, 14 had previous nontransmural myocardial infarction. The mean LVEF as determined by gated SPECT was 52 ± 9%. When a significant epicardial coronary artery lesion during coronary angiography was defined as C50% diameter stenosis, 11 patients had three vessel disease, 5 two vessel disease, and 3 one vessel disease. Most patients had hypercholesterolemia and smoking, followed by arterial hypertension, family his-tory of CAD, type 2 diabetes mellitus, and obesity as defined by body mass index C30 kg/m2.
Myocardial Perfusion Imaging
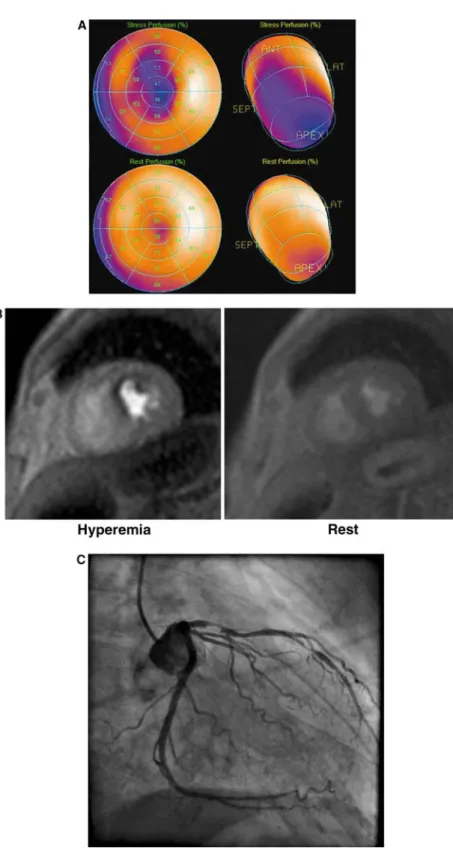
Figure1 illustrates an example of a myocardial perfusion defect in the antero-septo-apical wall during dipyridamole stimulation on polar maps and three-dimensional (3D)201TI-SPECT images in a 64-year-old and asymptomatic diabetic patient (Fig.1A) as well as on a mid-ventricular short-axis plane on GRE-MR first-pass imaging (Fig.1B). The stress-induced regional perfusion defect was related to high grade epicardial lesions in the proximal and middle artery segment of the left-anterior descending artery (LAD) as shown on cor-onary angiography (Fig.1C).
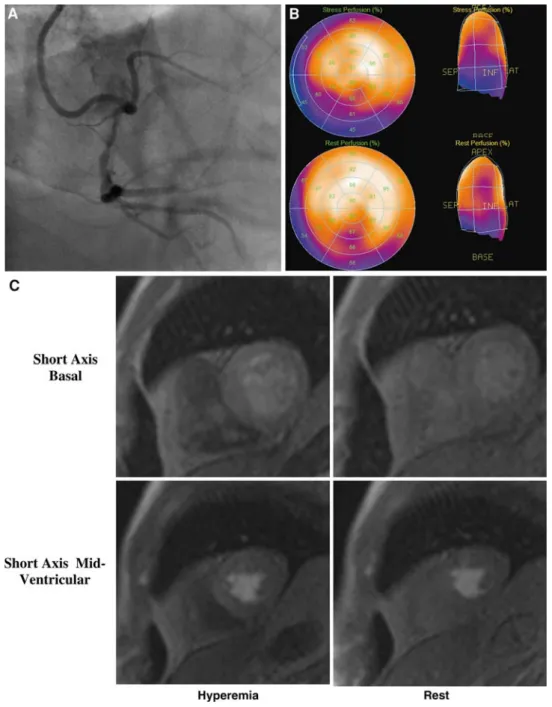
Conversely, Fig.2 demonstrates an example of a 42-year-old chronic smoker, who had had an acute coronary syndrome (ACS) 5 days before the imaging study. Coronary angiography demonstrated a 50% ste-nosis of the proximal right coronary artery (RCA) as well as a 90% stenosis of posterior descending artery (PDA) (Fig.2A). Subsequently, a cardiac201TI-SPECT study was performed to evaluate the hemodynamic significance of these stenoses. Figure2B depicts a stress-induced myocardial perfusion defect in the infe-rior wall on polar maps and 3D 201TI-SPECT images, which was not seen on the basal and mid-ventricular short-axis plane on GRE-MR first perfusion imaging (Fig.2C). The hemodynamic significance of the ste-noses of the RCA were also evidenced by the post-stress gated SPECT identified hypokinesia in the territory of the stress-induced myocardial perfusion defect in the inferior wall not seen on resting gated SPECT, indica-tive of myocardial stunning.
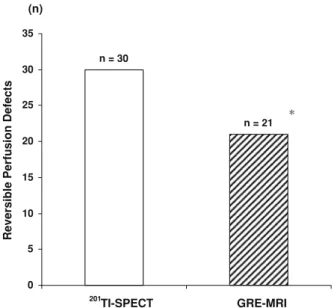
In 21 patients predominantly with known mul-tivessel disease, however,201TI-SPECT with stress and redistribution images identified 30 regional reversible perfusion defects (abnormal SSS C 4 and SDS C 2)
(Tables2 and3). The mean SRS, SSS, and SDS were 9 ± 8, 18 ± 9, and 9 ± 4, respectively. All reversible perfusion defects on 201TI-SPECT were subtended to epicardial lesions [75% diameter stenosis as evidenced by QCA (Table2). Reversible perfusion defects of the inferior and infero-lateral wall were confirmed on attenuation-corrected 201TI-SPECT images (Table2). Coronary artery lesions for these reversible perfusion defects ranged from 75% to 100% diameter stenosis with a mean value of 93 ± 9%. On a patient-based analysis, mild- (SDS: 2-4), moderate- (SDS: 5-8), and severe- (SDS [ 8) reversible perfusion defects were observed in 14% (3/21), 47% (10/21), and 38% (8/21) on 201TI-SPECT. Conversely, on a vessel-based analy-sis, there were 27% (8/30) mild-, 57% (16/30) moderate, and 20% (6/30) severe reversible perfusion defects (Table 3). In these patients with 30 regional reversible scintigraphic perfusion defects on 201TI-SPECT, GRE-MRI of myocardial perfusion during dipyridamole stimulation and at rest detected 21 regional perfusion defects (Tables2,3, Fig.3). As can be seen in Table3, there was a good agreement of 70% (21/30) of regional perfusion defects during pharmacologic vasodilation between 201TI-SPECT and GRE-MRI, while nine regional perfusion defects as defined by 201TI-SPECT were not necessarily identified on GRE-MR images. This difference achieved statistical significance (P B 0.001). Of these 201TI-SPECT defined nine regional reversible perfusion defects, that were not identified by GRE-MRI, four were scored as ‘‘proba-bly’’ normal (perfusion score of one), and five as definitively normal on GRE-MRI. The segments scored as ‘‘probably normal’’ on GRE-MRI corresponded to two mild and two moderate reversible perfusion defects on 201TI-SPECT, whereas the five segments scored as ‘‘definitively normal’’ on GRE-MRI corresponded to moderate ischemia on 201TI-SPECT. The disagreement between both modalities was seen myocardial segments with and without previous myocardial infarction (Tables2 and 3). In regions with previous myocardial infarction, 5 out of 17 residual myocardial ischemia as denoted by 201TI-SPECT were not identified by GRE-MRI. In these 17 patients, both delayed enhancement MRI and201TI-SPECT denoted infarcted regions. While
201
TI-SPECT also identified a significant reversibility of stress-rest perfusion in the infarcted area indicative for peri-infarctial ischemia, this was not observed in five of these cases where perfusion MRI demonstrated a mat-ched stress-rest perfusion defect corresponding to the delayed enhancement images. Conversely, in patients without previous myocardial infarction, 201TI-SPECT defined 13 reversible regional perfusion defects, of which four were not demonstrated on GRE-MR stress perfusion images.
Figure 1. APolar maps and three-dimensional (3D)201TI-SPECT images with a perfusion defect in the antero-septo-apical region during dipyridamole stress test that widely resolves on the resting perfusion SPECT images (SSS = 20; SRS = 2; SDS = 18). B The myocardial perfusion defect seen on polar maps and 201TI-SPECT was confirmed by cardiac GRE-MR first-pass perfusion imaging shown here on a short-axis plane during dipyridamole-stimulated hyperemia (left panel) as compared the corresponding short-axis plane at rest (right panel). C Coronary angiography demonstrated a stenosis [90% of proximal and middle segment of the left anterior descending artery (LAD).
When patients were subgrouped according to the extent of reversible perfusion defects on 201TI-SPECT, mild- (SDS: 2-4), moderate- (SDS: 5-8), and severe-(SDS [ 8) perfusion defects were also identified by GRE-MRI perfusion analysis in 75% (6/8), 56% (9/16),
and 100% (6/6), respectively (Tables2, 3 and Fig.4). Table 2 summarizes the head-to-head comparison of
201TI-SPECT and GRE-MRI for detecting reversible
myocardial perfusion defects in the individual coronary artery. As can be appreciated, some disagreement was
Figure 2. ACoronary angiography demonstrates a 50% stenosis of the proximal right coronary artery (RCA) as well as a 90% stenosis of posterior descending artery (PDA). Subsequently, a 201
TI-SPECT perfusion study was performed to evaluate the hemodynamic significance of these stenoses. B Polar maps and 3D201TI-SPECT images identify a myocardial perfusion defect in the inferior wall during dipyridamole stimulation that widely resolves on the resting perfusion SPECT images (SSS = 18, SRS = 7, SDS = 11). C The reversible myocardial perfusion defect denoted on201TI-SPECT was not demonstrated by perfusion cardiac GRE-MR first-pass perfusion imaging on the basal and mid-ventricular short-axis plane during stress (left panel) and rest on corresponding short-axis planes (right panel).
observed in all three coronary territories. In addition, the extent of reversible perfusion defects on 201TI-SPECT images was grouped according to quartile analysis with SDS 2-4 (lowest quartile), SDS [ 4-6 (lower quartile), SDS [ 6-8 (higher quartile), and SDS [ 8 (highest quartile). Figure5 demonstrates that the disagreement between 201TI-SPECT and MRI was two in the lowest quartile, three in the lower quartile, and four in the higher quartile, while no disagreement was observed in the highest quartile. Overall, 30% (9/24) of mild-to-moderate regional reversible scintigraphic perfusion defects were not necessarily identified by cardiac MR perfusion imaging, while all six severe reversible per-fusion defects were identified by both cardiac perper-fusion imaging modalities. Differences in hemodynamic con-ditions during pharmacologically induced hyperemia with dipyridamole during 201TI-SPECT and subsequent GRE-MRI, however, may have affected the identifica-tion of stress-induced ischemia by GRE-MRI. As Table 3. Head-to-head comparison of 201TI-SPECT and GRE-MRI for the detection of reversible myocardial perfusion defects in the individual coronary artery segment
Artery
Mild ischemia Moderate ischemia Severe ischemia Total ischemia
SPECT MRI % SPECT MRI % SPECT MRI % SPECT MRI %
LAD 3 1 33 (1/3) 4 2 50 (2/4) 4 4 100 (4/4) 11 7 65 (7/11)
LCX 3 3 100 (3/3) 4 3 75 (3/4) – – – 7 6 86 (6/7)
RCA 2 2 100 (2/2) 8 4 50 (4/8) 2 2 100 (2/2) 12 8 67 (8/12)
Total 8 6 75 (6/8) 16 9 56 (9/16) 6 6 100 (6/6) 30 21 70 (21/30)
Data in parentheses are numbers used to calculate percentages.
LAD, Left anterior descending artery; LCX, left circumflex artery; RCA, right coronary artery.
Mild ischemia: SDS = 2–4; moderate ischemia: SDS = 5–8; severe ischemia: SDS [ 8. % Sensitivity of MRI to detect SPECT defined stress-induced perfusion defects.
n = 21 n = 30 0 5 10 15 20 25 30 35
Reversible Perfusion Defects
201
TI-SPECT GRE-MRI (n)
*
Figure 3. Head-to-head comparison of 201TI-SPECT identi-fied myocardial perfusion defects during dipyridamole-stimulated hyperemia with GRE-MR first-pass perfusion imaging (*P B 0.05 vs201TI-SPECT).
Reversible Perfusion Defects
Tl-201 SPECT GRE-MRI 0 2 4 6 8 10 12 14 16 18 8 6 16 9 6 6
Mild Moderate Severe
*
Figure 4. Head-to-head comparison of 201TI-SPECT identi-fied mild-, moderate- and severe regional myocardial perfusion defects during dipyridamole-stimulated hyperemia with GRE-MR first-pass perfusion imaging (*P B 0.05 vs201TI-SPECT).
0 1 2 3 4 5 6 7 8 9 10 8 6 9 6 7 3 6 6 Tl-201 SPECT GRE- MRI
Reversible Perfusion Defects
(n)
1. Quartile 2. Quartile 3. Quartile 4. Quartile
*
*
Figure 5. Head-to-head comparison of 201TI-SPECT identi-fied myocardial perfusion defects grouped according to quartile analysis of SDS with GRE-MR first-pass perfusion imaging (*P B 0.05 vs201TI-SPECT).
denoted in Table4, although the stress hemodynamic responses during dipyridamole stimulation statistically did not differ significantly at the time of both myocardial perfusion imaging studies, they tended to be less during GRE-MR perfusion imaging than during the 201 TI-SPECT exam. This could have affected, at least in part, the lower detection rate of mild-to-moderate stress-induced regional perfusion defects with GRE-MRI as compared to201TI-SPECT.
DISCUSSION
In the current study, we aimed to evaluate the diagnostic value of GRE-MR perfusion imaging in the assessment of hemodynamically obstructive CAD in a head-to-head comparison with 201TI-SPECT as refer-ence. As it was observed, there was a relatively good concordance of 70% between cardiac201TI-SPECT and GRE-MRI in the detection of stress-induced regional perfusion defects, while 30% of mild-to-moderate scin-tigraphic perfusion defects were not necessarily identified by cardiac GRE-MR perfusion imaging. These observations agree somehow with results of previous investigations in small numbers of patients with sus-pected CAD,18 but extend the latter observations to a larger study population in patients with predominantly known CAD.
The reason for some discordant observation between cardiac201TI-SPECT and GRE-MR imaging in the detection of stress-induced perfusion defects remains uncertain but may be related, at least in part, to differ-ences in the myocardial contrast resolution provided by both cardiac imaging modalities. As regards SPECT perfusion imaging, the myocardial first-pass extraction fraction of201TI from the blood into the myocardium is as high as 80-85%.7 Beyond this first-pass extraction, recirculation of 201TI in patients allows further extrac-tion of the radiotracer with a further increase in signal-to-noise ratio or contrast resolution. Conversely, as
coronary flow increases, less 201TI is directly extracted during the capillary transit leading to as so-called ‘‘roll-off’’ at high coronary flow levels.19 As a consequence,
201TI uptake is no longer linearly related to myocardial
blood flow above & 2.5 mL/g/min. The latter drawback in fact may lead to difficulties of 201TI-SPECT in the identification of mild regional perfusion differences underlying flow-limiting epicardial lesions during higher hyperemic flow increases above 2.5 mL/g/min.7,19
As regards the contrast agent gadolinium used for GRE-MR perfusion imaging, it may diffuse rapidly across the capillary membrane into the extracellular space, while it may not enter myocytes with intact cell membranes.20 Thus, about 30-50% of the gadolinium first-pass bolus may enter the myocardial interstitium. It follows then that the myocardial gadolinium concen-tration is predominantly determined by the intravascular space and thus the coronary flow. First-pass evaluation of the myocardial gadolinium transit is necessary as recirculation and bolus dilation leads to a rapid equili-bration of the contrast between the vascular and extravascular space, resulting in a disappearance of a initial myocardial perfusion defect. Due to the latter limitations, the contrast resolution of gadolinium first-pass GRE-MR perfusion imaging is likely to be lower than for myocardial retention of 201TI-retention imaged with SPECT. Thus, as observed in the current study, 201TI-SPECT with its high myocardial perfusion contrast may be more sensitive to detect more mild-to-moderate stress-induced perfusion defects than gado-linium GRE-MR first-pass imaging. In fact, a survey of the MR first-pass perfusion imaging literature may support these considerations.5According to this, a total of 15 MR perfusion imaging studies with a total of 355 patients were summarized. MR perfusion imaging yiel-ded an average sensitivity of 77% (ranging from 65% to 93%) and an average specificity of 83% (range, 60% to 100%). Conversely, the average sensitivity and speci-ficity of 201TI-SPECT perfusion imaging during Table 4. Hemodynamic response to dipyridamole stimulation
SPECT
MRI
Rest
Hyperemia
Rest
Hyperemia
HR, beats/min 71 ± 10 91 ± 17 70 ± 10 86 ± 19
SBP, mmHg 133 ± 17 139 ± 20 130 ± 19 129 ± 23
DBP, mmHg 79 ± 10 79 ± 11 71 ± 12 69 ± 14
RPP, mmHg 9 min 9523 ± 1805 12843 ± 3948 9085 ± 2045 11347 ± 4229
DRPP, mmHg 9 min 3320 ± 2143 2262 ± 2184
HR, Heart rate; SBP, systolic blood pressure; DBP, diastolic blood pressure; RPP, rate-pressure product (HR 9 SBP); DRPP, change of RPP from rest to hyperemia.
dipyridamole stimulation for detecting angiographically significant CAD (C50% stenosis) had been reported of 90% and 71%, respectively. Sensitivities ranged from 98% to 76%, with specificities ranging from 42% to 100%.7Based on these data, the visual analysis of MR perfusion imaging appears to be less sensitive than SPECT in the identification of flow-limiting epicardial lesion as also observed in the current study, while it may offer a higher specificity. Conversely, MR first-pass imaging with the semiquantitative assessment of an index of myocardial perfusion reserve has been shown to be a promising tool to delineate subendocardial perfu-sion abnormalities in patients with cardiac syndrome X and normal coronary arteries,21 and in a more quanti-tative analytic approach to even identify mild downstream hemodynamic effects of coronary artery calcification on coronary flows during vasomotor stress in patients with subclinical CAD.22 In patients with multivessel CAD, however, the myocardial flow reserve may be reduced in more or less homogenous fashion,23 associated with a insufficient regional perfusion dispar-ity to identify underlying flow-limiting epicardial disease. Under such circumstances, therefore, flow-lim-iting epicardial lesions may remain undetected on conventional visual analysis of relative distributions of the predominantly intravascular gadolinium contrast on MRI or myocardial radiotracer uptake on SPECT ima-ges.7,24,25 Under such condition, it is possible that the higher contrast resolution of201TI-SPECT may be more sensitive to unravel mild differences in regional myo-cardial perfusion during hyperemic flow increases that may be missed by the visual analysis of cardiac MR perfusion images. Our observations in patients with predominantly multivessel CAD support such a possi-bility as nine mild-to-moderate regional reversible perfusion defects as determined by201TI-SPECT were not identified on GRE-MR first-pass perfusion imaging, while none of six severe perfusion defects were missed. Cardiac SPECT imaging, however, may be signifi-cantly affected by artifacts due to photon absorption by the breast, diaphragma, liver, and the thoracic wall leading to false-positive perfusion findings. Conse-quently, there is a need for attenuation correction by assessing an attenuation map commonly acquired by transmission scanning with external radioactive sources. In particular, the inferior wall has been demonstrated to benefit most from the attenuation correction to avoid false-positive results.13,26 As we performed attenuation correction for 201TI-SPECT perfusion images, it is unlikely that some perfusion defects during pharmaco-logic vasodilation were false-positive findings even though we cannot entirely exclude such a possibility. Also, all regional myocardial perfusion defects detected on 201TI-SPECT perfusion images were related to
epicardial stenosis [75% diameter, as evidenced by QCA, that may further emphasize the identification of true perfusion abnormalities on 201TI-SPECT in the current study.
Our results agree but also differ from a previous comparative investigation between turbo fast FLASH-MR and201TI-SPECT perfusion imaging in 40 patients with suspected CAD.27 Applying a morphologic cutoff of [70% diameter stenosis of the coronary artery, overall comparable sensitivities and specificities for cardiac turbo-FLASH MRI and201TI-SPECT of 81% vs 81% and 68% vs 63% were observed, respectively. The relatively lower specificity for 201TI-SPECT as compared to MRI may be explained by the fact that
201
TI-SPECT perfusion images were acquired without attenuation correction.27 An important limitation of the latter study, however, was the heterogeneity in stress testing with bicycle-exercise (n = 26) and pharmaco-logic vasodilation (n = 14) for the 201TI-SPECT exam. This difference in stress testing in fact may have com-promised, at least in part, the comparison of the diagnostic accuracy of both cardiac perfusion imaging modalities in the same patient. Nevertheless, these results were first to have indicated that MR first-pass perfusion imaging may represent an alternative to stress myocardial scintigraphy. This consideration is also supported by more recent findings of the multicentre, multivendor, and randomized MR-impact trial16 com-paring the role of MR and SPECT perfusion imaging in the detection of flow-limiting epicardial lesions in a study population with relatively high CAD prevalence. Based on a receiver operating characteristic (ROC) analysis, MR perfusion imaging with adenosine stress and an optimal dose of the contrast agent gadolinium (0.1 mmol/kg) revealed a similar diagnostic perfor-mance in the assessment of flow-limiting epicardial lesions of C50% diameter stenosis as SPECT using either 99mTc- or 201TI-tracers in a head-to-head com-parison. Paradoxically, in the overall study population without a head-to-head comparison and with various doses of gadolinium ranging from 0.01 to 0.1 mmol/kg for the MRI measurements of myocardial perfusion, MR perfusion imaging apparently proved to be superior to SPECT in the evaluation of flow-limiting epicardial lesions. The reason for this remains uncertain but is likely to be related to the underuse of gated SPECT (&50%) and the absence of a proper attenuation cor-rection of SPECT images associated with a higher rate of false-positive findings. In view of the latter limita-tions of the MR-impact trial,16as the authors also state, future head-to-head comparative trials between MR and SPECT perfusion imaging are needed in patients with low-, intermediate-, and high probability of CAD using a proper methodology and expert reading.
In general, sensitivities and specificities of myo-cardial perfusion imaging of CAD depend on several factors such as the patient population studied (i.e., the pretest probability), criteria for CAD, criteria for posi-tive perfusion defects, and imaging methods.28-30 Differences in these factors may not necessarily allow a proper comparison of sensitivity and specificity values of different investigations.31,32 A morphologic cutoff such as 50% or 70% diameter stenosis is a rather poor predictor of hemodynamic downstream effects of coro-nary stenoses, in particular for intermediate-severity lesions. Thus, comparative studies of different imaging modalities in the assessment of myocardial perfusion in the same patient as performed in the current study may provide more specific and detailed information. It is important to bear in mind, however, that the analysis of
201
TI-SPECT in the current study was performed quantitatively using the QPS software with a 20-segment model.14 According to this, a SSS C 4 and SDS C 2 defined the presence of stress-induced myocardial ischemia. Thus, on 201TI-SPECT regional myocardial ischemia was defined according to scintigraphic criteria in a quantitative and observer-independent fashion. In the current study, the GRE-MRI analysis of myocardial perfusion was based on a qualitative visual evaluation and, thus, observer-dependent. This may have intro-duced some observational error in the identification of mild-to-moderate myocardial perfusion defects of car-diac GRE-MR perfusion images. The visual analysis of MR images is known to be hampered sometimes by image artifacts. For example, transient dark rim artifact (DRA) in the subendocardial layer may mimic a hyp-operfused area and, thereby, limit the specificity of MR perfusion imaging. The causes of the DRA have been related to so-called Gibbs ringing at the blood–myo-cardial interface, magnetic susceptibility due to the bolus injection of gadolinium, banding movement arti-facts, and partial volume effects between left-ventricular blood pool and the myocardium.33The DRA commonly lasts for a few heart beats and varies temporally as the gadolinium bolus passes through the left-ventricular blood pool. In contrast, a true myocardial perfusion defect tends to be more constant and visible for a longer imaging duration than the DRA. Although an experi-enced reader can differentiate between DRA and a real perfusion defect by the transient variation of the DRA, it is sometimes difficult to identify true mild-to-moderate perfusion defects which ‘‘fill in’’ rapidly. In this regard, recent investigations34suggest that a fixed DRA (stress-rest perfusion defect) on MRI may be unmasked by adding delayed enhancement imaging for the identifi-cation or absence of myocardial infarction in the corresponding territory. Such algorithm in fact may increase the diagnostic accuracy in the detection of CAD
by incorporating the high specificity of delayed enhancement MRI in a population with intermediate probability of CAD and without prior myocardial infarction.34 As the current study population had pre-dominantly known CAD and previous nontransmural myocardial infarction, the implementation of the delayed enhancement MRI did not aid in the differen-tiation between DRA and ischemic perfusion defects. In the current study, however, some 201TI-SPECT revers-ible perfusion defects may have been missed by the observer-dependent visual analysis of GRE-MR images due to the difficulties in differentiating between DRA and ischemic perfusion defects. And indeed, four cases with 201TI-SPECT defined mild-to-moderate regional perfusion defects were estimated on GRE-MRI as ‘‘probably’’ normal in the presence of some kind of DRA. Another possibility is that if a quantitative and observer-independent analysis had been used for the analysis of the GRE-MR images, these 201TI-SPECT defined perfusion defects may have also been identified by GRE-MRI. A previous investigation of cardiac MRI for the detection of CAD35 assessed the diagnostic accuracy of MR first-pass perfusion imaging in the detection of CAD. The visual analysis of the MR per-fusion images yielded a sensitivity of 70%, specificity of 78%, and diagnostic accuracy of 74% when a morpho-logic significant stenosis was defined as C75% diameter. Conversely, using a semiquantitative index of myocar-dial perfusion reserve in the same study population did lead to an improved sensitivity of 88%, specificity of 90%, and diagnostic accuracy of 89%. Similarly, Sch-witter et al36using a myocardial perfusion reserve index observed a similar sensitivity and specificity of 87% and 85%, respectively, in detecting coronary artery lesions of C50% diameter stenosis. Thus, the semiquantitative assessment of an index of myocardial perfusion reserve or, as it has been reported more recently,37the fractional flow reserve may indeed contribute to improve the diagnostic performance of MR first-pass perfusion imaging in the detection of flow-limiting epicardial lesions.38 While such a semiquantitative approach to assess MR first-pass perfusion imaging may contribute to improve the identification flow-limiting epicardial lesions, it is not yet standardized and time-consuming that still limits a more widespread clinical use.
LIMITATIONS
There are important limitations worthy to be con-sidered in interpreting the current study data. At first, the study population consisted of patients with predominantly with known CAD. The observations therefore could differ among a population with a low- or intermediate risk for CAD. Further comparative investigations are needed to
evaluate the diagnostic role of MRI first-pass perfusion in the detection of mild-, moderate-, and severe flow-limit-ing stenosis in patients with suspected CAD. Second, as we only included patients with 201TI-SPECT defined ischemia as reference for the MR first-pass perfusion imaging, the current evaluation was biased toward201 TI-SPECT perfusion imaging. According to the latter, this investigation does not allow the commonly comparison of the assessment of sensitivity and specificity values of different cardiac imaging modalities in the detection of CAD in the clinical setting. Also, the myocardial perfu-sion studies with201TI-SPECT and GRE-MR first-pass perfusion imaging were not analysed in a blinded manner to each other that could have affected the interpretation of the perfusion images. Third, in view of the relatively small sample size of the study population with 201TI-SPECT defined stress-induced perfusion defects, the current investigation does certainly not permit definite conclu-sions but may add to stimulate larger comparative investigations between201TI-SPECT and MR first-pass perfusion imaging in patients with suspected and known CAD.16
CONCLUSIONS
GRE-MRI first-pass stress perfusion imaging may not identify up to 30% of mild-to-moderate perfusion defects in a group of preselected patients with predom-inantly known CAD and abnormal201TI-SPECT studies possibly related to a lower contrast resolution, technical parameters, and/or absence of perfusion quantification.
Acknowledgments
This work was supported by a clinical research grant of the Department of Internal Medicine of the University Hospitals of Geneva (Switzerland), by a Atherothrombosis Research Fellowship Grant for Dr. G. Vincenti from the European Society of Cardiology (ESC) and the Italian Society of Cardiology (Societa` Italiana di Cardiologie), and with the support of the Swiss National Science Foundation (SNF grant: PP00B-116901-1).
References
1. Nesto RW, Kowalchuk GJ. The ischemic cascade: Femporal sequence of hemodynamic, electrocardiographic and symptomatic expressions of ischemia. Am J Cardiol 1987;59(7):23C–30C. 2. Marwick TH. Current status of stress echocardiography for
diag-nosis and prognostic assessment of coronary artery disease. Coron Artery Dis 1998;9(7):411–26.
3. Geleijnse ML, Elhendy A. Can stress echocardiography compete with perfusion scintigraphy in the detection of coronary artery disease and cardiac risk assessment? Eur J Echocardiogr 2000;1(1):12–21.
4. Nandalur KR, Dwamena BA, Choudhri AF, Nandalur MR, Carlos RC. Diagnostic performance of stress cardiac magnetic resonance imaging in the detection of coronary artery disease: a meta-anal-ysis. J Am Coll Cardiol 2007;50(14):1343–53.
5. Bax JJ, Van der Wall EE, de Roos A, Poldermans D. Comparison with non-nuclear techniques. In: Zaret BL, Beller GA, editors. Nuclear cardiology—state of the art and future directions. Mosby: Philadelphia; 2005. p. 535-55.
6. Jerosch-Herold M, Kwong RY. Optimal imaging strategies to assess coronary blood flow and risk for patients with coronary artery disease. Curr Opin Cardiol 2008;23(6):599–606.
7. Schindler TH, Schelbert HR. Quantification of myocardial blood flow. In: Dilsizian V, Narula J, Braunwald E, editors. Atlas of nuclear cardiology. Current Medecine LLC; 2006. p. 68-95. 8. Verna E, Ceriani L, Provasoli S, Scotti S, Ghiringhelli S. Larger
perfusion defects with exercise compared with dipyridamole SPECT (exercise-dipyridamole mismatch) may reflect differences in epicardial and microvascular coronary dysfunction: When the stressor matters. J Nucl Cardiol 2007;14(6):818–26.
9. Gould KL. Assessing progression or regression of CAD: The role of perfusion imaging. J Nucl Cardiol 2005;12(6):625–38. 10. Schindler TH, Schelbert HR. ‘‘Mismatch’’ in regional myocardial
perfusion defects during exercise and pharmacologic vasodilation: A noninvasive marker of epicardial vasomotor dysfunction? J Nucl Cardiol 2007;14(6):769–74.
11. Gould KL, Nakagawa Y, Nakagawa K, Sdringola S, Hess MJ, Haynie M, et al. Frequency and clinical implications of fluid dynamically significant diffuse coronary artery disease manifest as graded, longitudinal, base-to-apex myocardial perfusion abnor-malities by noninvasive positron emission tomography. Circulation 2000;101(16):1931–9.
12. Schindler TH, Facta AD, Prior JO, Cadenas J, Zhang XL, Li Y, et al. Structural alterations of the coronary arterial wall are asso-ciated with myocardial flow heterogeneity in type 2 diabetes mellitus. Eur J Nucl Med Mol Imaging 2008;36:219–29. 13. Wolak A, Slomka PJ, Fish MB, Lorenzo S, Berman DS, Germano
G. Quantitative diagnostic performance of myocardial perfusion SPECT with attenuation correction in women. J Nucl Med 2008;49(6):915–22.
14. Berman DS, Hachamovitch R, Kiat H, Cohen I, Cabico JA, Wang FP, et al. Incremental value of prognostic testing in patients with known or suspected ischemic heart disease: a basis for optimal utilization of exercise technetium-99 m sestamibi myocardial perfusion single-photon emission computed tomography. J Am Coll Cardiol 1995;26(3):639–47.
15. Cerqueira MD, Weissman NJ, Dilsizian V, Jacobs AK, Kaul S, Laskey WK, et al. Standardized myocardial segmentation and nomenclature for tomographic imaging of the heart: A statement for healthcare professionals from the Cardiac Imaging Committee of the Council on Clinical Cardiology of the American Heart Association. J Nucl Cardiol 2002;9(2):240–5.
16. Schwitter J, Wacker CM, van Rossum AC, Lombardi M, Al-Saadi N, Ahlstrom H, et al. MR-IMPACT: Comparison of perfusion-cardiac magnetic resonance with single-photon emission computed tomography for the detection of coronary artery disease in a multicentre, multivendor, randomized trial. Eur Heart J 2008;29(4):480–9.
17. Wu E, Judd RM, Vargas JD, Klocke FJ, Bonow RO, Kim RJ. Visualisation of presence, location, and transmural extent of healed Q-wave and non-Q-wave myocardial infarction. Lancet 2001;357(9249):21–8.
18. Bremerich J, Buser P, Bongartz G, Muller-Brand J, Gradel C, Pfisterer M, et al. Noninvasive stress testing of myocardial ischemia: Comparison of GRE-MRI perfusion and wall motion
analysis to 99 mTc-MIBI-SPECT, relation to coronary angiogra-phy. Eur Radiol 1997;7(7):990–5.
19. Glover DK, Ruiz M, Edwards NC, Cunningham M, Simanis JP, Smith WH, et al. Comparison between 201Tl and 99mTc sestamibi uptake during adenosine-induced vasodilation as a function of coronary stenosis severity. Circulation 1995;91(3):813–20. 20. Brasch RC. New directions in the development of MR imaging
contrast media. Radiology 1992;183(1):1–11.
21. Panting JR, Gatehouse PD, Yang GZ, Grothues F, Firmin DN, Collins P, et al. Abnormal subendocardial perfusion in cardiac syndrome X detected by cardiovascular magnetic resonance imaging. N Engl J Med 2002;346(25):1948–53.
22. Wang L, Jerosch-Herold M, Jacobs DR Jr, Shahar E, Detrano R, Folsom AR. Coronary artery calcification and myocardial perfu-sion in asymptomatic adults: The MESA (Multi-Ethnic Study of Atherosclerosis). J Am Coll Cardiol 2006;48(5):1018–26. 23. Di Carli MF, Dorbala S, Hachamovitch R. Integrated cardiac
PET-CT for the diagnosis and management of CAD. J Nucl Cardiol 2006;13(2):139–44.
24. Beller GA. Underestimation of coronary artery disease with SPECT perfusion imaging. J Nucl Cardiol 2008;15(2):151–3. 25. Dorbala S, Vangala D, Sampson U, Limaye A, Kwong R, Di Carli
MF. Value of vasodilator left ventricular ejection fraction reserve in evaluating the magnitude of myocardium at risk and the extent of angiographic coronary artery disease: A 82Rb PET/CT study. J Nucl Med 2007;48(3):349–58.
26. Slomka PJ, Fish MB, Lorenzo S, Nishina H, Gerlach J, Berman DS, et al. Simplified normal limits and automated quantitative assessment for attenuation-corrected myocardial perfusion SPECT. J Nucl Cardiol 2006;13(5):642–51.
27. Sakuma H, Suzawa N, Ichikawa Y, Makino K, Hirano T, Kitag-awa K, et al. Diagnostic accuracy of stress first-pass contrast-enhanced myocardial perfusion MRI compared with stress myo-cardial perfusion scintigraphy. AJR Am J Roentgenol 2005;185(1):95–102.
28. Beller GA. Assessment of new technologies: Surrogate endpoints versus outcomes, and the cost of health care. J Nucl Cardiol 2008;15(3):299–300.
29. Hachamovitch R, Di Carli MF. Methods and limitations of assessing new noninvasive tests: Part II: Outcomes-based valida-tion and reliability assessment of noninvasive testing. Circulavalida-tion 2008;117(21):2793–801.
30. Hachamovitch R, Di Carli MF. Methods and limitations of assessing new noninvasive tests: Part I: Anatomy-based validation of noninvasive testing. Circulation 2008;117(20):2684–90. 31. Sato A, Hiroe M, Tamura M, Ohigashi H, Nozato T, Hikita H,
et al. Quantitative measures of coronary stenosis severity by 64-Slice CT angiography and relation to physiologic significance of perfusion in nonobese patients: comparison with stress myocardial perfusion imaging. J Nucl Med 2008;49(4):564–72.
32. Kern MJ. Coronary physiology revisited: Practical insights from the cardiac catheterization laboratory. Circulation 2000;101(11): 1344–51.
33. Gerber BL, Raman SV, Nayak K, Epstein FH, Ferreira P, Axel L, et al. Myocardial first-pass perfusion cardiovascular magnetic resonance: History, theory, and current state of the art. J Cardio-vasc Magn Reson 2008;10(1):18.
34. Klem I, Heitner JF, Shah DJ, Sketch MH Jr, Behar V, Weinsaft J, et al. Improved detection of coronary artery disease by stress perfusion cardiovascular magnetic resonance with the use of delayed enhance-ment infarction imaging. J Am Coll Cardiol 2006;47(8):1630–8. 35. Nagel E, Klein C, Paetsch I, Hettwer S, Schnackenburg B,
Weg-scheider K, et al. Magnetic resonance perfusion measurements for the noninvasive detection of coronary artery disease. Circulation 2003;108(4):432–7.
36. Schwitter J, Nanz D, Kneifel S, Bertschinger K, Buchi M, Knusel PR, et al. Assessment of myocardial perfusion in coronary artery disease by magnetic resonance: A comparison with positron emission tomogra-phy and coronary angiogratomogra-phy. Circulation 2001;103(18):2230–5. 37. Rieber J, Huber A, Erhard I, Mueller S, Schweyer M, Koenig A,
et al. Cardiac magnetic resonance perfusion imaging for the functional assessment of coronary artery disease: A comparison with coronary angiography and fractional flow reserve. Eur Heart J 2006;27(12):1465–71.
38. Schwitter J. Myocardial perfusion imaging by cardiac magnetic resonance. J Nucl Cardiol 2006;13(6):841–54.