HAL Id: hal-02341223
https://hal.archives-ouvertes.fr/hal-02341223
Submitted on 31 Oct 2019
HAL is a multi-disciplinary open access
archive for the deposit and dissemination of
sci-entific research documents, whether they are
pub-lished or not. The documents may come from
teaching and research institutions in France or
abroad, or from public or private research centers.
L’archive ouverte pluridisciplinaire HAL, est
destinée au dépôt et à la diffusion de documents
scientifiques de niveau recherche, publiés ou non,
émanant des établissements d’enseignement et de
recherche français ou étrangers, des laboratoires
publics ou privés.
Elise Bou, Aliou Ly, Julien Roul, Olivier Llopis, Christophe Vieu, Aline Cerf
To cite this version:
Elise Bou, Aliou Ly, Julien Roul, Olivier Llopis, Christophe Vieu, et al.. Compact system for in situ
laser Doppler velocimetry of blood flow. Biomedical optics express, Optical Society of America - OSA
Publishing, 2019, 10 (11), pp.5862. �10.1364/BOE.10.005862�. �hal-02341223�
Compact system for in situ laser Doppler
velocimetry of blood flow
E
LISEB
OU,
1,2A
LIOUL
Y,
1J
ULIENR
OUL,
1O
LIVIERL
LOPIS,
1C
HRISTOPHEV
IEU,
1 ANDA
LINEC
ERF1,*1LAAS-CNRS, Université de Toulouse, CNRS, INSA, Toulouse, France 2Smartcatch, Toulouse, France
Abstract: This work describes the implementation of a compact system allowing measurement of blood flow velocity using laser Doppler velocimetryin situ. The compact setup uses an optical fiber acting as an emitter and receptor of the signal. The signal is then recovered by a photodiode and processed using a spectrum analyzer. The prototype was successfully tested to measure microbead suspension and whole blood flow velocities in a fluidic chip. Fibers with hemispherical lenses with three different radius of curvature were investigated. This simple yet precise setup would enable the insertion of the fiber via a medical catheter to monitor blood flow velocity in non superficial vessels where previous reported techniques cannot be implemented.
© 2019 Optical Society of America under the terms of theOSA Open Access Publishing Agreement
1. Introduction
Quantitative characterization of blood flowin vivo is of high interest in the medical community for diagnosis, therapeutic planning and monitoring of vascular diseases. Important clinical microcirculation parameters are blood flow (blood volume per time unit in vasculature) and perfusion (blood volume per tissue volume per time unit). Both are related to blood flow velocity through blood vessels. Several techniques have been implemented to address measurement of blood flow velocityin vivo such as electromagnetic induction [1], ultrasound particle image velocimetry [2], nuclear magnetic resonance [3], and optical techniques [4].
Among optical techniques, laser Doppler velocimetry has been widely used for this application. This measurement technique exploits the Doppler effect occurring when a particle backscatters an electromagnetic wave while moving away (or towards) the detector. As a consequence, the frequency of the reflected wave is shifted. The combination of the backscattered wave with the source wave gives rise to a beat frequency known as Doppler frequency, which is a signature of the velocity of the moving diffusive particle.
This well-established technique is usually implemented with a laser focused at the desired measurement point but it can also be implemented with two crossing laser beams in a dual-beam configuration. In 1972, Feke and Riva [5] were the first to successfully report laser Doppler velocimetry forin vivo blood flow velocity measurement in human retinal vessels. In its initial implementation, laser Doppler velocimetry gave rise to a single measurement point. Systems to access a larger measurement field were developed, as the device reported by Akiguchi [6] involving a fiber array to measure both 2D and 3D flow velocity distributions in mouse mesenteric vessels. Another technique related to Doppler effect is the laser intra cavity feedback interferometry [7]. It is based on the optical feedback effect occurring when a part of the light emitted from a laser is backscattered on an external target to reenter the laser cavity. In this case, the laser acts both as the emitter and the detector, the feedback signal being mixed with the emitted signal thanks to the laser nonlinearity. Amplification and analysis of the laser junction voltage in the frequency domain allows extracting velocity information.
Other optical techniques used to quantify blood flow velocity are particle image velocimetry and laser speckle techniques. Particle image velocimetry involves optical microscopy and consists
#373821 https://doi.org/10.1364/BOE.10.005862 Journal © 2019 Received 8 Aug 2019; revised 3 Oct 2019; accepted 11 Oct 2019; published 23 Oct 2019
in following the motion of single particle in two successive images. The particle displacement in the second frame relative to the particle position in the first one divided by the time-lapse between the two exposures results in the particle velocity. The displacement of the particles is determined using a two-dimensional cross-correlation between the two images. Using this technique, Schmid-Schoenbein and Zweifach [8] successfully measured red blood cell velocity profiles in arterioles and venules of a rabbit omentum. Laser speckle techniques use coherent light diffused on a moving target presenting irregularities at the scale of the wavelength used. If the diffusive particles displace uniformly, this results in an interference pattern fluctuating at a frequency related to the particles velocity. This technique has been applied since the early 2000s to obtain blood flow imaging. Recently, Nadort, Woolthuis, van Leuwen and Faber [9] reported an investigation on the relation between scattering particle size and blood flow velocity for laser contrast imaging and successfully used this technique to image human sublingual microcirculation. Acoustic resolution photoacoustic Doppler velocimetry is an emerging technique consisting in the formation of sound waves following light absorption in matter. Tissue illumination using a pair of laser pulses separated by a time-lapse produces a pair of acoustic waves emitted by red blood cells. These acoustic waveforms are shifted with respect to each other due to the motion of red blood cells. The resulting time-shift is linked to red blood cells velocity. Chen, Xie, Carson, Wang and Guo [10] implemented photoacoustic correlation spectroscopy forin vivo flow speed measurement in capillaries of a chick embryo model.
Among the previously mentioned techniques, particle image velocimetry and laser Doppler velocimetry feature increased spatial and time resolution performances. However, particle image velocimetry is hardly amenable for blood flow measurementin vivo as visible light is widely absorbed by biological tissues and as it is difficult to track single cells in blood flow. The major limitation of this technique is the limited depth of focus of the microscope objective resulting in the imaging of thin planes. Thanks to an increased penetration depth through biological tissue in the near infrared spectral range, laser Doppler velocimetry reports several applications for blood flow velocity measurementsin vivo. However, these applications are still restricted to superficial vessels at millimeter range depth in tissue with no access to deeper blood vessels. A way to overcome this limitation is to perform intravascular measurement by inserting the fiber directly into the vessel of interest. Scalise, Steenbergen and Mul [7] reported intra-arterial blood flow velocimetry using self-mixing feedback in a laser diode. The use of a fiber with a convex lens-like tip has been investigated by Tajikawa, Ishihara, Kohri and Ohba [11], but only to measure red cell suspension flow velocity. Influence of the insertion angle was investigated in this work and it was shown that laser Doppler velocimetry was not effective for an angle of 0° corresponding to the fiber pointing in the same direction as the flow. An explanation to this observation is the location of the measurement point in the wake flow disturbed by the fiber. In this study, optimal insertion angles were considered to be 50° and 180°. However, noin vivo intravascular application of laser Doppler velocimetry has been performed yet.
Laser wavelengths belonging to the NIR-II spectral range (1000 – 1700 nm) have been already used for laser Doppler velocimetry mainly for high-speed measurements. Strand [12] used a 1550 nm fiber laser to measure the velocity of a target moving at 1000 m/s. Bai [13] proposed a theoretical model for Doppler velocity measurement using mode-locked lasers. Their approach was then applied to velocity measurements around 20 m/s with a 1064 nm laser. Blood flow velocity measured using Doppler ultrasound was reported in literature around 13 cm.s−1for the brachial artery and around 7 cm.s−1for the basilic vein [14]. To our knowledge, laser operating in the NIR-II spectral range have not been implemented for blood velocity measurements corresponding to such ranges of velocities yet. The advantages of using telecom lasers for Doppler velocimetry are the single mode spectrum quality and the frequency stability they provide. Another advantage is the low noise amplitude provided by medium power telecom lasers. Moreover, these devices are widespread and affordable and a variety of compatible fibered
components can be integrated to the measurement system together with the laser. Previous reported experimental setups require the use of optical components such as lenses or dual beam splitters to implement laser Doppler velocimetry measurements. This is mainly due to the use of laser diodes emitting a diverging beam. Using a telecom laser, we propose a compact and completely fibered setup, taking advantage of the availability of fibered components for this specific working wavelength. Our setup is very easy to implement and no optical adjustment is required.
The objective of this work is to investigate the possible measurement of blood flow velocity intravascularly in a configuration where a fiber is pointing in the same direction as the blood flow in order to meet requirements of conventional venous catheter insertion procedures. A first step towards this practical use consists in investigating a system where a fiber is embedded inside a needle and inserted into a fluidic channel where it is subjected to a flow of whole blood, and pointing in the flow direction. For this purpose, we elaborated a fibered and compact setup implementing a 1537 nm telecom laser and a fibered circulator for measurement of blood flow velocity. Two homemade ball lens-ended fibers and a commercial conical lens-ended fiber inserted in a fluidic chip were used for laser Doppler velocimetry on a microbead suspension flow as a first step, and then successfully tested when flowing donor whole blood.
2. Experimental setup and methods 2.1. Laser Doppler velocimetry system
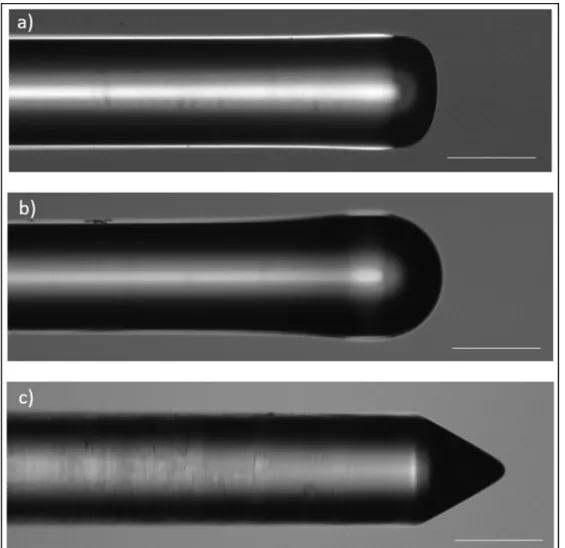
Ball lens-like fiber tips were manually fabricated using a Fujikura FSM-100P fiber splicer on commercial standard optical fibers (SMF28 fiber). Adjustments in the splicer parameters allowed us to obtain hemispherical lenses with variable radius of curvatures (see Fig.1(a) and Fig.1(b)). We will refer to Fiber A as the fiber with higher radius of curvature (Fig.1(a)), which was optically measured at 123 µm, and to Fiber B, the one with an intermediate radius of curvature (Fig.1(b)), which was optically measured at 72 µm. The diameter of the fiber is 125 µm. The third type of fiber we used in our experiments is a conical lensed tip fiber (CXFiber) that we will refer throughout the manuscript as Fiber C. The radius of the lens is 10 µm with a fiber diameter of 125 µm (see Fig.1(c)).
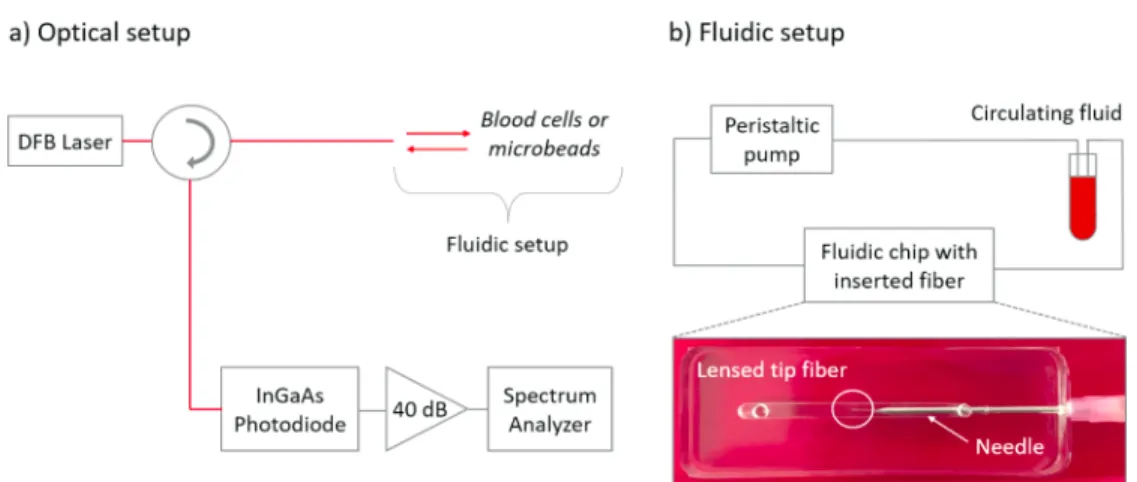
The setup principle consists in combining the reference beam with the beam backscattered by the particles in the moving fluid. A monochromatic beam emitted by a single mode 20 mW telecom DFB laser (Mitsubishi FU-68PDF, λ= 1537 nm) was used as a reference beam. The laser bias was 120 mA, which corresponds to 16.5 mW output power. The laser feeds an optical circulator allowing the separation of the reflected power from the transmitted power. The output port of the circulator goes through a photodiode (Thorlabs FGA04) loaded on a 1 kW resistor. The voltage signal collected on the resistor is then amplified using a low noise amplifier based on an AD797 chip, and measured on a spectrum analyzer (Tektronix RSA306). This setup is depicted in Fig.2.
The optical power collected on the photodiode is the combination of a reference signal reflected directly at the fiber end due to the refractive index mismatch between silica and liquid, and another signal resulting from the backscattering of the optical beam by the microbeads or the blood cells in the liquid. These two signals are mixed by the photodiode quadratic response and the resulting beat frequency is observable on the electrical spectrum. The advantage of such a setup lies not only in its simplicity but also in the fact that the delay between the reference signal and the backscattered signal is very short, which naturally eliminates any possible detection of the laser frequency noise. Because of the very low relative intensity noise of the laser, in the range of −160 dB/Hz at the offset frequencies of interest in this experiment, the measurement noise floor is determined by the detector parameters, which are the photodiode quantum noise and the resistor thermal noise.
Fig. 1. Images of the three different fiber tips used for the experiments carried out. Scale bars corresponds to 100 µm. a Fiber A with higher radius of curvature. b Fiber B with intermediate radius of curvature. c Fiber C with conical lensed tip.
The output of the spectrum analyzer is the power spectral density as a function of the frequency. Doppler effect results in a peak in the power spectral density at a specific frequency known as Doppler frequency which is linked to the backscattering particle velocity y the following relation:
fD=2n cos(θ)λ v (1)
withv, the velocity of the backscattering particle, λ the wavelength of the incident light beam, θ the angle between the propagation direction of the light and the particle movement direction and fDthe Doppler frequency. This simplified relation is valid in the case of identical targets moving in a uniform way at the same velocity without multiple scattering effect. In our case the angle is assumed to be Θ= 0° as the fiber is centered in the fluidic channel where flow is laminar.
Fig. 2. Schematic representation of the compact experimental fibered setup for laser Doppler velocimetry measurements. a Schematic representation of the optical setup. b Schematic representation of the fluidic setup. The insert presents a picture of the fluidic chip at the center of which the optical fiber is introducedvia a needle with an orientation parallel to the flow direction.
2.2. Fluidic chip
A fluidic chip made of polydimethylsiloxane (PDMS) was fabricated to flow microbead suspension and whole blood for velocity measurements. A microchannel of 3 × 3 mm square cross-section was designed to mimic a basilic vein (see Fig.2(b)). The PDMS channel was bonded onto a glass slide. A 1.3 mm diameter lateral opening connected to the channel was conceived to allow the insertion of the optical fiber as it could be performed in the lumen of a catheter. In practice, the optical fiber was glued inside a needle for an easier insertion into the PDMS chip. Once fixed, the optical fiber went out of the needle over approximately 1 cm to avoid perturbations induced by the needle. The lateral opening allowed the insertion and centering of the fiber into the fluidic channel where, according to Poiseuille laminar flow, the fluid velocity is maximal.
The fluidic chip was connected to a peristaltic pump (Thermo Fisher Scientific) with appropriate tubings and connectors to flow solutions in closed loop. The flow was established in the same direction as light propagation,i.e. the fiber was positioned upstream, or in the opposite direction of light propagation,i.e. the fiber positioned downstream. All our measurements were performed at four pump rotation speeds which were 23, 35, 50 and 60 rpm respectively. The way in which tubings are connected to the pump may cause flowrate variations from one experiment to another and it does not represent an accurate system to achieve high repeatability between experiments. Even if the pump does not exhibit high stability and precision in terms of flowrate, we chose this system considering the range of flow velocities we aimed and as a means to establish a first proof of concept of the laser Doppler velocimetry system we propose.
3. Laser Doppler velocimetry of microbead suspension
3.1. Estimation of flow velocity at the center of the channel using Poiseuille law Experiments were conducted on a microbead suspension composed of an homogeneous suspension of melamin resin microbeads of 6 µm in diameter (Fluka) at a concentration of 1.107 per mL of solution, namely 0.18% mass concentration in a solution of Dulbecco’s phosphate-buffered saline (DPBS) (Gibco) with 0.1% triton X-100 (Sigma). An overnight incubation of bovine serum albumin (BSA) (Sigma-Aldrich) diluted in PBS was performed in the fluidic chip to avoid adhesion of the beads onto the walls of the channel.
Considering PBS a Newtonian fluid and the flow in the channel laminar, we assumed that the microbead suspension follows Poiseuille law to obtain an estimation of the velocity at the center of the channel. In this case, a maximal flow velocity Vmaxoccurs at the center of the channel
where the fiber is immersed. The average velocity in the channel Vaveragecan be estimated using
the following relation:
D = VaverageS (2) where D is the volumetric flowrate and S the cross-section of the channel, which is 9 mm2 in
our case. We assume that a parabolic velocity profile is occurring in the channel. In this case the maximal velocity at the center of the channel is twice the average velocity, leading to the following relation:
D = 1
2VmaxS (3)
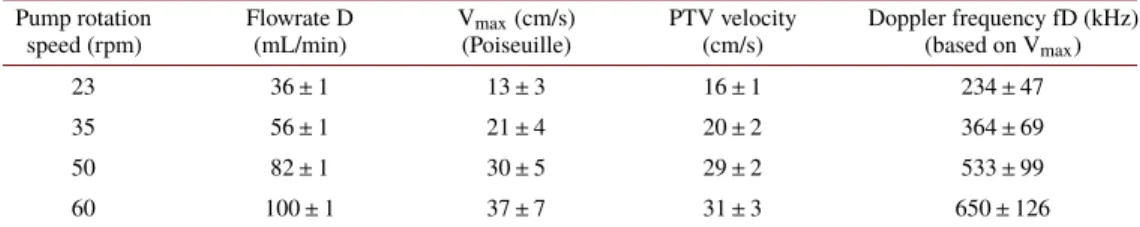
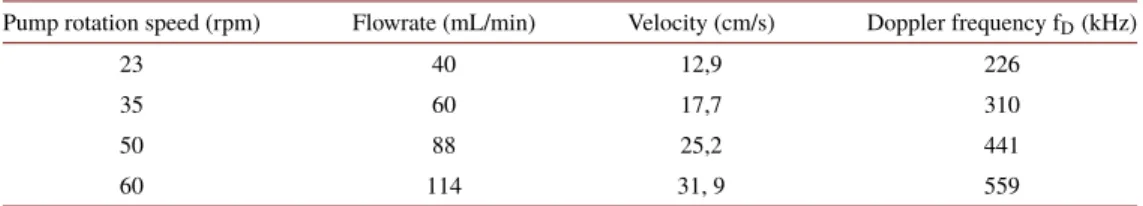
By measuring the PBS volume flowing through the fluidic chip during 1 minute, we could estimate the fluid velocity value at the measurement location for the four pump rotation speeds we used for all the following experiments. As water density is approximately 106higher than the melamine’s one, we assume that microbeads are following the flow dynamics. Corresponding theoretical Doppler frequencies were calculated using the relation mentioned in section2.1by taking the refractive index of PBS for λ= 1550 nm at n = 1,350 as reported in literature [15]. Table1summarizes the theoretical Doppler frequencies corresponding to the estimated speeds at the center of the channel for each pump rotation speed. Errors take into account uncertainty in measurements performed to obtain the estimation (flowrate D, cross-section of the channel S).
Table 1. Measured flowrate, estimated velocity using Poiseuille law, average velocity extracted by PTV and related Doppler frequency for the four pump rotation speeds used
Pump rotation speed (rpm) Flowrate D (mL/min) Vmax(cm/s) (Poiseuille) PTV velocity (cm/s) Doppler frequency fD (kHz) (based on Vmax) 23 36 ± 1 13 ± 3 16 ± 1 234 ± 47 35 56 ± 1 21 ± 4 20 ± 2 364 ± 69 50 82 ± 1 30 ± 5 29 ± 2 533 ± 99 60 100 ± 1 37 ± 7 31 ± 3 650 ± 126
3.2. Particle tracking velocimetry
In order to obtain a reference value of the fluid velocity at the center of the channel, particle tracking velocimetry (PTV) was performed in the same fluidic chip as the one used for laser Doppler velocimetry. The principle of this imaging method is to track the motion of a single particle on two successive images of an image sequence and to deduct the particle speed knowing the pixel size and time lapse. The microbead suspension composition was identical as the one previously described in section3.1with a reduced concentration of 2.106microbeads per mL corresponding to 0.03% mass concentration. The peristaltic pump was used at identical rotation speeds to flow the microbeads suspension in closed loop. Microbeads are functionalized with fluorescein isothiocyanate (FITC) with excitation and emission peak wavelengths of 495 nm and 519 nm respectively. An inverted spinning disk (Yokogawa) fluorescence microscope (Leica) was used to image the microbeads at the center of the fluidic channel. A 5X magnification objective was used to obtain the widest field of view. The acquisition rate was set at 1000 frames per second.
Image sequences allowed tracking the motion of single microbeads on several successive images and subsequently calculating the flow velocity for the different pump rotation speeds considered. The objective of an inverted microscope was positioned under the PDMS channel and imaging was performed through the glass slide. A micropositioner was used to move the
objective in the vertical axis and focus at the center of the channel. Results for each pump rotation speed are presented in Table1(see section3.1). Taking into account the dispersion of the measurements and the precision of the analytical estimation, PTV results are consistent with the estimation of Vmaxobtained from flow measurement and Poiseuille law.
3.3. Laser Doppler velocimetry
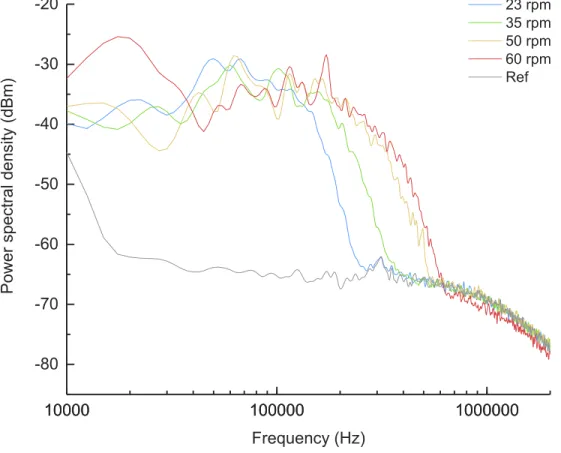
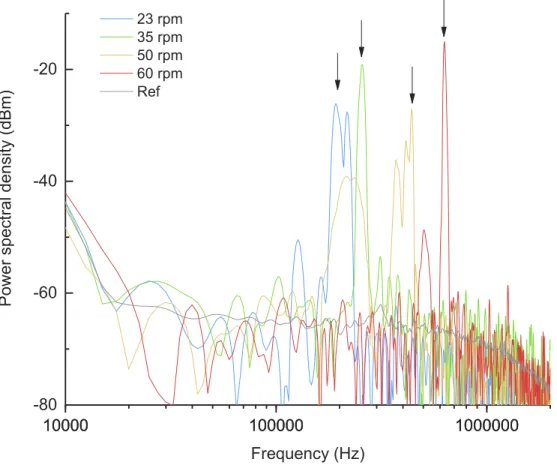
Experiments were conducted for each pump rotation speed with the three different fibers presented in section2.1pointing in the flow direction. A reference signal was recorded by turning on the laser and turning off the peristaltic pump resulting in the illumination of a steady fluid. The measurement was performed using the spectrum analyzer with an accumulation over 50 spectra to collect enough backscattered light events to achieve a representative measurement of velocity range at the measurement location. The signal obtained when using Fiber B with intermediate radius of curvature is presented in Fig.3. For each flow condition, the power spectral density is high between 10 kHz and 100 kHz before decreasing progressively to merge with the reference signal. The frequency at which the spectrum and the reference signal cannot be discriminated is called the cut-off frequency. This cut-off frequency increases proportionally with the pump rotation speed. This observation reveals that this value possibly translates the occurrence of Doppler effect inside a non monokinetic fluid flow. This particular Doppler behavior has already been observed by Feke and Riva [5] when performing laser Doppler velocimetry on a microbead suspension flowing through a glass capillary of 200 µm in diameter using whole flow illumination.
Fig. 3. Power spectral density recorded when using Fiber B on a microbead suspension. Light propagation and flow are in the same direction, i.e. the fiber is positioned upstream.
The flat portion of the spectrum may be attributed to a range of frequency shifts corresponding to the continuous range of velocities exhibited in the parabolic Poiseuille profile. Tajikawa, Ishihara, Kohri and Ohba [11] observed a similar spectrum behavior in a configuration closer to the one we present in this work. We believe that in our configuration, the flat portion of the spectrum corresponds to a range of velocities and movement directions inside the volume probed by the laser light. This distribution of velocities and trajectories can be possibly caused by the fiber itself which locally disturbs the laminar Poiseuille flow. The cut-off frequency is thus assumed to correspond to the maximal velocity of the microbeads inside the probed volume.
The cut-off frequencies for Fiber B when positioned upstream are 266 ± 50 kHz, 389 ± 50 kHz, 539 ± 50 kHz and 656 ± 50 kHz for pump rotation speeds of 23, 35, 50 and 60 rpm respectively. Taking into account the uncertainty on the estimations (see Table1), measured cut-off frequencies are consistent with the expected Doppler frequencies calculated using a velocity Vmaxgiven
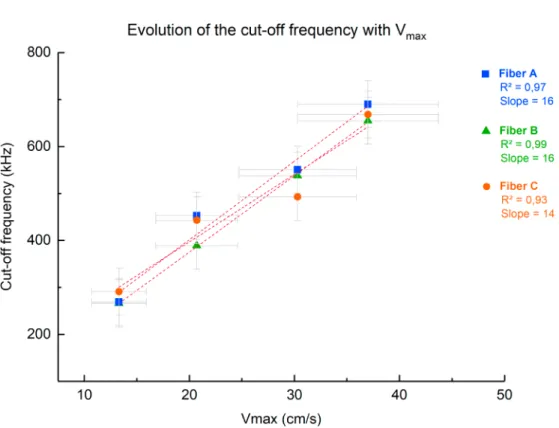
by a Poiseuille flow. The corresponding extracted maximal velocities are 15,1 ± 2,8 cm.s−1, 22,1 ± 2,8 cm.s−1, 30,6 ± 2,8 cm.s−1and 37,3 ± 2,8 cm.s−1. These values are in reasonable good agreement with the values obtained by particle tracking experiments. Similar spectra were obtained when using Fiber A and Fiber C. For the three different fibers, the cut-off frequencies for the different pump rotation speeds increase linearly with Vmaxestimation as shown in Fig.4.
The linear regression slopes values extracted from measurements are comprised between 14 and 16, which is in agreement with the theoretical slope calculated using the formula introduced in
section2.1. with θ= 0°,
theoretical slope = 2λ =n 17, 56 (4)
Fig. 4. Linear evolution of the cut-off frequencies as a function of Vmaxfor each pump rotation speed, for the three different fibers positioned upstream. The data points are from the experimental measurements and the curve is a linear fit. Correlation coefficients and slopes from the linear regression analysis are reported on the chart.
With n= 1,35 for PBS and λ = 1537 nm, the wavelength of the laser.
The three different fibers exhibit the same coefficient of proportionality between the cut-off frequency and the maximal fluid velocity.
Measurements were also performed without averaging various measurement points. When observing in live the spectrum analyzer display, the traces revealed clear peaks in the power spectral density spectrum (Fig.5). These power spectral density peaks correspond to expected Doppler peaks for a single moving object at a well defined velocity. We thus attribute these peaks to the instantaneous velocity measurement of a single moving microbead inside the volume probed by the laser spot. For successive data acquisitions at a given pump rotation speed, the frequency of the observed peaks changes, revealing the distribution of velocities and directions of a population of microbeads inside the probed volume. By averaging several measurement points and thus increasing the measurement time, the overlay of all these peaks gives rise to a large band as observed in Fig.3.
Fig. 5. Signal obtained without accumulation over several spectra when using Fiber C in the opposite direction of the flow,i.e. the fiber is positioned downstream. Red arrows denote the peaks attributed to the instant Doppler peaks of single microbeads.
4. Laser Doppler velocimetry in whole blood
4.1. Estimation of flow velocity at the center of the channel using computational fluid dynamics
Blood is a complex fluid composed of a mixture of proteins and water termed as plasma and different cell types called hematocytes. As a consequence, blood is a non-Newtonian fluid with a non-constant viscosity dependent on shear stress to which Poiseuille law is not appropriate for fluid dynamics determination. We performed fluidic simulations using ANSYS Fluent®, a computational fluid dynamics (CFD) software to estimate the maximum velocity at the center of the fluidic chip in the presence of the fiber which disturbs the flow. The 3 mm square cross-section fluidic channel and fiber geometries were designed on the software. The fiber of 125 µm in diameter was centered in the channel. The three types of lenses were designed as follows: 139 µm diameter ball, 133 µm diameter ball and 125 µm diameter basis and 100 µm height cone
supporting a lens of 10 µm radius (see Fig.1). The body fiber length is 5 mm in order to allow full development of the flow upstream from the lenses. In the same way, the channel downstream from the lens was designed with a length of 5 mm to allow flow stabilization.
The blood flowing in the channel was modeled as a non-Newtonian fluid with a density of ρ = 1050 kg.m−3[16]. The solid material corresponding to the walls of the channel was modeled
as PDMS with a density set to ρ= 0.97 kg.m−3. The model used for simulations was viscous
laminar. The viscosity follows a non-Newtonian power law to model blood fluid dynamics. The parameters of power law index, consistency index, minimum and maximum viscosity limit were taken from the literature [17]. A non-uniform meshing was generated by the software (ANSYS Meshing). The boundary conditions at the inlet and outlet were set to a mass flowrate determined according to the blood density and the flowrate measured for each pump rotation speed. Simulations at each targeted flowrate allowed to extract corresponding maximal velocity values at the center of the channel (see Table2) where the flow is fully developed when the fiber is placed upstream. Corresponding theoretical Doppler frequencies were calculated according to the relation introduced in section2.1using the refractive index of whole blood n= 1,3456 reported in literature for λ= 1550 nm [18].
Table 2. Summary of the measured flowrate used for inlet conditions in fluidic simulations with extracted maximal velocities in the center of the channel for each pump rotation speed and
corresponding Doppler frequencies
Pump rotation speed (rpm) Flowrate (mL/min) Velocity (cm/s) Doppler frequency fD(kHz)
23 40 12,9 226
35 60 17,7 310
50 88 25,2 441
60 114 31, 9 559
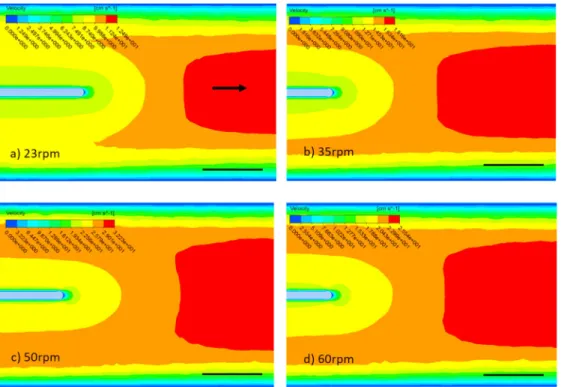
Computational fluid dynamics were used to investigate flow disturbance induced by the different fiber types positioned upstream or downstream in the channel. Geometries of the three different fibers were designed using the computer-assisted design unit of the software. The stabilization distance of the flow from the end of the lens for each of the different flowrates were studied. Simulations showed that the different lens tip geometries do not have an impact on flow disturbance. Figure6a to Fig.6d shows 2D maps of the velocity modulus in a plane horizontally centered in the channel for inlet flowrates corresponding to the four pump rotation speeds in the case of Fiber B positioned upstream. In each case the typical dimension of the region where the velocity is reduced by the presence of the fiber is 3 mm. Beyond a distance of 3 mm, the flow is stabilized as it can be observed in Fig.6a to Fig.6d. This 3 mm stabilization distance is identical
for the three different fibers and for the different flowrates investigated as long as the fiber is positioned in the direction of the flow,i.e. upstream.
Fig. 6. Velocity magnitude map in a plane horizontally centered in the fluidic channel in the case of Fiber B positioned upstream for each pump rotation speed. The scale bar is 1 mm and the arrows points flow direction, which is the same on the four images. a) Velocity magnitude map at 23 rpm. b) Velocity magnitude map at 35 rpm. c) Velocity magnitude map at 50 rpm. d) Velocity magnitude map at 60 rpm.
4.2. Laser Doppler velocimetry
Blood samples from healthy donors collected in ethylenediaminetetraacetic acid (EDTA) tubes were supplied from the EFS-Toulouse (Etablissement Francais du Sang in Toulouse, France). We mixed blood samples from three donors to reach the necessary volume (3 times 8 mL) to perform experiments.
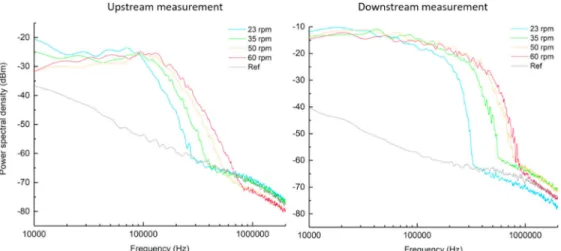
In the same way as described in section3.3, experiments were conducted at each pump rotation speed with the three different fibers presented in section2.1pointing in the flow direction (fiber positioned upstream). A reference signal was recorded by turning on the laser and turning off the peristaltic pump resulting in the illumination of a steady fluid. The measurement was performed using the spectrum analyzer with an accumulation over 50 spectra. The average spectrum obtained when using Fiber A upstream and downstream presented in Fig.7(a) and Fig.7(b) respectively, are very similar as the one obtained for a suspension of microbeads in PBS. A clear cut-off frequency can be observed allowing the extraction of a maximal blood flow velocity in the center of the fluidic channel.
Recorded power spectral densities exhibit similar behaviors in upstream and downstream measurements. Cut-off frequencies extracted in the case of downstream measurements are higher in comparison with the ones extracted in the upstream case for equivalent pump rotation speed conditions. This is due to different fluid dynamics at the vicinity of the fiber tip for the two different configurations. Fluidic simulations showed that the typical distance of the region where
Fig. 7. Power spectral density recorded when using Fiber A on whole blood. Light is pointing in the flow direction,i.e. the fiber is located upstream.
the velocity is reduced by the presence of the fiber is 2 mm in the case of downstream positioning of the fiber, which is shorter than the result obtained for upstream positioning, evaluated at 3 mm (see section4.1.). Fluidic simulations also showed that maximal flow velocities at the fiber tip vicinity are higher in the case of downstream positioning of the fiber, which explains the extraction of higher cut-off frequencies from the experimental measurements. Foreseeing the final intravascular blood flow velocity measurement application, we focused on the upstream positioning of the fiber required for a practical insertion of the fibervia a conventional catheter. The cut-off frequencies for Fiber A when positioned upstream are 314 ± 50 kHz, 426 ± 50 kHz, 680 ± 50 kHz and 835 ± 50 kHz for the pump rotation speeds of 23, 35, 50 and 60 rpm respectively. In the case of Fiber A, cut-off frequencies exceed between 40 and 50% the theoretical Doppler frequencies calculated based on estimated maximal velocities in the channel (see Table2). The corresponding extracted maximal velocities at the center of the channel are 17,9 ± 2,8 cm.s−1, 24,3 ± 2,8 cm.s−1, 38,8 ± 2,8 cm.s−1and 47,7 ± 2,8 cm.s−1. Similar spectra were obtained using Fiber B and Fiber C. A major result obtained when using the three different fibers is the linearity of the cut-off frequencies increase with Vmaxat each pump rotation speed as it can be seen
in Fig.8. Depending on the fiber used, the linear regression slopes are measured between 13 and 28 showing deviation from the theoretical slope calculated using the formula introduced in section2.1. We assess that the differences in values extracted from measurements in comparison to simulation estimations and theoretical linear regression slopes are due to blood complex composition where additional events such as multiple scattering are occurring. In this case, the radius of curvature of the lens seems to influence the measurement as we can clearly identify a different trend of the linear regression for each fiber used (see Fig.8). This result is in contrast with the one obtained in the case of a diluted microbead suspension, where the three fibers exhibited the same linear dependence and may indicate that, in whole blood, multiple scattering events affect significantly laser Doppler velocimetry measurements.
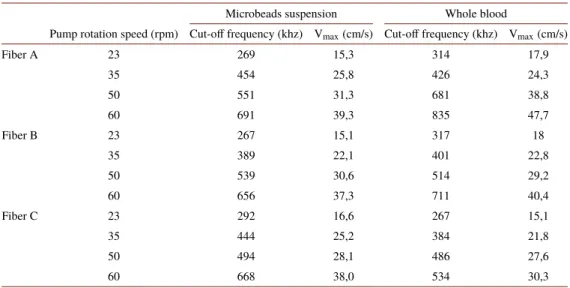
As a summary of experimental data collected through this work, extracted maximal velocities for each fiber in the different flow conditions on microbead suspension and whole blood are presented in Table3. For all reported values, measurement uncertainty on the cut-off frequency is 50 kHz yielding to a measurement uncertainty of 2,8 cm.s−1for the corresponding velocity.
Fig. 8. Linear evolution of the cut-off frequencies as a function of Vmaxfor each pump rotation speed, for the three different fibers positioned upstream. The data points correspond to the experimental measurements and the curve is a linear fit. Correlation coefficients and slopes from the linear regression analysis are summarized on the chart.
Table 3. Extracted maximal velocities for each fiber in the different flow conditions on microbeads suspension and whole blood
Microbeads suspension Whole blood
Pump rotation speed (rpm) Cut-off frequency (khz) Vmax(cm/s) Cut-off frequency (khz) Vmax(cm/s)
Fiber A 23 269 15,3 314 17,9 35 454 25,8 426 24,3 50 551 31,3 681 38,8 60 691 39,3 835 47,7 Fiber B 23 267 15,1 317 18 35 389 22,1 401 22,8 50 539 30,6 514 29,2 60 656 37,3 711 40,4 Fiber C 23 292 16,6 267 15,1 35 444 25,2 384 21,8 50 494 28,1 486 27,6 60 668 38,0 534 30,3
5. Conclusion
The three investigated fibers with different lens radius of curvature exhibited similar power spectral density profiles characterized by a plateau at high spectral density then decreasing abruptly at a specific cut-off frequency. The plateau corresponds to the range of velocities and directions of particles disturbed by the fiber within flow and the cut-off frequency represents the maximal velocity detected inside the probed region. Cut-off frequencies of each fiber showed excellent linearity with the maximal velocities estimated in the channel. In the case of the microbead suspension flow measurement, extracted velocities are in good agreement with Poiseuille law and Particle tracking velocity estimations. Slope values of the linear regressions are in agreement with the theoretical slope calculated using PBS refractive index and laser wavelength. Regarding blood flow measurement, extracted maximal velocities values are up to 50% higher than the ones estimated using fluidic simulations based on non-Newtonian power law. As it can be observed in the deviation of linear regression slopes extracted from measurements with theoretical values, the Doppler formula introduced in section2.1which links the Doppler frequency to the particle velocity is not adequate in the case of blood. This discrepancy in whole blood can be attributed to light multiple scattering events due to the large concentration of moving particles with different size ranges found in this complex fluid. Doppler shift of a multiple scattered source is described as a superposition of individual scattering events [19] resulting in an increased measured velocity. In our case, we observed that the higher the radius of curvature, the higher the measured cut-off frequencies. For higher tip radius, we hypothesize that higher volumes of liquid are sensed increasing the occurrence of multiple scattering events. Despite this observation, extracted cut-off frequencies evolve linearly with velocity estimations proving that this setup can be used to detect relative flow velocity variations or to perform absolute velocity measurements using the appropriate calibration. This work is a proof of concept of the feasibility ofin situ blood flow velocity measurement in a velocity range which is consistent with blood flow velocities reported for veins and arteries. Results obtained in this study show that the described system has great potential in clinical routine as a tool for intravascular monitoring of blood flow velocity. Moreover, the integration of a telecom laser in the system allows obtaining a low-cost and portable setup.
Funding
Agence Nationale de la Recherche (ANR-15-CE19-0020).
Disclosures
The authors declare that there are no conflicts of interest related to this article.
References
1. G. Wyatt, “Blood flow and blood velocity measurement in vivo by electro- magnetic induction,”Trans Inst M C4(2),
61–78 (1982).
2. F. Zhang, C. Lanning, L. Mazzaro, A. J. Barker, P. Gastes, W. D. Strain, J. Fulford, O. E. Gosling, A. C. Shore, N. G. Bellenger, B. Rech, J. Chen, J. Chen, and R. Shandas, “In Vitro and Preliminary In Vivo Validation of Echo Particle Image Velocimetry in Carotid Vascular Imaging,”Ultrasound in Medicine & Biology37(3), 450–464 (2011).
3. A. J. Powell and T. Geva, “Blood Flow Measurement by Magnetic Resonance Imaging in Congenital Heart Disease,” Pediatr. Cardiol., Proc. World Congr., 2nd21(1), 47–58 (2000).
4. Y. Aizu and T. Asakura, “Coherent Optical Techniques for Diagnostics of Retinal Blood Flow,”J. Biomed. Opt.4(1),
61 (1999).
5. G. T. Feke and C. E. Riva, “Laser Doppler measurements of blood velocity in human retinal vessels,”J. Opt. Soc. Am.68(4), 526 (1978).
6. S. Akiguchi, H. Ishida, T. Andoh, T. Hachiga, T. Shimizu, Y. Kuraishi, H. Shirakawa, and K. Ueyama, “Measurement of blood flow velocity in a model of stenosisin vitro and in mesenteric vessels in vivo using non-invasive micro multipoint laser Doppler velocimetry,”Meas. Sci. Technol.23(4), 045702 (2012).
7. L. Scalise, W. Steenbergen, and F. de Mul, “Self-mixing feedback in a laser diode for intra-arterial optical blood velocimetry”,”Appl. Opt.40(25), 4608 (2001).
8. G. W. Schmid-Schoenbein and B. W. Zweifach, “RBC velocity profiles in arterioles and venules of the rabbit omentum”,”Microvasc. Res.10(2), 153–164 (1975).
9. A. Nadort, R. G. Woolthuis, T. G. van Leeuwen, and D. J. Faber, “Quantitative laser speckle flowmetry of the in vivo microcirculation using sidestream dark field microscopy,”Biomed. Opt. Express4(11), 2347 (2013).
10. S. L. Chen, Z. Xie, P. L. Carson, X. Wang, and L. J. Guo, “In vivo flow speed measurement of capillaries by photoacoustic correlation spectroscopy,”Opt. Lett.36(20), 4017 (2011).
11. T. Tajikawa, W. Ishihara, S. Kohri, and K. Ohba, “Development of Miniaturized Fiber-Optic Laser Doppler Velocimetry Sensor for Measuring Local Blood Velocity: Measurement of Whole Blood Velocity in Model Blood Vessel Using a Fiber-Optic Sensor with a Convex Lens-Like Tip,”J. Sens.2012, 1–11 (2012).
12. O. T. Strand, L. V. Berzins, D. R. Goosman, W. W. Kuhlow, P. D. Sargis, and T. L. Whitworth, “Velocimetry using heterodyne techniques,” in (D. L. Paisley, S. Kleinfelder, D. R. Snyder, and B. J. Thompson eds.), Proceedings of the SPIE, 5580 593–599 (2005).
13. Y. Bai, D. Ren, W. Zhao, Y. Qu, L. Qian, and Z. Chen, “Heterodyne Doppler velocity measurement of moving targets by mode-locked pulse laser,”Opt. Express20(2), 764 (2012).
14. A. Ooue, T. Ichinose-Kuwahara, A. K. M. Shamsuddin, Y. Inoue, T. Nishiyasu, S. Koga, and N. Kondo, “Changes in blood flow in a conduit artery and superficial vein of the upper arm during passive heating in humans,”Eur. J. Appl. Physiol.101(1), 97–103 (2007).
15. W. Z. Song, X. M. Zhang, L. K. Chin, C. S. Lim, A. Q. Liu, P. H. Yap, and H. M. Hosseini, “Optical detection of living cells’ refractive index via buffer modulation of microfluidic chip,”The 10th International Conference on
Miniaturized Systems for Chemistry and Life Sciences (µTAS2006) Tokyo (2006).
16. C. C. Botar, T. Vasile, S. Sfrangeu, S. Clichici, P. S. Agachi, R. Badea, P. Mircea, M. V. Cristea, and R. Moldovan, “CFD Simulation of the Portal Vein Blood Flow,” inInternational Conference on Advancements of Medicine and
Health Care through Technology (S. Vlad, R. V. Ciupa, and A. I. Nicu eds.), 26, 359–362 (Springer Berlin Heidelberg,
2009).
17. M. W. Siebert and P. S. Fodor, “Newtonian and Non-Newtonian Blood Flow over a Backward- Facing Step – A Case Study,”Proceedings of the COMSOL Conference 2009 Boston (2009).
18. E. Lazareva and V. Tuchin, “Blood refractive index modelling in the visible and near infrared spectral regions”,”J. Biomed. Photonics Eng.4(1), 010503 (2018).
19. P. Snabre, J. Dufaux, and L. Brunel, “Diffuse Laser Doppler Velocimetry from Multiple Scattering Media and Flowing Suspensions,”Waves and Imaging through Complex Media (P. Sebbah ed.), 369–382 (Springer, 2001).