HAL Id: hal-01230766
https://hal.archives-ouvertes.fr/hal-01230766
Submitted on 3 Feb 2021
HAL is a multi-disciplinary open access
archive for the deposit and dissemination of
sci-entific research documents, whether they are
pub-lished or not. The documents may come from
teaching and research institutions in France or
abroad, or from public or private research centers.
L’archive ouverte pluridisciplinaire HAL, est
destinée au dépôt et à la diffusion de documents
scientifiques de niveau recherche, publiés ou non,
émanant des établissements d’enseignement et de
recherche français ou étrangers, des laboratoires
publics ou privés.
Three-dimensional representations of complex
carbohydrates and polysaccharides–SweetUnityMol: a
video game-based computer graphic software.
Serge Pérez, Thibault Tubiana, Anne Imberty, Marc Baaden
To cite this version:
Serge Pérez, Thibault Tubiana, Anne Imberty, Marc Baaden. Three-dimensional representations of
complex carbohydrates and polysaccharides–SweetUnityMol: a video game-based computer graphic
software.. Glycobiology, Oxford University Press (OUP), 2015, 25 (5), pp.483-91. �hal-01230766�
Three-Dimensional Representations of Complex Carbohydrates and
Polysaccharides: A Video Game Based Computer Graphic Software.
Serge Pérez
a*, Thibault Tubiana
b, Anne Imberty
c, Marc Baaden
ba.
Département Pharmacochimie Moléculaire, CNRS, UMR 5063, University Grenoble-Alpes, France
b.
Laboratoire de Biochimie Théorique, CNRS, UPR 9080, Univ. Paris Diderot Sorbonne Paris Cité, Paris France.
c.
Centre de Recherches sur les Macromolécules Végétales, CNRS, UPR 5301 ; Univ. Grenoble Alpes, France
ABSTRACT
A molecular visualization program tailored to deal with the range of three-dimensional structures of complex carbohydrates and polysaccharides, either alone or in their interactions with other bio-macromolecules, has been developed using advanced technologies elaborated by the video games industry. All the specific structural features displayed by the simplest to the most complex carbohydrate containing molecules have been taken into account and can be conveniently depicted. This concerns the monosaccharide identification and classification, conformations, location in single chain or multiple branched chains, depiction of secondary structural elements, and the essential constituting elements in very complex structures. In all these instances, particular attention was given to cope with the accepted nomenclature and pictorial representation used in carbohydrate chemistry, biochemistry and glycobiology. The present achievement provides a continuum between the most popular ways to depict the primary structures of complex carbohydrates to visualizing their 3D structures while giving the users many options to select the most appropriate modes of representations including new features such as those provided by the use of textures to depict some molecular properties in an intuitive way. The present approach emphasizes how advanced technologies developed by the video game industry can be used and extended to the delivery of easily modifiable and extensible scientific research tools. These developments are incorporated in a stand-alone viewer capable of displaying molecular structures, bio-macromolecule surfaces, and complex interactions of bio-macromolecules, with powerful, artistic and illustrative rendering methods. They result in an open source software compatible with multiple platforms i.e. Windows, MacOS and Linux operating systems, web pages,
tablets and smartphones, and producing publication-quality figures. To demonstrate their utility, the algorithms and visualization enhancements are demonstrated using a variety of carbohydrate molecules, from glycan determinants to glycoproteins and complex protein-carbohydrate interactions, as well as very complex mega-oligosaccharides and bacterial polysaccharides and multi-stranded polysaccharide architectures.
INTRODUCTION
As a discipline, Glycoscience is benefitting from the major advances that structural elucidation methods are bringing to structural biology. Significant and rapid progress arising from the use of synchrotron radiation sources, free electron lasers, and major advances in high resolution NMR spectrometry and electron microscopy are major contributors to these advances. In conjunction with these experimental sources of structural investigations, computational and molecular modeling methods are bringing complementary information. Progress with algorithms and increases in computational power enable the prediction of carbohydrate 3D structures and the simulation of these molecules in their natural environment (i.e. solvated in water), in concentrated solution such as the insertion of glycolipids anchored within a lipid environment) or in the binding site of a protein receptor. In all cases, the 3D structures/architectures are defined by a set of final atomic coordinates, from which molecular structural features (i.e. bond lengths, bond angles, torsion angles, hydrogen bonds, and intermolecular distances) can be directly computed. Representations of molecular surfaces (…….) coupled with the visualization of electrostatic field lines are also possible.
Several distinct repositories hold 3D structural information which has been experimentally and
theoretically determined for carbohydrates and carbohydrate containing molecules. The Cambridge Structural Data Base contains entries in the form of structural data related to molecular crystals (Allen, 2002) The amount of data related to carbohydrates is over 5000; only a small fraction is relevant to the field because many deal with synthetic compounds or because of the limited size of the oligosaccharides (Perez, 2007; Perez et al., 2000 ). An increasing number of crystal structures has been reported for glycoproteins and protein-carbohydrate complexes. Information can be assessed in the Protein Data Bank (PDB) (Berman
et al., 2003). With more than 5000 entries for
glycoproteins or protein-carbohydrate complexes, the PDB forms a valuable resource for glycoscientists. About 7% of the three-dimensional structures deposited in the PDB contain carbohydrate residues. The vast majority of the carbohydrate chains that are present in the PDB are N-glycans or noncovalently bound ligands. O-Glycan chains form a minority. In total, about 3.5% of the proteins in the PDB carry covalently bound glycan chains and thus can be classified as glycoproteins. The quality of the data does not always meet the high quality standards, the structure needs to be curated and annotated. The GLYCOSCIENCES.de web portal (Lutteke et al., 2006) and the Glycoconjugate Data Bank (Nakahara et al., 2008) provide convenient ways for searching carbohydrate structures in the PDB. The lectin data base (Perez et al., 2015) and other structural data bases available on the glyco3D portal http://glyco3d.cermav.cnrs.fr offer curated and annotated structural information.
As for the polysaccharide structures an annotated database has been established, PolySac3DB, that contains the 3D structural information of about 160 polysaccharide entries that have been collected from an extensive screening of scientific literature (Sarkar & Perez, 2012). As regard to theoretical characterizations, the complexity of oligosaccharide and polysaccharide topologies has required the design of dedicated molecular building procedures that can convert sequence information into reliable 3D models. They are all based on the linking of pre-constructed 3D molecular templates of monosaccharides followed by energy minimization (Lutteke et al., 2006, Engelsen et al., 2013, Woods, 2014). Several data bases containing such established 3D structures are available.
The rapid expansion of these sets of structural information requires the development of appropriate tools capable of representing and
visualizing the range of carbohydrate structures from the simplest oligosaccharides found in glycan determinants to the most complex macromolecular structures and assemblies. Whereas standard molecular visualizations, such as the ball-and-stick representation are adequate for oligosaccharides, they are no longer suitable for polysaccharide chains and large macromolecular complexes. Previous experiences from the field of proteins and nucleic acids have highlighted the need to use more abstract cartoon representations such as ribbon diagrams fitted to the backbone of the protein molecule or the use of cylinders to represent alpha-helices and flat arrows to represent beta-strands. This is at the expense of showing all the atomic details which obscure the 3D structures. Such a need to simplify the visualization of carbohydrates was recognized and implemented in two graphic algorithms demonstrating the effectiveness of this type of representation (Kuttel et al., 2006, Cross et al., 2009). However, the lack of any accepted convention for carbohydrate visualization along with the limited audience of users have not allowed any progress towards establishing any consensual mode of representations.
There is therefore a clear need to develop a molecular visualization program that would cope with the uniqueness of the range of carbohydrate structures, either alone or in complex environments in particular with proteins and lipids. As well as this, this program should closely follow the most accepted symbolic representations for monosaccharides and existing formats for atomic coordinates. With the aim of touching a wide audience, multiple platforms should be supported, i.e. computers on Windows, MacOS and Linux operating systems, web pages, tablets and smartphones, to produce publication-quality figures. Due to the lack of any accepted conventions there is also the need to deliver computer software with open access to the source code that should be easily modifiable to take into account suggestions that would allow implementations of modified types of representations.
In a recent work, it was shown that an easy modifiable and extensible macro- molecular viewer could be implemented in a short time and limited development effort using video game technology (Lv et al., 2013). An entirely fluid and interactive manipulation could be reached for large macromolecular objects comprising 100 000 atoms. This is obtained using the Unity3D game engine, a free engine for non-commercial uses
(Unity3D, http://unity3d.com). In this article, we describe the implementation and performances of a series of features aimed at visualizing the specific structural features displayed by the simplest to the most complex carbohydrate containing molecules, while keeping all the functionalities previously developed for large macromolecular systems. Part of the work is inspired by the contribution of Dr. Kuttel who opened some routes for visualization of carbohydrate molecules (Kuttel et al., 2006; Cross
et al., 2009).
METHODOLOGY
From UnityMol to SweetUnityMol.
The game engine Unity3D was used to develop UnityMol (Lv et al., 2013), a viewer for molecular structures and biological networks. Unity3D provides access to many common visualization tools such as triangulated spheres, triangulated cubes, and
lines….
along with several elements in the environment which can be modified on-line by the user, such as colors, textures, skyboxes, effects and shader parameters,…… Different molecular representations are implemented in UnityMol. Atom spheres can be depicted via particle systems. Unity triangulated spheres can be used for atoms and lines for interatomic bonds. The so-called hyperballs representation has also been implemented as a way to use a unified algorithm to display balls, sticks and hyperboloids (Chavent etal., 2011). Different types of molecular surfaces
can be represented, with the particular addition of cut planes, which enables visualization of hidden elements in the interior of the molecular object. The use of lit sphere shading offers the production of artistic and illustrative rendering for any type of representation. This is a rendering technique inspired from artistic methods to depict light and shadows on a 3D object drawn on a 2D-surface. Finally, several visual effects are also available
Structural diversity and visualization challenges.
With respect to other kinds of biomolecules, the visualization of carbohydrates offers a certain level of complexity which stems from the nature of their stereochemistry. Carbohydrates differ from proteins in several important features. The first difference occurs at the level of the primary structures. The number of different building blocks available, i.e. the monosaccharides, is much larger than the number of different amino acids. At the present time more than 120 different monosaccharides have been identified (Perez, 2014). The diversity of carbohydrate structures results from such a broad range of monomers, and
the different ways in which these monomers are joined. Thus, even a small number of monosaccharide units may generate a large number of different oligosaccharides, including branched structures, a unique feature among biomolecules.
Monosaccharides with five or more carbon atoms generally form both open and cyclic structures. Hexoses form mostly six-membered pyranose rings which can take up several conformations (chair, C; twist, T; boat, B; envelope, E; skew, S). Pentose form five-membered furanose rings, and their ring shape may encompass 20 twist and envelope shapes (Kamerling 2007). Contrary to proteins and nucleic acids, the backbone of the carbohydrate structures is usually constituted by the consecutive assembly of chemically different units (which also display a variety of side chain substituents and orientations). Other topological features are the occurrences of branches, which may be multi-branched. As regard to polysaccharide chains, they may be either disordered or ordered in the form of simple or multiple helices. They can form quaternary structures resulting from parallel or anti-parallel arrangements of such polar chains.
Accessing Carbohydrate Structural Data.
For structural data, the Protein Data Bank format is widely used for biomolecules (Breman, 2000). PDB files describing 3D structures of glycoproteins and protein-glycan complexes can be directly downloaded from the PDB server by entering the molecule ID. They are parsed to extract relevant atom information such as atom type, residue name, coordinates and residue ID. Carbohydrate residues found in the PDB are defined using a three-letter encoding. There are more than 800 different monosaccharide residue names used in PDB entries. Since such a code is used to uniquely assign carbohydrates, a new residue name is required for each stereo-chemically different sugar unit and each substitution. However, PDB structures obtained more than 20 years ago may contain non-standard names for glycan residues. At the present time the identification of the most common monosaccharides of biological relevance can be traced and recognized.
When dealing with structures obtained from Cambridge Data Base or generated by molecular builders, the coordinate files may be in different format. Molecular graphics software can generate PDB files form other format. Widely used examples include Chimera (Petersen, E.F. et al., 2004), Jmol (Hanson, 2010), Python Molecular Viewer (Sanner, 1999) PyMol (DeLano, 2002) and
Visual Molecular Dynamics (Humphrey et al., 1996).
A particular feature deals with the use of the molecular builder POLYS, which provides the same functionality as other software packages but is more focused on the construction of carbohydrate biopolymers. POLYS is unique with respect to generating linear or branched polysaccharide chains, in the form of single or multiple helices, a feature that none of the other builders can provide (Engelsen et al., 2013). The source of building blocks for POLYS is contained in the monosaccharide database that includes optimized molecular structures for a majority of the occurring monosaccharides. For each monosaccharide, a unique and compact residue ID is defined in the closest possible agreement with the IUPAC nomenclature for carbohydrates (McNaught et al., 1997). The construction follows a tree-like
representation of the topology and keeps track of the location of each constituting monosaccharide as part of the main backbone or any side chains. In the case of multiple helices, each single strand is identified by a proper indicator.
In all cases, molecule topology is built by using typical interatomic distances to detect bonds and connectivity. All interatomic bonds are created by UnityMol, based on distance criteria or extracted from the connectivity record in the atomic coordinate file (PDB Keyword: “CONNECT”). Surfaces are generated either externally as meshes (from files containing vertex and face information) or internally from a density grid surface approach. Such type of constructions and representations are fully compatible with the pre-configured style (CPK, Licorice, VdW, Smooth Hyperballs) used to represent protein and nucleic acid structures (Fig. 1).
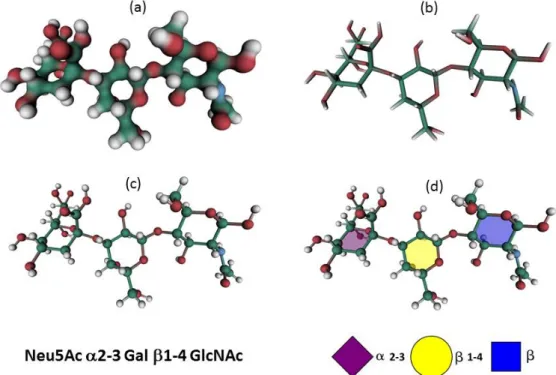
Figure 1. Different molecular representations implemented in SweetUnityMol to display carbohydrate structures, as exemplified with the glycan determinant Neu5Ac 2-3 Gal 1-4 GlcNAc. (a) HyperBalls representation; (b) Licorice representation; (c) Sticks representation; (d) RingBlending representation, superimposed with the Ball-and-Sticks representation, where each monosaccharide ring is filled with the colour code of the CFG.
In addition, two algorithms aimed at dealing with the specificity of carbohydrates have been implemented. The first algorithm, termed Ring
Blending, emphasizes the type and conformation
of the carbohydrate rings. The second, Sugar
Ribbons, emphasizes the relative orientation of the
rings.
Identifying rings and glycosidic linkages.
Identification of the ring-forming atoms in the molecular structure to be displayed is a mandatory step to be followed by the identification of the atoms comprising the glycosidic linkages. Both steps are performed using a Depth First Search algorithm (Tarjan, 1972), a common method for searching tree or graph data structures This algorithm is based on the graph theory, i.e. the
entire molecule is converted into a graph, where each atom is a vertex (or node) and all interatomic bonds are edges. The search starts from an arbitrary atom, and proceeds via a thorough exploration of the molecular graph. It stops when either a ring is found or when the user-defined maximum ring size is reached, which in the present study was set to five and six. Once a ring has been identified, subsequent searches provide the location of inter-ring oxygen atoms (bonded to two carbon atoms) as well as the ring’s orientation. The paths connecting multiply branched rings are identified. From such identifications the sugar rings and backbone conformation can be emphasized and represented with or without ring substituents.
Constructing Sugar Ribbons.
As mentioned above, such abstract representations as ribbon diagrams (Richardson, 1981; Carson & Bugg, 1986; Carson, 1987) and other cartoon diagrams have offered effective and popular visualization for protein 3D structures. Unlike these visualizations which provide an approximate drawing of the molecule, we have developed an adjustable algorithm, entitled “Sugar
Ribbons” that offers a general visualization of
polysaccharide chains but keeps the possibility to display the details of the atomic representations. The Sugar Ribbons algorithm detects all sugar rings and connects them with the glycosidic linkage. All monosaccharides are directly connected to the next monosaccharide through the ring carbon atoms. The path connecting oriented rings is rendered as a series of polygons, with adjustable width and thickness. Each ring is depicted as a polygon, and linked to the following one by another disk having thinner dimensions which encompasses all the covalent bonds at the glycosidic linkage (i.e. ignoring the alpha or beta glycosidic configuration). The adjustable width and thickness of each constituting element is achieved throughout the creation of two faces (top and bottom) which are connected by edges of adjustable dimensions. All these graphical objects are simply constructed using a triangle mesh, a set of triangles that are connected by their common edges or corners. The atomic details which are kept in the Sugar Ribbons representation are the intra-cylic oxygen atoms as a way to indicate the polarity of the carbohydrate chains or segments, from the non-reducing to the reducing end.
Visualizing rings.
The complexity arising either from the conformational flexibility of the individual ring or from the diversity of the monosaccharides present
in any complex glycan is an incentive to design graphical and pictorial representations aimed at embracing any of these important features. This is accomplished using an algorithm entitled Ring
Blending which emphasizes the type, conformation
or even the location of the carbohydrate rings. The Unity3D drawing utilities are used to draw semi-transparent polygons. Each polygon is decomposed into a series of triangle, which is the basic geometrical shape to draw meshes in Unity3D. The built-in shaders called “Transparent/Diffuse” in Unity3D are used to draw the mesh. One feature of such a shader is to accept semi-transparent colors, and adjust the light according to the angle of the camera. Particularly well suited to displaying carbohydrate rings, this mode of representation can be used to provide novel visualizations of molecules which contain heterocycles and other cyclic structures, for example aromatic amino acids or DNA bases, or those found in flavonoids. Several options are available which may be obtained from a translucent overlay of the ball-and-stick atomic representations.
Visualizing Ribbons.
Starting from a previous implementation for protein ribbons in UnityMol, a custom shader was chosen for visualizing polysaccharide ribbons. The use of this graphical primitive is adequate to draw two faces of a disk to which a color coding can be associated to each face. Furthermore, the graphical element representing the linkage between two consecutive monosaccharides can be given its own color and style. This allows differentiation between the constituting elements of the ribbon.
Color Coding.
Ring color mapping. Both the Ring Blending and Sugar Ribbons algorithms offer the possibility to
clearly identify rings. This is particularly well suited for rendering the location of the rings much clearer than the depiction of the usual type of molecular representations, providing that an appropriate color mapping scheme is selected. To this end we implemented the pictorial representation of monosaccharides as symbols, following the concerted effort under the umbrella of the Consortium for Functional Glycomics (http://www.funcionalglycomics.org). The original initiative dealt essentially with mammalian glycans and has gained wide acceptance and applications to describe glycan composition and biosynthesis as illustrated for N- and O-linked glycan. It has been expanded to cover a wider range of monosaccharide units. (Perez, 2014). In keeping
with the concept of using a color scheme to clearly differentiate between constituting elements, those displayed in the rings identify the corresponding aldo pentose or aldo hexose. Extension has been made to cover the most common monosaccharide constituents of N- and O-glycans. As such the identification of monosaccharides is achieved by color. The conventional depiction of shape is not possible. To achieve this, the user has to overlay a ball-and-stick model to identify the nature and the orientation of the side-chains and connectivity. When the POLYS molecular builder is used, the monosaccharides are identified by a three letter code to which the CFG color coding is automatically associated. In order to provide a similar facility when downloading an atomic coordinate file from the PDB, a table of correspondence between the most frequently occurring monosaccharides (typically from N and O-glycans) has been set up, which allows for an automatic depiction of the sugars.
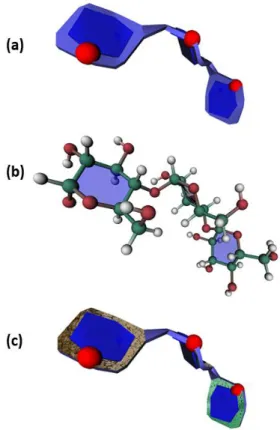
Figure 2. Different molecular representations of the 3D structure of maltotriose molecule: Glc 1-4 Glc 1-4 Glc, (blue CFG coding is given to the glucose units) (a)
SugarRibbon representation, where the intra-cyclic
oxygen atom is shown as a red sphere.(b) ball-and-stick representation to assess the hydrophilic/hydrophobic character of each every face; (c) graphical depiction of the hydrophobic faces ( brown-dry) and hydrophilic faces (green-wet).
Color coding chain identifiers. A further utility can
be used to attribute color coding to other topological features present in complex carbohydrates to distinguish among those units which are part of a main backbone from those which are located in branches and side chains. This feature can easily be put to work using the input file generated by the molecular builder POLYS that contains indicators of the location of each constituting monosaccharide as part of the main backbone or any side chains.
Texture.
The conformational preference in monosaccharides arises from the relative orientations (axial/equatorial) of the hydroxyl groups, their anomeric configurations, and the conformational flexibility of their hydroxymethyl groups. These factors can operate separately or collectively, creating moieties of the molecules (typically faces) having strongly different character, i.e. hydrophobic versus hydrophilic properties (Simon et al., 2009). These properties have some incidence on the binding of carbohydrates to proteins as aromatic amino acids are frequently observed to interact with the bound saccharide units. It is believed that aromatic residues contribute to specificity because of a capacity to discriminate between the different faces of the rings of individual monosaccharides. In such cases, hydrophobic interactions and the removal of hydration layers from binding surfaces contribute to the formation of stable carbohydrate–protein complexes. The visualization of such “dry” hydrophobic face and “wet” hydrophilic faces may be graphically depicted with the use of textures, a classical component of a game engine. Such a facility is offered to the user, who can interactively select the faces to be depicted along with a texture that appears to be the most suited to provide an intuitive depiction of a given property.
RESULTS
The series of the following examples illustrates how the applications of the developed algorithms and rendering enhancements provide adequate three-dimensional representations of the specific features of carbohydrate structures either alone or in complex with proteins. On purpose, the most traditional modes of visualization which are also available in the software (ball-and-stick, hyperball, licorice) are exemplified for sake of comparison (Fig. 1).
The following example is meant to illustrate the continuity that exists between the
pictorial representations of the glycan symbol nomenclature and the novel three-dimensional visualization produced by the Ring Blending algorithm. Both three-dimensional structures were
constructed using the POLYS facility (Engelsen et
al., 2013) and optimized using Shape (Rosen et al.,
2009).
Figure 3. Molecular representation of the repeat unit of the xyloglucan polysaccharide. The RingBlending representation is superimposed with the licorice representation, where each monosaccharide ring is filled with the colour code of the CFG.
Figure 3 represents one of the repeating unit of xyloglucans, which are hemicellulosic polysaccharides present in the primary cell walls of all types of higher plants. Xyloglucans consist of a
-D-(1-4) glucan backbone with D-xylosyl residues attached to the 6 position of approximately 75% of the glucosyl residues of the backbone. Some of the
-D-xylosyl residues are themselves substituted at
the 2-position with -galactosyl or -fucosyl (1-2)
Gal moieties.
Complex Oligosaccharides.
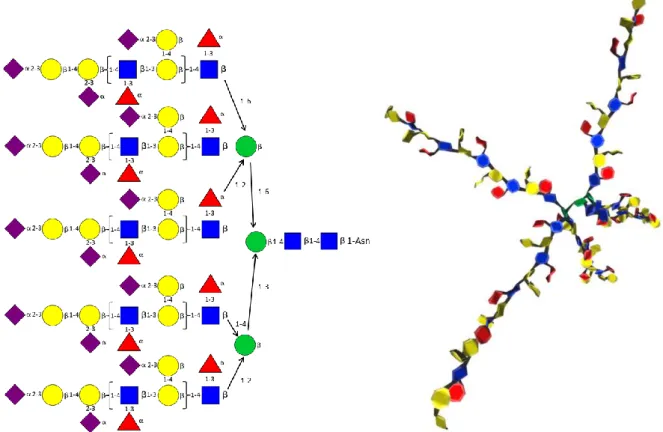
The example of a plant macromolecule, a model of the rhamnogalacturonan II (RG-II) pectin, illustrates the use of the Ring Blending algorithm to the visualization of complex mega-oligosaccharide. Within the large variety of complex carbohydrates present in the pectin polysaccharides, RG-II stands as a unique member exhibiting a very complex structure which is remarkably conserved among many species. RG-II contains L-Rhap, L-Araf, L-Fucp, D-Galp, D-GalpA, and D-GlcAp, and rare monosaccharides such as O-methyl-L-fucose, 2-Omethyl-D-Xyl, apiose, aceric acid, KDO, and DHA. RG-II has a backbone composed of at least eight (1–4)-linked--D-GalpA residues to which five structurally well-identified side chains are attached. The carboxyl groups of some of the D-GalpA residues are esterified with methyl groups. A total of 21 different disaccharide segments can be identified in RG-II. A model of its three-dimensional organization has been established through combination of high-resolution NMR spectroscopy and molecular modeling simulations (Perez et al.,
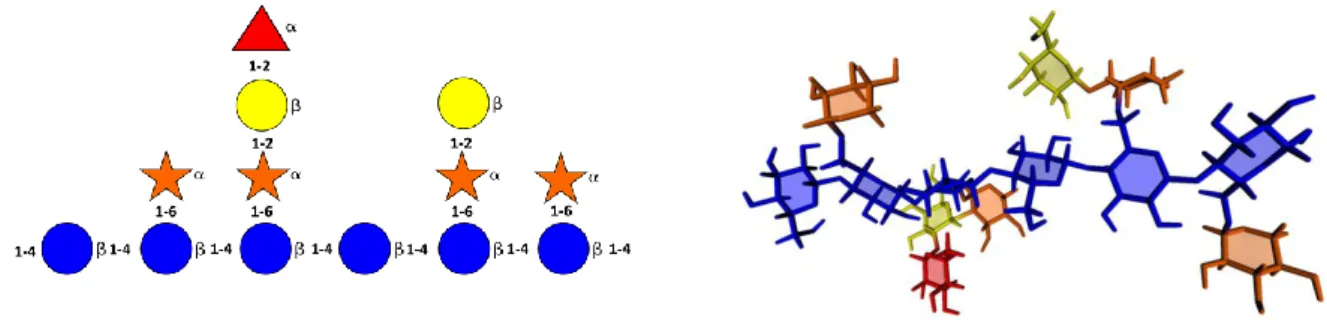
2003), and the three-dimensional structure was constructed using the POLYS molecular builder. (Fig. 4). Another example of extreme structural complexity that carbohydrates can create is offered by the primary structure of the carbohydrate moiety of a glycopeptide found in the fertilized egg of the Medaka fish Oryzias latipes (Taguchi et al., 1994). The carbohydrate side chain is repeated on every ninth amino acid, resulting in glycoprotein with carbohydrate content as high as 90%. This mega-oligosaccharide contains a total of 3455 atoms (135 residues). The glycan sequence was converted into an initial three-dimensional structure using POLYS (Engelsen et al., 2013), from which a low energy conformation was obtained using only global minimum data for the glycosidic linkages. The penta-antennary structure is shaped like a propeller in which the antennae are almost in a plane and the attachment site to the protein is pointing out of the plane. This glycan structure can also be constructed in a rod-like manner where the antennae can profit from favorable Van der Waals contacts. This may be the reason for the very short repeating sequence in the peptide backbone. In this instance, the Sugar Ribbon representation is chosen (Fig. 5). It provides an intuitive visualization of the type, conformation and location of the many constituting monosaccharides without being obstructed by the atomic details of the structure.
Figure 4. Molecular representation of the repeat unit of the mega-oligosaccharide: RhamnoGalacturonan II. The RingBlending representation is superimposed with the Ball-and-Sticks representation, where each monosaccharide ring is filled with the color code of the CFG. The constituting monosaccharides are: L-Rhap, L-Araf, L-Fucp, Galp, GalpA, and D-GlcAp, 2-O-methyl-L-fucose, 2-Omethyl-D-Xyl, apiose, aceric acid, KDO, and DHA.
Figure 5. Molecular representation in of the N-glycan found in the fertilized egg of the Medaka fish Oryzias latipes. (a) Primary structure; (b) The Sugar Ribbon representation is used with each monosaccharide being given the CFG color coding which provides an easy identification of the type and location of the constituting units.
Xanthan chain
Xanthan gum is a bacterial polysaccharide produced by a process involving fermentation of glucose by the Xanthomonas campestris
bacterium. Xanthan gum chain consists of repeating motifs of five monosaccharide units. The backbone of the polysaccharide chain consists of two -D-glucose units linked 1-4. The side chain consists of two mannose residues and one glucuronic acid residue. The side chain is linked to every other glucose of the backbone at the 3- position. About half of the terminal mannose units have a pyruvic acid group linked as a ketal to its 4 and 6 positions. Starting from the knowledge of this primary structure, and incorporating all the results derived from a detailed conformational analysis of all constituting disaccharides, a low energy conformation of xanthan chain was established (Vergelati & Perez, 1987). Figure 6a illustrates the use of color coding to visually identify the relative location of the monosaccharide substituents in a branched polysaccharide.
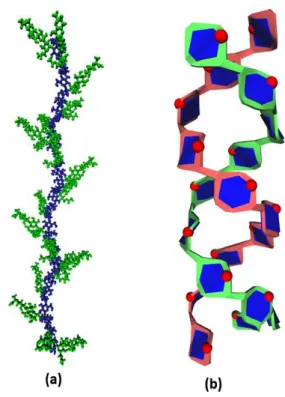
Starch double helical structure. In nature, plant
polysaccharides are commonly found as part of complex architecture. This is the case of starch where a complex alternation of crystalline, semi crystalline and amorphous layer constitutes the granule.
The 3-dimensional structure of the crystalline component has been established by X-ray fiber diffraction, electron diffraction and molecular modelling and shown to consist in double helices made of a parallel arrangement of left handed single strands (Imberty et al., 1988; Imberty & Pérez, 1988). Such a double helical structure is displayed in Fig. 6b using the Sugar Ribbon visualization algorithm that highlights the relative orientation of successive 1-4 linked glucose residues by the twist of the connecting motifs. The polarity of each single strand can be easily identified as the intra-cyclic oxygen atoms are clearly depicted. All glucose residues are displayed using the proper color coding (blue). Each single strand is shown using an arbitrary color given to the outer rings. Other rendering options may be inserted to provide examination of particular features such as the occurrence of intra- and inter chain hydrogen bonds (not shown in this article).
Figure 6. Molecular representation of the 3D structure (a) Xanthan polysaccharide, with an illustration of the colour coding used to depict the backbone versus the side chain; (b) Starch double helix, (left handed parallel stranded) using the Sugar Ribbon algorithm and the visualization of the ring oxygen atoms.
Glycoproteins.
The envelope protein gp120/gp41 of simian and hu man immunodeficiency viruses are the molecular agents of cell attachment and membrane fusion. As such they play a critical role in the viral entry into host cells. Because of the extreme structural flexibility and the heavily N-glycosylation of the protein, establishment of the 3D X-ray structure of its conformational state at a good resolution has presented enormous experimental difficulties. Starting from a structure solved at 4.0 A resolution, a new model was established using a normal mode based refinement method (Chen et al., 2009) (PDB Code 3FUS). Fig. 7a shows one representation of the 3D structure of the gp120 glycoprotein where the surface of the protein is displayed using a density grid isosurface approach and the
SugarRibbon visualization is applied to the several
glycan components. The RingBlending option is used to help the identification of each constituting sugars within the N-linked glycans, along with the optional representation of the intra-cyclic oxygen atom of each monosaccharide unit. (Fig. 7a). Illustrations of other possible selections to display this glycoprotein are given as Supplementary Material.
Protein-Carbohydrate Interactions.
Seeds from the legume tree Maackia amurensis contain two lectins that can agglutinate different blood cell types. Their specificity toward sialylated oligosaccharides is unique among legume lectins; the leukoagglutinin preferentially binds to sialyllactosamine: Neu5Ac 2–3 Gal 1– 4 GlcNAc, whereas the hemagglutinin displays higher affinity for a disialylated tetrasaccharide. The three-dimensional structure of the complex between M.
amurensis leukoagglutinin and sialyllactose has
been determined at 2.75 Å resolution using x-ray crystallography (Imberty et al., 2000) (PDB Code
1DBN). The carbohydrate binding site consists of a deep cleft that accommodates the three carbohydrate residues of the sialyllactose. The central galactose sits in the primary binding site in an orientation that has not been observed previously in other legume lectins. The carboxyl group of sialic acid establishes a salt bridge with a lysine side chain. The glucose residue is very efficiently docked between two tyrosine aromatic rings. The details of the interactions are best illustrated on Fig. 7b which exemplifies the interactions between the aromatic amino acids and the constituting monosaccharides of the glycan.
Figure 7. (a) Molecular representation of the 3D structure of the SIV GP120 where the protein surface is displayed without any texture The SugarRibbon visualization is applied to all glycan components and the RingBlending option is used to help the identification of each constituting sugar within the N-linked glycans (having the CFG color coding), along with the optional representation of the intra-cyclic oxygen atom of each monosaccharide unit. (b) Molecular representation of the details of the interactions occurring within the combining site of Maackia amurensis in interactions with Neu5Ac2–3 Gal 1–4 GlcNAc (same colour coding as in Fig. 1) illustrating the role of the aromatic amino acids (showed as red in a licorice representation).
HARDWARE, SOFTWARE IMPLEMENTATION
AND DEMONSTRATION.
Describe the development, benchmarking and testing: hardware and solftware,
Results presented in this article are mostly based on revision 646 of UnityMol and version 4.5.2f1 of Unity3D.
All source code was implemented using C# and Cg languages built into Unity 3D and is available along with executables for Mac, Windows and Linux platforms on the sourceforge projectwebsite.
http://unitymol.sourceforge.ne/sweet).
Documentation, input files, and series of illustrations can be found at
http://glycopedia.eu/SweetUnityMol/
.
Development and testing were carried out on a Mac Pro workstation with 3.2 GHz Intel Xeon quad-core processors, an nVidia GTX 285 graphics card. 16 Gb memory and Mac OS X 10.6.8 operating system. The functionality of Windows and Linux versions of SweetUnityMol was verified on several machines.
CONCLUSIONS
It was the aim of the present work to describe how the implementation of a series of graphical tools using video game technology could be performed to deal with carbohydrate molecules, while keeping all the functionalities previously developed for displaying large macromolecular systems. All the specific structural features displayed by the simplest to the most complex carbohydrate containing molecules have been taken into account and can be conveniently depicted. This concerns the identification of monosaccharides types, conformations, location in single chain or multiple branched chains, depiction of secondary structural elements, and the essential constituting elements in very complex structures. In all these instances, particular attention was given to cope with the accepted nomenclature and pictorial representation used in carbohydrate chemistry, biochemistry and glycobiology. The present efforts provide a continuous linkage between the most popular ways to depict the primary structure of complex carbohydrates to their three dimensional structures while giving the users many options to select the most appropriate modes of representation with respect to their on-going scientific endeavor. Glycans can be displayed in their associations and interactions with proteins, peptides, lipids and nucleic acids. Some of these pictorial modes of representation that have been developed are natural extensions to those most commonly used for other bio-macromolecules. More features nevertheless appear and it is thought that the introduction of complementary visual effects, such as textures, but also the addition of black lines to outline contours, or blur effects to simulate persistence of vision, are new tools which can be put to work to create more intuitive representations of complex architectures and related properties.
The depiction of glycans and polysaccharides benefits from the set of tools that was previously
developed and available in UnityMol. These are: (i) the rendering of molecular surfaces and the cut planes and the visualization of electrostatic potential (a useful way to represent the pathway that a charged molecule may follow guided by otherwise invisible electrostatic interactions), … The availability of physics engines can be used to model mechanical behavior of rigid molecular objects for example elastic joints, collision, dynamics,… All these features can now be dealt with using standalone software that is available on multiple informatics platforms. They can be expanded and more advanced novel features can be easily implemented,
These are certainly part of the new visual paradigm that will encompass the exploration and realization of new molecular graphics ideas and facilitate graphics developments to non-specialists. We trust that the wealth of structures that carbohydrates generate could be more easily explored and rationalized throughout the use of the platforms that the video game technology provides, helping glycoscientists to visualize and communicate their biomolecular structural data to a wide range of audiences (Johnson & Hertig, 2014).
ACKNOWLEDGMENTS
Many students contributed to debugging and improving the UnityMol version that was used as basis for Sweet UnityMol and we would like to explicitly thank S. Doutreligne, A. Kouyoumdjian, E. Ortie and C. Roudier. This work was supported by several grants of the French Agency for Research (Grant “ExaViz”, ANR-11-MONU-003) and the “Initiative d'Excellence” program from the French State (Grant “DYNAMO”, ANR-11-LABX-0011). Grant “WALLARRAY II”, “WallArray II: Glycan microarrays of cell wall polysaccharides in functional genomics” ANR-08-GENM-009).
REFERENCES
Allen FH. 2002 The Cambridge Structural Database: a
quarter of a million crystal structures and rising, Acta
Cryst. B58, 380:388
Berger, O., McBride, R., Razi, N. & Paulson, J. (2008) "Symbol Notation Extension for Pathogen
Polysaccharides", The Scripps Research Institute, Consortium for Functional Glycomics.
Berman HM, Westbrook J, Feng Z, Gililand G, Bhat TN et
al., 2000, The Protein Data Bank, Nucleic Acids Res. 28,
235:242.
Carson M, Bugg C. 1986. Algorithm for ribbon models of proteins, J. Mol.Graphics 4, 121:122.
Carson M. 1987. Ribbon models of macromolecules, J.
Mol. Graphics, 5, 103:106.
Chavent M, Vanel A, Tek A, Levy B, Robert S et al. 2011, GPU-accelerated atom and dynamic bond visualization using hyperballs: a unified algorithm for balls, sticks and hyperboloids, J. Comput. Chem, 32: 2924-2935. Chen X, Lu M, Poon BK, Wang Q, Ma J. 2009, Structural improvement of unliganded simian immunodeficiency virus gp120 core by normal-mode-based-X-ray crystallographic refinement, Acta Cryst, D65, 339:347. Consortium for Functional Glycomics:
http://www.functionalglycomics.org
Cross S, Kuttel M, Stone JE, Gain, J, 2009. Visualisation of cyclic and multi-branched molecules with VMD, J. Mol. Graphics Modell., 28: 131-139.
DeLano, W.L., 2002, The PyMol molecular graphics software. DeLano Scientific [on line]
http://www.pymol.org
Engelsen SB, Hansen P, Perez S. 2013, POLYS: An Open Source Software Package for Building Three-Dimensional Structures of Polysaccharides, Biopolymers, 101 , 733-743.
Hanson R.M. 2010, Jmol – A paradigm shift in crystallographic visualization, J. Appl. Crystallogr. 43, 1250:1260
Humphrey W. Dalke A, Schulten K. 1996, VMD-visual molecular dynamics, J. Mol. Graph. 14, 33:58. Glyco3D: A Portal for Structural Glycoscience, http://glyco3d.cermav.cnrs.fr
Imberty A, Chanzy H, Perez S, Buleon A, Tran V. 1988, The Double Helical Nature of A-Starch. J. Mol. Biol., 201, 365:378.
Imberty A, Perez S. 1988, A Revisit to the Three-dimensional Structure of B-Amylose. Biopolymers, 27, 1205:1221.
Imberty A, Gautier C, Lescar J. Perez S, Wyns L. Loris R. 2000, An usual carbohydrate binding site revealed by the structures of two Maakia amurensis lectins
complexed with sialic acid containing oligosaccharides,
J. Biol. Chem. 275, 17541-17548.
Johson G, Hertig S. 2014, A guide to the visual analysis and communication of biomolecular structural data,
Nature Reviews, 15, 690:698.
Kamerling, JP. 2007 Basic Concepts and Nomenclature Recommendations in Carbohydrate Chemistry, in
Comprehensive Glycosciences, Vol. 1, pp. 1-37,
Kamerling, J.P., Ed., Elsevier.
Kuttel M, Gain J, Burger A, Eborn E. 2006.Techniques for visualization of carbohydrate molecules, J. Mol. Graphics
Modell., 25: 380-388.
Kuttel, M, Mao Y, Widmalm G, Lundborg M. 2011, CarbBuilder: An adjustable tool for building 3D molecular structures of carbohydrates for molecular simulation, Seventh IEEE International Conference on eScience, 395:402.
Lütteke T, Bohne-Lang A, Loss A, Goetz T, Frank M, von der Lieth C-W 2006, :GLYCOSCIENCES.de: an Internet portal to support glycomics and glycobiology research. Glycobiology, 16:71R-81R.
Lutteke T, 2009. Analysis and validation of carbohydrate three-dimensional structures, Acta Cryst. D, 65: 156– 168.
Lv Z, Tek A, Da Silva F, Empereur-mot C, Chavent M, Baaden M. 2013, Game On, Science – How video game technology may help biologists tackle visualization challenges, PLOS One, 8, e57990.
McNaught AD. 1997, Nomenclature of carbohydrates (Recommendations 1996), Adv. Carbohydr. Chem.
Biochem., 52, 43:177.
Nakahara T, Hashimoto R. Nakagawa H. Monde K. Miura N. Nishimura SI, 2008, Glycoconjugate data bank structure – an associated database and N-glycan primary structure verification service, Nucleic Acid Res. 36, D368:D371.
Perez S. 2007, Oligosaccharides and polysaccharides by diffraction methods in Comprehensive Glycosciences, ,
Analytical aspects (Scope and limitations), Vol. 2 pp.
347-387. Kamerling, J.P., Ed., Elsevier
Perez S. Gautier C. Imberty A. 2000, Oliogosaccharides by diffraction methods in Ernst B. Hart GW. Sinay P. eds., Oligosaccharides in Chemistry- and Biology, pp.
969:1001.
Perez S, Vergelati C. 1987, Molecular modelling of the xanthan chain conformations, Int. J. Biol. Macromol., 9 211:218.
Perez S, Rodriguez-Carvajal MA, Docco T. 2003, A Complex Plant Cell Wall Polysaccharide :
Rhamnogalacturonan II. A Structure in Quest of a Function ?" Biochimie, 85, 109 :121.
Perez S, Sarkar A, Rivet A, Breton C, Imberty A. 2014 GLYCO3D: A Portal for Structural Glycosciences,
Perez S. 2014, The Symbolic Representation of Monosaccharides in the Age of Glycobiology,
http://glyopedia.eu.
Perez S, Rivet A, Imberty A, 2015, 3D-Lectin Database, Glycocoscience: Biology and Medicine (in press)
Petersen, E.F. et al., 2004 UCSH chimera – a visualization system for exploratory research and analysis, J. Comp.
Chem. 25, 1605:1612.
Richardson JS. 1981. The anatomy and taxonomy of protein structure, Adv. Protein Chem. 34, 167:218. Rosen J, Miguet L, Perez S. 2009, Shape: automatic conformation prediction of carbohydrates using a genetic algorithm, Cheminformatics, 1:16
http://www.jcheminf.com/content/1/1/16
Sarkar A, Perez S. 2012, PolySAc3DB: An Annotated Data Base of 3 Dimensional Structures of Polysaccharides,
BMC, BioInformatics, 13, 302
Sanner, M.F. 1999, Python: a programming language for software integration and development, J. Mol. Graph.
Model. 17, 57:61.
Simons JP, Davis BG, Cocinero EJ, Gamblin DP, Stanca-Kaposta EC. 2009. Conformational change and selectivity in explicitly hydrated carbohydrates, Tetrahedron
Asymmetry, 20, 718:722.
Taguchi T. Seko A. Kitajima K. Inoue S. Khoo K-H. Morris HR. Dell A. Inoue Y. 1994, Structural studies of a novel type of pentaantennary large glycan unit in the fertilization-associated carbohydrate-rich glycopeptide isolated from the fertilized eggs of Oryzias latipes. J. Biol.
Chem. 269 , 8762:8771
Tarjan R. 1972 Depth-First Search and Linear Graph Algorithm, SIAM J. Comp., 1, 146:160
Unity3D, http://unity3d.com
Wimmerova M. Kozmon S. Necasova I. Mishra SK. Komarek J. Koca J. 2012. Stacking information between carbohydrate and protein quantified by combination of theoretical and experimental methods. PLoS One, 7 46032
Woods R. 2014. GLYCAM Web. Complex Carbohydrate Research Center, University of Georgia, Athens, GA. (http://www.glycam.com)
![[PDF] Cours de systèmes d’exploitation informatique PDF - Cours maintenance PC](data:image/gif;base64,R0lGODlhAQABAIAAAP///wAAACH5BAEAAAAALAAAAAABAAEAAAICRAEAOw==)