HAL Id: hal-00630733
https://hal-mines-paristech.archives-ouvertes.fr/hal-00630733
Submitted on 10 Oct 2011
HAL is a multi-disciplinary open access
archive for the deposit and dissemination of
sci-entific research documents, whether they are
pub-lished or not. The documents may come from
teaching and research institutions in France or
abroad, or from public or private research centers.
L’archive ouverte pluridisciplinaire HAL, est
destinée au dépôt et à la diffusion de documents
scientifiques de niveau recherche, publiés ou non,
émanant des établissements d’enseignement et de
recherche français ou étrangers, des laboratoires
publics ou privés.
The performances of the HelioClim databases in
Mozambique
Lucien Wald, Philippe Blanc, Mireille Lefèvre, Benoît Gschwind
To cite this version:
Lucien Wald, Philippe Blanc, Mireille Lefèvre, Benoît Gschwind. The performances of the HelioClim
databases in Mozambique. ISES Solar World Congress 2011, Aug 2011, Kassel, Germany. pp.268-275.
�hal-00630733�
THE PERFORMANCES OF THE HELIOCLIM DATABASES IN MOZAMBIQUE
Lucien Wald, Philippe Blanc, Mireille Lefèvre and Benoît Gschwind MINES ParisTech, Center for Energy and Processes, Sophia Antipolis (France)
1. Introduction
The solar radiation reaching the ground level on horizontal surfaces is of paramount importance in many applications, from climate to health (ESRA, 2000), and of course for the production of energy: heat, electricity. This communication deals with the amount of energy received during a day on a surface of 1 m² located at ground surface and integrated over the whole spectrum of the solar radiation. This density of energy is called daily solar irradiation.
Meteorological networks measure the daily solar irradiation, also called daily solar exposure, and expressed in MJ/m² or J/cm². Accurate assessments of daily irradiation can now be drawn from images acquired by meteorological satellites (Cano et al., 1986; Diabaté et al., 1988; Solar Radiation Atlas of Africa, 1991; Zelenka et al., 1999). Stations measuring daily irradiation on the long-term are rare and satellites are an accurate way to complement or supplement them. Several initiatives are producing daily irradiation from satellite images. Among them, are the HelioClim databases presented hereafter. These databases have been qualified by comparison with measurements collected by meteorological stations. It has been concluded that they can be exploited in confidence for the prediction of daily solar irradiation. However, most of the comparisons were made for sites located in Europe and Northern Africa. As the interest towards Central and South Africa increases, the question of the merits of HelioClim databases in this area arises. This communication is a first step towards bringing a definite answer. It focuses on the country of Mozambique for a beginning. Owing to the World Radiation Data Center, data from several stations are available and of good quality. By comparing these data to daily irradiation contained in the HelioClim databases, we will assess the uncertainty of HelioClim for Mozambique.
2. The HelioClim databases
The HelioClim project is an initiative of MINES ParisTech / Armines launched in 1997, to increase knowledge on solar irradiation at ground level and to offer irradiation data for any site, any instant within a large geographical area and large period of time, to a wide audience (Blanc et al., 2011a; Rigollier, Wald, 1999). It covers Europe, Africa and the Atlantic Ocean. Three databases were created: HelioClim-1 to -3, abbreviated in HC-1, HC-2, and HC-3. Actually, the database HC-2 was created as a prototype of HC-3 and was removed in 2010. The construction of these databases HC-1 and HC-3 is made by exploiting the Heliosat-2 method (Rigollier et al. 2004) to convert satellite images into irradiation. The details of the construction are described by Lefèvre et al. (2007) and Blanc et al. (2011a).
HC-1 offers daily solar irradiation for the period 1985-2005, i.e., for 21 years. It has been created from archives of images of the Meteosat First Generation (MFG), and more exactly from a set of images in reduced spatial resolution, called ISCCP-B2 data. Blanc et al. (2011) consider that HC-1 has an effective pixel of 30 km in size in a first approximation. The validation of HC-1 has been performed for sites mostly located in Europe and Northern Africa (Abdel Wahab et al., 2009; Lefèvre et al., 2007). The root mean square difference (RMSD) between ground-based measurements and HC-1 for Northern Africa is approximately 130 J/cm²; (Abdel Wahab et al. 2009). As for European and African stations, including a few in Mozambique but for a period limited to 1994-1997, Lefèvre et al. (2007) found that the RMSD is fairly similar for all stations and is approximately 250 J/cm².
HC-3 began in 2004—1st February 2004—and is updated daily. It exploits the enhanced capabilities of the series of satellites Meteosat Second Generation (MSG) to deliver values of SSI every 15 min with a spatial resolution of 3 km at nadir. HC-3 database has gone through extensive validation of 15 min and hourly values. No article has yet been published on this validation, though the results for 29 sites—26 in Europe, one in the Middle East, one in North Africa, one in South Africa—are published on the SoDa Service
(www.soda-is.com/eng/help/helioclim3_uncertainty_eng.html). From these results, one can obtain a first approximation of the RMSD for daily values, which is better than for HC-1 for the same stations.
These databases are available on the SoDa Service (www.soda-is.com) where data can be downloaded easily (Gschwind et al., 2006). The whole database HC-1 is available for free on the SoDa Service. As for HC-3, its access is restricted to paying customers, except for the year 2005 which is freely available.
3. Ground-based measurements
National meteorological services (NMS) usually measure solar radiation at a few sites. Data are sent to the World Radiation Data Center (WRDC), located in Saint-Petersburg, in Russia, under the control of the World Meteorological Organization (WMO). There the data are archived and published. For data prior to 1994, a joint effort by WRDC and the National Renewable Energy Laboratory (NREL) of the USA resulted in an automatic delivery system of data based on Internet. Blanc et al. (2011b) discuss access to data for Africa. We used this very convenient system to download the daily values.
There is a fairly limited amount of African stations offering long time-series of daily solar irradiation of moderate to good quality available in WRDC. In the tropical and equatorial Africa, Mozambique is one exception. Thirteen stations have reported radiation data to WRDC between 1985 and 1998. However, after 1998, only 3 stations reported radiation data with many gaps in data. At the time of writing, only 1 station (Maputo) measures radiation data, the others have stopped or report sunshine duration only.
Quality of measurement is difficult to assess from the WRDC archives. All data are scrutinized at WRDC and quality-flagged before entering archives. However, no information on quality is provided with the radiation data. Thus, we have to consider that these data meet the requirements set by WMO (2008) for international exchange: relative uncertainty is 5% to 10% for good to moderate quality.
Table 1 provides the location of the three stations selected in Mozambique. The selection was made on the duration of the series of daily irradiation. The sites are in flat areas, separated by hundreds of km, and therefore for a given day, the three sites experience different weather situations. The number of days having valid values for both HC-1 and WRDC is of order of thousands for each site. Thus, the validation of HC-1 is statistically representative. As for HC-3, only Maputo has data after 2003 and can be used for comparison.
Tab. 1: Location of the three selected sites in Mozambique and the period of measurements
Station name and WMO identifier)
Latitude (°) Longitude (°) Elevation (m asl) Period
Beira (672970) -19.58 34.54 10 1985-01-01 to 1997-02-28 Maputo (673411) -25.58 32.36 70 1985-01-01 to 2009-12-31 Tete (672610) -16.11 33.35 123 1985-01-01 to 1998-12-31
4. Method for comparison
The quality of the ground data measurements of the global irradiation was controlled by the means of a Web tool in order to remove suspicious data (see at www.helioclim.net, Geiger et al., 2002). We follow the ISO standard (1995) to assess the quality of HC-1, or HC-3, versus ground-based measurements. We compute the difference: estimated-measured for each day, and summarize these differences by the bias, the standard-deviation, the root mean square difference (RMSD), the percentiles 5%, 10%, 50%, 90% and 95% of the difference. Values are also expressed in relative values with respect to the mean daily irradiation observed in ground-based measurements. In addition, we compute the correlation coefficient as well as the parameters of the regression line obtained by least-square fit. We performed this operation for all data merged together, and for each year separately.
The clearness index is the ratio of the daily solar irradiation at surface to that at the top of atmosphere. The clearness index quantifies the global transmittance of the atmosphere; it is very low when the sky is overcast
and large, say 0.8, when the sky is very clear. In a comparison over one or several years, using clearness index has the advantage of removing the seasonal effects due to changes in the geometry of the sun relative to the earth. These changes are well reproduced in the HelioClim databases. Using clearness index shows how much the HelioClim databases reproduce the cloud cover and the optical state of the atmosphere as a whole. Therefore, we perform the comparison in daily irradiation and daily clearness index.
A limitation to the comparison between ground-based measurements and satellite-derived data is due to the large differences in principles of measurements. Single point and temporally integrated data (ground-based measurements) are compared to spatially integrated and instantaneous data (satellite estimates). An assumption of ergodicity (e.g. here equivalence between the temporal and spatial averages) is usually made. This assumption is correct only if the field is spatially homogeneous over an area much larger than a pixel. This is generally false when a significant physiographic feature is present. Nevertheless, a discrepancy is expected because of the natural variability of the irradiation in space; from the work of Zelenka et al. (1999) on the natural variability of the hourly irradiation in space, Blanc et al. (2011a) wrote that a discrepancy of a few percent relative to the mean daily irradiation should be expected in such comparisons. Other local effects such as reflections on the surrounding slopes or the shadows of clouds may add to the difficulty in comparison.
Another type of comparison is performed: HC-3 versus HC-1, as there is an overlap of 23 months in these databases: from Feb 2004 to Dec 2005. Blanc et al. (2011a) discuss this issue. They underlined that the two data sets have different spatial properties and that one should expect a discrepancy that is due to the change in spatial resolution. In addition, the limited number of instantaneous satellite observations within a day used to create daily irradiation has an effect which cannot be predicted easily as demonstrated by these authors. Finally, using the previous comparison and the linear relationship that can be drawn between 3 and HC-1, we have computed a new data set, called HC-3adjusted. In this context “adjusted” means that this data set results from an alignment of HC-3 onto HC-1, and is consistent with HC-1 data. A comparison is performed between the ground-based measurements and HC-3, respectively HC-3adjusted. This is done only for the station of Maputo since it is the only one having data after 2003.
5. Results
Figure 1 displays the correlogram between ground-based measurements (horizontal axis) and HC-1 (vertical axis) for respectively, Beira, Maputo, and Tete. The identity line is also reported as well as the linear regression line. The three stations offer similar results.
The correlation between series of data is strong. The scattering of measurements is fairly low: points lie along the fitted line, whose slope is close to 0.9. There is an underestimation of the irradiation by HC-1. This is particularly noticed for the largest irradiations. Outliers can be observed but there are only very few. The correlogram for daily clearness index for Maputo is also displayed in Figure 1. The correlation is strong, too. The features are similar to those observed in correlograms for irradiation. One may conclude that HC-1 reproduces well the day-to-day variations of the actual daily irradiation and of the daily clearness index. The quality parameters for each station are presented in Table 2 for daily irradiation. As shown by the graphs, the three stations exhibit similar results. The bias is negative: HC-1 underestimates the daily irradiation. The bias is approximately -100 J/cm², and is approximately -5% of the mean daily irradiation obtained from ground-based measurements. The scattering of the differences is limited: the RMSD ranges between 270 J/cm² and 380 J/cm², i.e., 13% to 15% of the mean value. The correlation coefficient is large and greater than 0.85. The slope of the regression line is fairly close to 1: it ranges between 0.83 and 0.87. The results vary from one year to another. The bias can change by a factor 2. However, there are fairly small relative changes in RMSD and correlation coefficient. Changes can be explained by i) the limited quality of the ground-based measurements, ii) the limitations discussed above whose influences are a function of the weather and cloud cover, and iii) by the known uncertainties of the outcomes of the Heliosat-2 method as a function of these same quantities and others, such as the ground albedo that vary during time (Espinar et al., 2009).
Figure 1. Correlogram between ground-based measurements (WRDC) and HC-1 for the station Beira (upper left), Maputo (upper right), and Tete (lower left). On lower right, correlogram between WRDC and HC-1 for Maputo for daily clearness index.
Table 2. Comparison between HC-1 and WRDC for daily irradiation. Percentages are relative to the mean daily irradiation observed in ground-based measurements.
Beira Maputo Tete
Mean value (J/cm²) 2018 1917 2061 Number of days 3403 7265 3716 Bias (J/cm²) -111 (-5%) -101 (-5%) -90 (-4%) Standard-deviation (J/cm²) 259 (13%) 251 (14%) 297 (15%) RMSD (J/cm²) 282 (13%) 270 (14%) 310 (15%) Correlation coefficient 0.900 0.932 0.849 Least-square fit. Slope 0.867 0.889 0.834 Least-square fit. Intercept (J/cm²) 156 112 253
Similarly to Table 2, Table 3 displays the quality parameters for each station but for daily clearness index. Expectedly, the three stations exhibit similar results. The bias is negative: -0.03; the RMSD has a limited range: 0.08 – 0.09, i.e., 13% of the mean value of the daily clearness index. Expectedly, the correlation coefficient is smaller than that for the daily irradiation. However, it is still large and greater than 0.82. The slope of the regression line is fairly close to 1: it ranges between 0.87 and 0.89.
Table 3. Comparison between HC-1 and WRDC for daily clearness index. Percentages are relative to the mean daily clearness index observed in ground-based measurements.
Beira Maputo Tete
Mean value 0.59 0.59 0.60 Number of days 3403 7265 3716 Bias -0.03 (-5%) -0.03 (-4%) -0.02 (-3%) Standard-deviation 0.07 (12%) 0.07 (12%) 0.08 (13%) RMSD 0.08 (13%) 0.08 (13%) 0.09 (14%) Correlation coefficient 0.872 0.904 0.817 Least-square fit. Slope 0.877 0.894 0.870 Least-square fit. Intercept 0.042 0.034 0.054
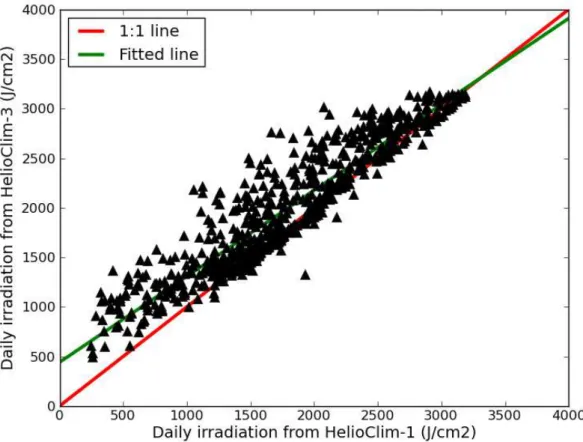
We have further proceeded with the comparison between HC-3 and HC-1 for the overlapping periods: 2004-2005, and the three stations. Figure 2 displays the correlogram for the Maputo site. HC-3 provides larger values than HC-1 as a whole. HC-3 and HC-1 are very close for large values around 3000 J/cm². Similar observations are made for the three stations. The scattering of the points is very limited; the standard-deviation is approximately 250 J/cm². The correlation is large: greater than 0.88 for irradiation, and 0.89 for clearness index.
Figure 2. Correlogram between HC-1 and HC-3 for the Maputo station. Period: 2004-2005.
The points lie quite well along a straight line. Taking the mean value for the three stations of the parameters of the straight line, we can write:
HC3adjusted = 0.977 HC3 -179, in J/cm²
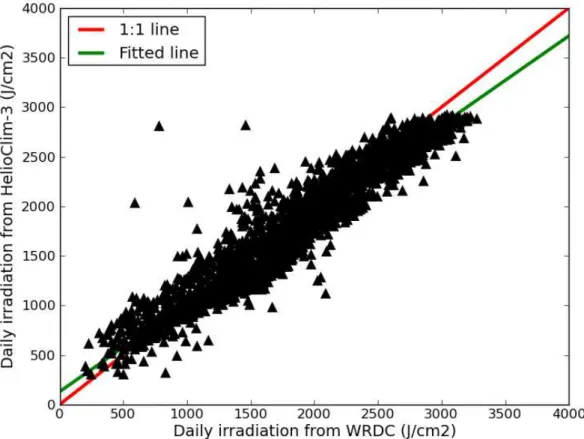
where HC3adjusted is a new version of HC-3 that is fully consistent with HC-1. Figure 3 displays the correlogram between HC-3adjusted and ground-based measurements for all available days in the period
2004-2009. Only Maputo is dealt with as it is the only station having data after 2004. HC-3adjusted underestimates the daily irradiation measured at the Maputo station as a whole. Expectedly, the agreement between ground-based measurements and HC-3adjusted is very good.
Figure 3. Correlogram between ground-based measurements (WRDC) and HC-3adjusted for the Maputo station. Period: 2004-2009.
Table 4 reports figures of merit for HC-3 compared to ground-based measurements (WRDC) in Maputo, as well as for HC-3adjusted. Only days in the period 2004-2005 that are valid for both HC-3 and HC-1 are used, so that a comparison can be made with HC-1. This comparison is reported in Table 4.
Table 4. Maputo. Comparison between HC-3 and WRDC, and between HC-3adjusted and WRDC, for the coincident days in 2004 and 2005. HC-1 HC-3 HC-3adjusted Mean value (J/cm²) 1821 1821 1821 Number of days 683 683 683 Bias (J/cm²) -63 (-3%) 140 (7%) -84 (-4%) Standard-deviation (J/cm²) 235 (12%) 203 (11%) 202 (11%) RMSD (J/cm²) 243 (13%) 247 (13%) 219 (12%) Correlation coefficient 0.936 0.949 0.949 Least-square fit. Slope 0.969 0.926 0.905 Least-square fit. Intercept (J/cm²) -7 275 90
As expected from Figures 1 and 2, HC-3 overestimates (positive bias) the observed irradiation, while HC-1 and therefore HC-3adjusted provide an underestimation. As discussed in section 4, a difference is expected between the various data sets. The differences between figures of merit for HC-3adjusted, HC-3 and HC-1 are very similar, except for the bias, and the intercept of the least-square-fit.
6. Conclusions
Overall, we have found that the HelioClim databases reproduce well the daily solar irradiation at ground level observed in Mozambique as well as its day-to-day variations.
The three studied sites show no difference in performance. These performances are similar to those obtained by Lefèvre et al. (2007) in a similar study but limited to the years 1994 to 1997. This supports our present conclusions.
The RMSD found for European and African stations in Lefèvre et al. (2007) is fairly similar for all stations and is approximately 250 J/cm². This value is very close to the value found here. In Northern Africa, the RMSD is much smaller and is approximately 130 J/cm²; the performances of HC-1 are much better in this region likely because of the very frequent clear sky conditions. The previous studies (Abdel Wahab et al., 2009; Lefèvre et al., 2011) have reported that the quality of HC-1 is comparable to that of similar databases among the best ones.
This study contributes to the great effort made to assess the merits of the HelioClim databases. We found that the HelioClim databases offer similar performances in Mozambique than in the northern hemisphere. This extends the area where the daily irradiation values extracted from the HelioClim databases have a proven quality.
HC-1 contains consistent time-series of daily solar irradiation for a 21-year period. Even if uncertainty is currently too great for accurate analyses of climate change, the availability of these time-series for virtually any location in Mozambique should help any community interested in climate applications to perform steps towards a better knowledge of the daily solar exposure and its variation over recent years. This period is long compared to what is usually available in WRDC for recent decades. HC-1 can be combined with time-series of ground-based measurements available for previous periods, such as made in Egypt to form much longer time-series (Abdel Wahab et al., 2009).
HC-1 is now an element of the precursor radiation service of the GMES atmosphere service. GMES (global monitoring for environment and security) is the European programme for the establishment of a European capacity for Earth observation. It consists in a complex set of systems which collects data from multiple sources, process them and provide users through services in six domains: land, atmosphere, emergency, security and climate change (www.gmes.info). HC-1 is available for free on the SoDa Service (www.soda-is.com). Data can be downloaded easily. This availability aims at facilitating the use of the HC-1 database. The HC-3 database began in 2004 and is updated daily. Eight years are now available. Its performances in Mozambique are similar to those of HC-1 though only one station is available for the comparison. HC-3 is also available in the SoDa Service, though it is for-pay, except the year 2005 which is for-free. HC-3 is also part of the GMES atmospheric service.
We have shown that HC-3 can be adjusted onto HC-1 in order to create a consistent data set spanning from 1985 up to today, thus enabling long-term studies of daily solar irradiation at ground level and its changes in space and time.
7. Acknowledgements
The authors are grateful to Eumetsat and Meteo-France for the provision of Meteosat data, the World Radiation Data Center and National Renewable Energy Laboratory (USA) for supplying irradiation data for ground-based measuring stations. The authors thank the company Transvalor which is taking care of the SoDa Service for the common good, therefore permitting an efficient access to the HelioClim databases. The research leading to these results has partly received funding from the European Union’s Seventh Framework Programme (FP7/2007-2013) under Grant Agreement no. 218793 (MACC project).
8. References
Abdel Wahab, M., El Metwally, M., Hassan, R., Lefèvre, M., Oumbe, A., Wald, L., 2009. Assessing surface solar irradiance in Northern Africa desert climate and its long-term variations from Meteosat images.
International Journal of Remote Sensing, 31(01), 261 – 280. doi: 10.1080/01431160902882645.
Blanc, Ph., Gschwind, B., Lefèvre, M., Wald, L., 2011a. The HelioClim project: Surface solar irradiance data for climate applications. Remote Sensing, 3, 343-361, doi:10.3390/rs3020343.
Blanc, Ph., Gschwind, B., Lefèvre, M., Wald, L., 2011b. Validating Meteosat-derived surface solar irradiance in Mozambique. In Proceedings of the 30th Symposium of the European Association of Remote Sensing Laboratories, Ed. Halounova L., held in Prague, Czech Republic, 30 May – 2 June 2011, A. A. Balkema Publisher.
Cano, D., Monget, J.M., Albuisson, M., Guillard, H., Regas, N., Wald, L., 1986. A method for the determination of the global solar radiation from meteorological satellites data. Solar Energy, 37, 1, 31-39. Diabaté, L., Demarcq, H., Michaud-Regas, N., Wald, L., 1988. Estimating incident solar radiation at the surface from images of the Earth transmitted by geostationary satellites: the Heliosat Project. International Journal of Solar Energy, 5, 261-278.
Espinar, B., Ramírez, L., Polo, J., Zarzalejo, L.F., Wald, L., 2009. Analysis of the influences of uncertainties in input variables on the outcomes of the Heliosat-2 method. Solar Energy, 83, 1731-1741.
Geiger, M., Diabaté, L., Ménard, L., Wald, L., 2002. A web service for controlling the quality of measurements of global solar irradiation. Solar Energy, 73, 475-480.
Gschwind, B., Ménard, L., Albuisson, M., Wald, L., 2006. Converting a successful research project into a sustainable service: the case of the SoDa Web service. Environmental Modelling and Software, 21, 1555-1561, doi:10.1016/j.envsoft.2006.05.002.
ISO, 1995. Guide to the Expression of Uncertainty in Measurement, 1st ed. International Organization for Standardization: Geneva, Switzerland.
Lefèvre M., Diabaté, L., Wald, L., 2007. Using reduced data sets ISCCP-B2 from the Meteosat satellites to assess surface solar irradiance. Solar Energy, 81, 240-253, doi:10.1016/j.solener.2006.03.008.
Rigollier, C., Lefèvre, M., Wald, L., 2004. The method Heliosat-2 for deriving shortwave solar radiation from satellite images. Solar Energy, 77, 159-169.
Rigollier, C., Wald, L., 1999. The HelioClim Project: From satellite images to solar radiation maps. In Proceedings of the ISES Solar World Congress 1999, Jerusalem, Israel, July 4–9, 1999; Volume I, pp. 427-431.
Solar Radiation Atlas of Africa, 1991. Edited by Raschke, E., Stuhlmann, R., Palz, W., Steemers, T. C.. Published for the Commission of the European Communities by A. A. Balkema, Rotterdam, 155 p.
Zelenka, A., Perez, R., Seals, R., Renné, D., 1999. Effective accuracy of satellite-derived hourly irradiances. Theor. Appl. Climatol., 62, 199-207.