Core Design and Reactor Physics of a
Breed and Burn Gas-cooled Fast Reactor
By Peter Yarsky
B.S. Nuclear Engineering and Engineering Physics Rensselaer Polytechnic Institute, 2002
S.M. Nuclear Engineering
Massachusetts Institute of Technology, 2004
I
r_
m
V)I
n Cn0>
mcZ I
° U Qz= _< 3r ra C"hi
c0SUBMITTED TO THE DEPARTMENT OF NUCLEAR ENGINEERING IN PARTIAL FULFILLMENT OF THE REQUIREMENTS FOR A DEGREE OF
DOCTOR OF PHILOSOPHY IN NUCLEAR ENGINEERING AT THE
MASSACHUSETTS INSTITUTE OF TECHNOLOGY
September 2005
© Massachusetts Institute of Technology 2005. All rights reserved.
The author hereby grants to MIT permission to reproduce and to distribute publicly paper and electronic copies of this thesis document in whole or in part.
AR/CHIVE
N-N
Department of Nuclear Engineering(,I
Professor Emeritus Michael J. Driscoll Thesis AdvisorC ertified by . ... ... ... ... Doctor Pavel Hejzlar
~I , t 1 Thesis Reader
Accepted by Author
Certified by
..
... ....
...
...
...
Professor Jeffrey A. CoderreChairman, Department Committee on Graduate Students ... .. 1 ... ... I ---- . ... -.... .. --.-... ---... . -... --.-- . ·.. -.-.. -. -.--.-..-- .- . ... ...- ...I... I Kr . _ Rji
Core Design and Reactor Physics of a
Breed and Burn Gas-cooled Fast Reactor
By Peter Yarsky
SUBMITTED) TO THE DEPARTMENT OF NUCLEAR ENGINEERING IN PARTIAL FULFILLMENT OF THE REQUIREMENTS FOR A DEGREE OF DOCTOR OF PHILOSOPHY IN NUCLEAR ENGINEERING AT THE MASSACHUSETTS INSTITUTE OF
TECHNOLOGY
September 2005
Abstract
In order to fulfill the goals set forth by the Generation IV International Forum, the current NERI funded research has focused on the design of a Gas-cooled Fast Reactor (GFR) operating in a Breed and Burnm (B&B) fuel cycle mode. B&B refers to a once-through fuel cycle where low enriched uranium (less than 5 w/o 235U in U) subcritical assemblies are loaded into the core in equilibrium, yet in-situ plutonium breeding carries the fuel through a discharge burnup on the order of 150 MWD/kgHM. The B&B fuel cycle meets the GenIV goals of sustainability, economics, and proliferation resistance by increasing fuel burnup without the need for spent fuel reprocessing, recycle, or reuse of any kind.
The neutronic requirements for B&B are strict and require an ultra-hard neutron spectrum. Therefore, the GFR is ideally suited for this fuel cycle. In the present work the B&B GFR concept evolved into two practical reactor designs, both of which build on extensive previous gas-cooled reactor design experience.
The first version is the "demonstration" concept using highly neutronically reactive U15N fuel in a hexagonal pin fuel array that is nearly 50 v/o fuel. The core is helium cooled, with an outlet temperature of 570 °C. The helium primary circuit is coupled to a steam Rankine power conversion system essentially identical to that for the British Advanced Gas-cooled Reactors. One advantage of the low coolant temperature compared to other GenIV GFR concepts is that it allows for the use of oxide dispersion strengthened stainless steels (ODS) in core. The fuel is manufactured using advanced vibration compaction techniques, clad in ODS, and vented in order to achieve the high burnup goal.
The second version, the "advanced" concept builds on the experience of the demonstration concept to develop a B&B GFR without the need for expensive U'5N fuel. In order to substitute the nitride fuel with carbide, significantly higher heavy metal loadings are required (60 v/o fuel for UC versus 50 v/o fuel for U'5N) which are not practically achievable with a conventional pin fuel array. Therefore, an innovative tube-in-duct assembly design was proposed to achieve B&B operation with the less neutronically reactive carbide fuel. The advanced core offers significantly reduced natural uranium requirements and lower equilibrium fuel cycle costs (5 mills/kWhre) compared with conventional light water reactors (7 mills/kWhre), as the burnup is tripled for the same reload enrichment.
scenarios, including loss of flow, loss of heat sink, and transient overpower all without scram. Reactor pressure vessel blowdown (LOCA) was investigated and while the B&B GFR has a low positive coolant void reactivity (less than 1$), the added reactivity during blowdown is compensated through other strong negative reactivity feedback mechanisms, thereby allowing for the safe operation of the B&B GFR.
Thesis Advisor: Professor Emeritus Michael J. Driscoll Thesis Reader: Dr. Pavel Hejzlar
Acknowledgements
I would like to thank the Department of Energy of the United States and the Nuclear Energy Research Initiative Program for sponsoring this research (Project Grant Number DE-FG07-02SF22608).
I would like to extend thanks to the following individuals for their various technical contributions to this research: Dr. Mitch Meyer, Dr. Kevan Weaver, Dan Wachs, Dr. Walt Kato, Professor Ron Ballinger, Professor Ken Czerwinski, Dr. Pradip Saha, Professor Mujid Kazimi, Kun Yu, Jonathan Plaue, and Dr. Vaclav Dostal.
Chris Handwerk, Mike Pope, Nate Carstens, and Dr. Zhiwen Xu also deserve my dearest thanks for their generosity, numerous contributions, and assistance for the duration of their project. These incredible individuals have been a joy to work with, and are responsible for the health, functionality, and versatility of the (completely indispensable) MIT Echelon Beowulf Computing Cluster and its codes.
I would like to extend my most grateful acknowledgements to my advisors Professor Emeritus Michael Driscoll and Dr. Pavel Hejzlar. Aside from their incredibly helpful guidance, know-how, feedback, and references; it takes considerable constitution to bear my incessant whining and flamboyant (at times) attitude. Extra thanks go to Professor Michael "Uncle Mike" Driscoll whose tireless efforts to make me the best nuclear engineer I could be have not been completely wasted (though possibly to a significant extent). He has been an excellent mentor, and I would not have been able to survive this project without his witticism and support.
Whitney Raas, Benjamin Parks, and Lisa Mullen are duly thanked for their efforts to keep me from completing my thesis. Without them there is no doubt that I would have suffered a severe nervous breakdown, and they will continue to be my friends forever.
Michael Stawicki, Dan Cavallari, Nathan Palmer, Susan Kane, Craig Gerardi, Matt Reinke, Bobby Middleton, Jane Diecker, and Dave Rigual are also thanked for being there for me through the rough spots, and helping to make my time here the best in my life.
I would also like to thank Tiffany Groode, Lucy Rodd, and Sara Hupp. Their support has been immeasurable and each and every one of them has helped me to change my life for the better. In living with them, I've realized how little I deserve friends as loyal and caring as them. They will continue to be the smart women that inspire me to be a better person. The first three spots in my speed dial are permanently reserved for them.
Lastly, no one deserves more thanks than my family. There have been no other people willing to give as much as they would (and have) for my health, happiness, and success. For them, no words of thanks exist that would be sufficient.
Table of Contents
Abstract ... 3 Acknowledgements ... 5 Table of Contents ... 7 List of Figures ... 11 List of Tables ... 13 List of Tables ... 13 Nomenclature ... 15 Chapter 1. Introduction ... 17 1.1. Background ... 17 1.2. Objectives ... 18 1.3. Theory ... 18 1.4. Organization ... 26 Chapter 2. Methodology ... 27 2.1. Introduction ... 27 2.2. Neutronics ... 27 2.2.1. M C N P ... 27 2.2.2. Cladding Fluence ... 38 2.2.3. O R IG EN ... 39 2.2.4. MCODE... 40 2.2.5. Quasi-Static Method ... 492.2.6. AIROX and CASMO-4 ... 53
2.3. Thermal Hydraulics ... 54
2.3.1. Pin Assemblies ... 55
2.3.2. Tube-in-Duct Assemblies ... 61
2.4. Fuel Cycle Economics ... 64
2.4.1. Once-Through-Then-Out Fuel Cycle Analysis ... ... 64
2.4.2. Alternative Fuel Cycle Analysis ... 68
2.5. Chapter 2 Summary ... 70
Chapter 3. Core Materials Selection ... 71
3.1. Introduction ... .... 71
3.2. Methodology ... 72
3.3. Ceramic Fuels ... 74
3.3.1. Reactivity... 74
3.3.2. Ceramic Fuel Flux Spectra ... 77
3.3.3. Conversion Ratio ... 79 3.3.4. Conclusions ... 81 3.3.5. Chemical Concerns ... 82 3.4. Metallic Fuels ... 83 3.4.1. Flux Spectra ... 84 3.4.2. Conversion Ratio ... 86 3.4.3. C onclusions ... 87 3.4.4. Mechanical Concerns ... 87
3.5. Further Intercomparison of Metallic Alloys and Ceramic Fuels ... 88
3.5.1. Heavy Metal Density Dependence ... 88
3.5.2. Proliferation Resistance ... 91
3.5.3. Void Reactivity Worth ... 94
3.6. Cladding Selection ... 95
3.7.1. Comparison with Liquid Lead Coolant ... 101
3.8. Material Selections ... 102
3.9. Temperature Limits ... . 103
3.10. VIPAC Fuel Conductivity ... 103
3.11. Chapter 3 Summary ... 105
Chapter 4. Demonstration Core Overview ... 107
4.1. Introduction ... 107
4.2. Fuel Assembly Design ... 107
4.3. Balance of Plant ... 108
4.4. Core Design Limitations and Strategies ... 109
4.4.1. Primary Circuit Pressure ... 109
4.4.2. Axial Power Shaping ... 111
4.4.3. Fission Gas Venting ... 114
4.4.4. Spent Fuel Characteristics ... 114
4.5. Chapter 4 Summary ... ... 116
Chapter 5. Demonstration Core Physics ... 117
5.1. Introduction ... 117
5.2. Preliminary Core Design ... ... 117
5.2.1. Fuel Assembly Specifications ... 119
5.2.2. Uncontrolled Reactivity History ... 119
5.2.3. Assembly Power History in Equilibrium... 121
5.2.4. Delayed Neutron Fraction ... 122
5.2.5. C ontrol ... 124
5.3. Final Design ... ... 127
5.3.1. Poison Control and Fuel Assembly Design ... 129
5.3.2. Quasi-Static Analysis ... 135
5.3.3. Core Flooding ... 137
5.3.4. Cladding Irradiation ... 140
5.4. Chapter 5 Summary ... 142
Chapter 6. Demonstration Core Thermal Hydraulics ... 143
6.1. Introduction ... 143
6.2. Steady State Operation ... 143
6.3. Loss of Coolant and Blowdown Time ... 144
6.4. Chapter 6 Summary ... 147
Chapter 7. Demonstration Core Fuel Cycle Economics ... 149
7.1. Introduction ... 149
7.2. Cost of Generation ... . 149
7.3. Chapter 7 Summary ... 151
Chapter 8. Advanced Core Overview ... 153
8.1. Introduction ... 153
8.2. Fuel Volume Fraction ... . 154
8.3. Advanced Core Primary Coolant Pressure ... 155
8.4. Core Design Considerations and Lessons Learned ... 156
8.5. Chapter 8 Summary ... . 157
Chapter 9. Advanced Core Physics ... ... 159
9.1. Introduction ... 159
9.2. Uncontrolled Reactivity History ... 160
9.3. Reactivity Control ... 160
9.4. Quasi-Static Analysis ... 161
9.5. Cladding Irradiation... 164
Chapter 10. Advanced Core Thermal Hydraulics ... 167
10.1. Introduction ... 167
10.2. The 2400 MW Base Case ... 167
10.3. The 3400 MW High Pressure & High Power Case . ... ... 169
10.4. Chapter 10 Summary ... 171
Chapter 11. Advanced Core Fuel Cycle Economics ... 173
11.1. Introduction ... 173
11.2. Cost of Generation ... 173
11.3. Sustainability ... 174
11.4. Chapter 11 Summary ... 175
Chapter 12. Summary and Conclusions ... 177
12.1. Overview ... 177
12.2. Introduction ... 177
12.3. Theory and Methods ... 178
12.4. Demonstration Core: Fuel and Core Design ... 181
12.4.1. Safety ... 185
12.4.2. Econom ics ... 186
12.5. Advanced Core Fuel and Core Design ... 187
12.5.1. Safety ... 190
12.5.2. Economics ... 190
12.6. Conclusions ... 191
Chapter 13. Recommendations for Future Work ... 193
13.1. TID Fuel Assembly Fabrication, Systems, and Associated Costs ... 193
13.2. Verifying Temperature, Irradiation, and Velocity Limits ... 193
13.3. 3400 MW Advanced Core Design... 194
13.4. Advanced Core Interassembly Control and Cooling ... 195
13.5. SiC as a Cladding Material ... 195
13.6. Improved VIPAC Conductivity Models... 198
13.7. Increase Power Density by Power Shaping ... 198
Appendices ... 199
List of Figures
Figure 1.1 The 239Pu Microscopic Fission & Capture Cross Sections [46] ... 19
Figure 1.2 The 235 U & 239Pu Ratio of Fission to Absorption Cross Sections [36] ... 20
Figure 1.3 The 235U & 239u Absorption Yields (rl) [36] ... 20
Figure 1.4 The 238U Microscopic Fission Cross Section [46] ... 21
Figure 1.5 Reactivity Histories for a UC Pin Cell Using Different BOC Enrichments ... 25
Figure 2.1 FCA Homogenous Model Geometry ... 29
Figure 2.2 Neutron Spectra for Fuel Elements ... ... 30
Figure 2.3 Neutron Spectra for the Axial and Radial Blankets ... 31
Figure 2.4 Neutron Spectra for the Axial and Radial Reflectors ... 32
Figure 2.5 Heterogeneous One Quarter Symmetric Model Geometry ... 33
Figure 2.6 Central (first) Zone Matrix/Drawer Diagram ... 34
Figure 2.7 ENDFB6 and JEF2.2 238U Fission Cross Section Comparison ... 35
Figure 2.8 Representative Neutron Flux Spectra for B&B GFR Fuel Batches ... 36
Figure 2.9 MCODEv1 and MCODEv2 calculations for Full Core, Cycle 1 ... 42
Figure 2.10 Total Fluence Calculations for Three Cases (nvt in inverse barns) ... 43
Figure 2.11 Fast (E > 0.1MeV) Fluence Calculations in Three Cases (nvt in inverse barns)... 43
Figure 2.12 Effect of Plutonium Drift on Cell Eigenvalue ... 45
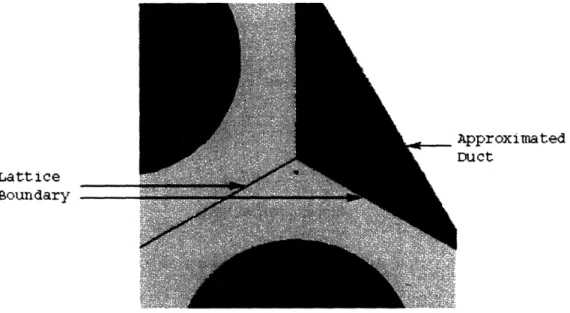
Figure 2.13 Peripheral Triangle Illustrating MCNP Fill Discrepancy (not-to-scale) ... 46
Figure 2.14 Compromise Approximation (not-to-scale) ... 47
Figure 2.15 Fill-Area-Discrepancy Calculation using MCODEv ... 48
Figure 2.16 Equivalent Annulus Diagram ... ... 62
Figure 3.1 Unit Cell Geometry (not to scale)... 73
Figure 3.2 Ceramic Fuel Reactivity Histories ... 75
Figure 3.3 Difference between Peak and Instantaneous Reactivity for Ceramic Fuels ... 76
Figure 3.4 Ceramic Fuel BOL Flux Spectra ... 77
Figure 3.5 Ceramic Fuel Conversion Ratio vs. Burnup ... 80
Figure 3.6 Microscopic 3P Absorption Cross-section [46] ... 82
Figure 3.7 Alloy Fuel Reactivity Histories ... 83
Figure 3.8 Difference between Peak and Instantaneous Reactivity for Metallic Fuels ... 84
Figure 3.9 Metallic Alloy Fuel BOL Flux Spectra ... 85
Figure 3.10 Alloy Fuel Conversion Ratio vs. Burnup ... 86
Figure 3.11 Reactivity Dependence on Heavy Metal Density ... 89
Figure 3.12 Peak vs. BOL Reactivity for Every Fuel Type Considered ... 91
Figure 3.13 Number Density of Fissile Species in UC and U- 10Zr fuel ... 94
Figure 3.14 Cladding Effect on Reactivity ... ... 96
Figure 3.15 Reactivity History Comparison for Different Cladding Materials ... 97
Figure 3.16 Gas Coolant Flux Comparisons ... ... 99
Figure 3.17 Reactivity Histories for Different Coolant Cases ... 100
Figure 3.18 Conversion Ratio History for US fuel with different coolants ... 101
Figure 3.19 Lead vs. Helium Coolant Burnup Comparison ... 102
Figure 4.1 Horizontal Cross-sectional View of a Fuel Assembly ... 108
Figure 4.2 AGR Plant Layout [22] ... 108
Figure 4.3 Axial Power Shape History for Uniform Fuel ... 11
Figure 4.4 Axial Power Shape History for Enrichment-Zoned BOL Fuel ... 112
Figure 4.5 kinf as a Function of Burnup for Different PWR Cases.: ... 115
Figure 5.1 Preliminary Core Design 1/6th Symmetric Model ... 118
Figure 5.2 Preliminary Design Demonstration Core Reactivity History ... 120
Figure 5.5 The Buildup of 149Sm and 'O'Ru During GFR Irradiation ... 125
Figure 5.6 Spectral Shift for Some Control Materials ... 127
Figure 5.7 Demonstration Core Final Design Layout ... 128
Figure 5.8 Final Fuel Assembly Design with a Control Cluster ... 129
Figure 5.9 Final Design Demonstration Core Reactivity History ... 131
Figure 5.10 Power History Comparison ... 133
Figure 5.11 Power History versus Burnup ... 134
Figure 5.12 Effect of Core Flooding on EOEC Core Eigenvalue (Poison Withdrawn) ... 138
Figure 5.13 Effect of Core Flooding on EOEC Core Eigenvalue (Poison Inserted) ... 139
Figure 8.1 TID Conceptual Diagram ... 153
Figure 8.2 BOC Infinite Medium Reactivity Assessment for TID Fuel ... 154
Figure 8.3 Burnup Histories for Various Fuel Volume Fractions ... 155
Figure 9.1 Advanced Core Layout ... ... 159
Figure 9.2 Advanced Core Uncontrolled Reactivity History ... 160
Figure 10.1 Advanced Core Hot Channel Temperature Profile ... 168
Figure 10.2 Advanced Core Average Channel (orificed) Temperature Profile ... 168
Figure 12.1 Comparison of Fuels' Reactivity History ... ... 179
Figure 12.2 Relationship between Reactivity and Heavy Metal Density ... 180
Figure 12.3 Impact of Enrichment on High Bumup Reactivity ... 181
Figure 12.4 Demonstration Core Fuel Assembly ... 182
Figure 12.5 Demonstration Core Layout ... 183
Figure 12.6 Demonstration Core Uncontrolled Reactivity History ... 184
Figure 12.7 Tube-in-Duct Fuel Assembly Schematic ... 188
Figure 12.8 Advanced Core Layout ... ... 189
Figure 12.9 Advanced Core Uncontrolled Reactivity History ... 189
Figure 13.1 ODS and SiC Cladding Comparison ... 196
List of Tables
Table 2-1 Core Eigenvalues using Prebroadened Cross Section Libraries ... 36
Table 2-2 Comparison of Core and Pin Cell Models and Doppler Coefficient ... 37
Table 2-3 Multi-group Displacement Cross Sections ... 39
Table 2-4 Fission Products and Their AIROX Removal Fractions [48,52] ... 54
Table 2-5 Global Parameters for the Pin Assembly Calculations ... 56
Table 2-6 Cell-wise Properties of the Coolant ... 57
Table 2-7 Cell-wise Heat Transfer Parameters ... 58
Table 2-8 Cell-wise Pressure Drop Parameters ... ... 59
Table 2-9 Key GCFR Comparison Model Input Parameters ... 60
Table 2-10 Output Comparison to GCFR ... 6... 61
Table 2-11 Modified Parameters for the TID Finite volume Model ... 62
Table 2-12 Input Parameters to Flow-Split and the FVM for the Comparison Study ... 63
Table 2-13 Comparison Study Results ... ... 64
Table 2-14 Economic Parameters for OTTO Analyses ... 65
Table 2-15 LWR Reference Values for OTTO Analysis ... 68
Table 3-1 Fuel Properties [32,31,68,4] ... ... 72
Table 3-2 Zone Identification ... 73
Table 3-3 Comparison of Lattice Geometry for UC fuel ... 74
Table 3-4 Reactivity Parameters for Fuel Ceramics ... 75
Table 3-5 Average Epithermal Flux Energy for Fuel Ceramics :. ... 79
Table 3-6 Burnup Behavior of 239Pu Cross Sections for UC fuel ... 79
Table 3-7 U'5N peak values vs. UO2 peak values... 81
Table 3-8 Reactivity Parameters for Alloy Fuels ... 83
Table 3-9 Average Epithermal Flux Energy for Fuel Alloys . ... 85
Table 3-10 Burnup Behavior of 239Pu Cross Sections for U-10 OZr fuel ... 86
Table 3-11 Microscopic Absorption Cross Sections from Diluent Study [74] ... 90
Table 3-12 One Group 239Pu Microscopic Cross-sections ... 92
Table 3-13 Plutonium Number Densities at 160 MWD/kgHM ... 92
Table 3-14 Plutonium Discharge Vector at 160 MWD/kgHM ... 93
Table 3-15 Steel Clad Compositions (by weight percentage) ... 97
Table 3-16 Slowing Down Power Comparison [21] ... 99
Table 3-17 Cladding Temperature Limits (Hot Channel) ... 103
Table 4-1 Systematic Comparison for a 2400 MWth B&B GFR Core (pin-type) ... 110
Table 4-2 Power Peaking History for Uniform BOL Enrichment ... 112
Table 4-3 Power Peaking History for Zoned Enrichment ... 113
Table 4-4 Spent Fuel Fissile Content ... ... 114
Table 5-1 Preliminary Design Demonstration Core Geometry ... 119
Table 5-2 Startup and Reload Sequence ... 120
Table 5-3 Delayed Neutron Fraction ... 124
Table 5-4 Core Eigenvalues for Various Control Materials ... 126
Table 5-5 Final Design Demonstration Core Geometry ... 130
Table 5-6 Neutron Economy Performance with Poison Control ... 132
Table 5-7 Impact of Control Clusters on Radial Power Peaking ... 133
Table 5-8 Calculated Reactivity Feedback Parameters and Uncertainty ... 136
Table 5-9 Reactivity Feedback Parameters for Several Fast Reactor Designs ... 137
Table 5-10 Reactivity Consequences of Core Flooding ... 139
Table 5-11 Samarium Diluent and Startup Flooding ... ... 140
Table 6-2 Demonstration Core Hot Channel FVM Output ... 144
Table 6-3 GFR Loss of Coolant Blowdown Times ... ... 147
Table 7-1 Infinite Assembly Reactivity at BOL for Direct Fuel Reuse in the GFR ... 149
Table 7-2 Alternative Fuel Cycle Economic Assessment ... 150
Table 7-3 Breakeven HEN Unit Cost ... 150
Table 8-1 Parametric Comparison for the TID Assembly ... 156
Table 8-2 Advanced Core Geometry ... 157
Table 9-1 Neutron Economy Performance of Advanced B&B Concept ... 161
Table 9-2 Calculated Reactivity Feedback Parameters and Uncertainty ... 162
Table 9-3 Demonstration and Advanced Core Reactivity Feedback ... 163
Table 9-4 UC TID Model Fluence and DPA Calculation ... 164
Table 10-1 Advanced Core FVM Input Parameters ... ... 167
Table 10-2 Advanced Core FVM Output ... 169
Table 10-3 High Pressure & Power Advanced Core FVM Input Parameters ... 170
Table 10-4 High Pressure & Power Advanced Core FVM Output ... 171
Table 11-1 Advanced B&B GFR Fuel Cycle Cost Assessment ... 173
Table 11-2 Startup Fuel Cycle Costs With LWR Reuse ... 174
Table 12-1 Demonstration Core Geometry ... 183
Table 12-2 Startup Core and Fuel Shuffle Sequence ... ... 184
Table 12-3 Quasi-Static Analysis of the Demonstration Core ... 186
Table 12-4 Demonstration Core Cost of Generation and Alternative Fuel Cycles ... 187
Table 12-5 Advanced Core Geometry ... 188
Table 12-6 Quasi-Static Analysis of the Advanced Core ... 190
Table 12-7 Advanced Core Cost of Generation ... 191
Table 12-8 Summary of B&B GFR Core Attributes ... ... 192
Nomenclature
ABR Actinide Burner Reactor
AGR British Advanced Gas-cooled Reactor
AIROX Atomics International Reduction Oxidation Process ANL Argonne National Laboratory
APPF Axial Power Peaking Factor B&B Breed and Burn
BAD Burnup Accrual Discrepancy BOC Beginning of Cycle
BOEC Beginning of Equilibrium Cycle
BOL Beginning of Life
BWR Boiling Water Reactor
CANDU Canada Deuterium Uranium Reactor CARBOX Carbothermic Oxidation Reduction Process CARDIO Carbon Dioxide Oxidation Process
CEA Commissariat a l'Energie Atomique (Atomic Energy Commission of France)
CF Capacity Factor CR Conversion Ratio CRA Control Rod Assembly
DPA Displacements per Atom
DUPIC Direct Use of PWR Spent Fuel in CANDU Reactors ENDF Evaluated Nuclear Data File
EOEC End of Equilibrium Cycle
FAD Fill Area Discrepancy
FCA Fast Critical Assembly
FVM Finite Volume Model
FFF Fertile Fission Fraction
FTF Flat to Flat Distance
GA GCFR General Atomics Gas-Cooled Fast Reactor
GenIV Generation IV
GFR Gas-cooled Fast Reactor
HEN Highly Enriched Nitrogen HM Heavy Metal
HMD Heavy Metal Density
IFR Integral Fast Reactor IHX Intermediate Heat Exchanger
JAERI Japan Atomic Energy Research Institute
JEF Joint Evaluated File
JENDL Japanese Evaluated Nuclear Data Library KAERI Korea Atomic Energy Research Institute
LEU Low Enriched Uranium
LMFBR Liquid Metal Fast Breeder Reactor LWR Light Water Reactor
MCNP Monte Carlo N-Particle Transport Core MCODE MCNP ORIGEN Depletion Program
OREOX Oxidation and Reduction of Oxide Fuel Process ORIGEN Oak Ridge Isotope Generation and Depletion Code OTTO Once-Through-Then-Out Fuel Cycle
PCS Power Conversion System PWR Pressurized Water Reactor
RERTR Reduced Enrichment for Research and Test Reactors RPPF Radial Power Peaking Factor
S-CO2 Supercritical Carbon Dioxide
TID Tube-in-Duct
U'5N Uranium Nitride Fuel, Highly Enriched (>99%) in the isotope '5N USD United States Dollars
VIPAC Vibration Compaction Process
Chapter 1. Introduction
1.1.
Background
The Nuclear Energy Research Initiative funded work described here is focused on a next generation Gas-cooled Fast Reactor (GFR). In particular, the ultra-hard neutron spectrum associated with the GFR enables the design of next generation reactors with advanced fuel cycles, such as the Breed and Burn (B&B) concept of present interest. The GFR was studied extensively between 1960 and 1980 in the US and Europe [20]. The GFR is now receiving renewed attention after being selected as a potential candidate for deployment in the 2025 time frame by the Generation IV International Forum (GIF) [28]. At MIT, several research projects have been completed that examine the neutronic characteristics of different GFR concepts [74], [49] exploring the impact of core diluents, reflectors, and coolants on neutronic parameters of the core. The current work however is more application driven, and strives to develop a working concept that characterizes the benefits of a GFR with a B&B fuel cycle.
The B&B concept refers to a nuclear fuel cycle where the equilibrium reload fuel is low enriched uranium (LEU) (up to 5 w/o 23 5U). Plutonium is aggressively bred in-situ and reactivity sharing among fresh and partially burnt fuel assemblies carries the fuel through discharge burnup on the order of 150 MWD/kgHm. A hard neutron spectrum is conducive to fulfilling the stringent neutronic requirements of a B&B reactor, thus making the GFR an ideal candidate for the B&B fuel cycle.
The B&B fuel cycle dramatically increases the utilization of LEU fuel, even without spent fuel reprocessing and recycle. This would permit early introduction of reactors with breeding capability before the deployment of commercial reprocessing facilities.
B&B is not a new concept. B&B was first mentioned in 1958 by Feinberg [23], studied in 1970 by Fischer, et al. [24] with collaborators at MIT [39], [3], and a lead cooled alloy version has been recently explored by Toshinsky, et al. in the 1990s [64]. Though research has been conducted that indicates that B&B may be possible with natural uranium, such proposed fuel cycles are complicated and require extremely long residency times and complex fuel shuffling sequences. Ryu and Sekimoto have recently described a pebble bed approach with online refueling, yet still requiring extra-long fuel residency times [56].
Several recent developments have motivated examining the GFR for B&B service. While the reactor physics design of the GFR is a major challenge, it cannot be done in the absence of several other concerns. The high burnup of the fuel will require the use of a robust creep and fluence-damage resistant cladding. Additionally, fuel, and especially cladding, temperature limits must not be exceeded, even under accident scenarios, which is a particularly difficult challenge for gas-cooled reactors.
With regards to advances in nuclear fuels, advanced Vibration-Compaction (VIPAC) fuel manufacturing processes developed and tested for U02 in Russia can achieve very high smear density (90-91% of the theoretical density); and post irradiation examination of experimental fuel assemblies tested in Russian fast reactors indicate that concerns over both chemical and thermochemical fuel-cladding interactions are practically eliminated and burnup is effectively limited by the choice of cladding material [8,41]. VIPAC is thus an ideal fuel manufacturing process for meeting strict neutron economy requirements while maintaining acceptable fuel
The higher burnup of the B&B GFR will result in longer cycle lengths and longer fuel residency times than conventional fast reactors; this becomes a factor in the economic viability of the concept. While improved uranium utilization may completely offset the higher carrying costs incurred, the economic value of the spent fuel offers some attractive end-use options. With the advent of simple, proliferation resistant fuel reuse technology such as AIROX [48], the B&B fuel cycle can likely be improved by implementing a similar technique. AIROX refers to a process where repeated oxidation and reduction reactions are used to release the volatile fission products from the fuel without separating any transuranics. The B&B GFR discharge fuel can likely be treated and used in LWRs as U02, or potentially recycled directly into the GFR after reconversion to UC or UN.
1.2.
Objectives
The goal of the current work is to design and evaluate a GFR concept that addresses many of the practical concerns with operating a B&B fuel cycle. Namely concerns regarding material limitations, safety, and economics are addressed in arriving at a final design.
The reactor physics presents the over-arching design challenge. In other words, the goal of the work will be to design a GFR that operates on the B&B fuel cycle in equilibrium without any need for spent fuel reprocessing of any kind. The potential approaches for meeting this fuel cycle
are only acceptable when thermal hydraulic and material limits can be acceptably met.
In addition to the limits imposed by the basic physical phenomena, a realistic and practical B&B GFR design must meet the goals set forth by the GIF. While the fuel cycle itself is instrumental in meeting several GIF objectives, an integral approach is used to accommodate these goals (in addition to physical limitations) to complete the design. Specifically, GenIV reactors are intended to improve: sustainability, economics, safety and reliability, and proliferation resistance.
The B&B GFR implicitly strives to improve economics and sustainability by increasing uranium utilization without spent fuel reprocessing. Additionally, since the reload fuel is LEU and the spent fuel requires no reprocessing treatment, the cycle is considered to be proliferation resistant compared with other fast reactor concepts that require spent fuel reprocessing. Thus, safety and reliability move to the forefront as key design goals in the current work.
Shutdown cooling and transient response are the purview of other investigators involved in the overall B&B program and are not considered in detail in the present work.
1.3.
Theory
The B&B GFR uses LEU fresh assemblies; in a hard spectrum reactor the infinite medium multiplication factor for the fresh assemblies is less than unity. During irradiation, 239Pu is bred in such that the partially burnt assemblies have excess reactivity to share with the fresh assemblies. This is quite different from LWR fuel cycles where fresh assemblies tend to have excess reactivity to share with partially burnt assemblies. The first step in understanding the reactor physics behavior of the B&B GFR is to examine and understand the reactivity history of the fuel.
The fuel neutronic performance cannot be completely evaluated based solely on the beginning of cycle (BOC) characteristics. For a constant enrichment and weakly absorbing fuel constituent (for example carbon in UC), the fissile loading, and therefore the heavy metal density of the fuel, determines the BOC reactivity. However, this is by no means a complete picture of the history of
the fuel during irradiation. Though heavy metal density appears to be the prime determinant of BOC reactivity and a key factor in overall fuel performance, the burnup characteristics depend on more than the BOC reactivity, specifically the hardness of the flux spectrum.
The hardness of the flux spectrum determines the trend in reactivity as a function of burnup via two major components. The first is the worth of the bred Plutonium and the second, the conversion ratio. Figure 1.1 shows the 239Pu microscopic fission and capture cross sections. In the energy range above 10 keV, the capture cross section falls off with energy compared to the fission cross section, which is roughly constant above 1 keV. Therefore, if the flux spectrum is exceptionally hard the fission to absorption ratio for 239Pu will be large.
I I I I I I I 1I fiss ion capture -- . I.. I i i i i I I I _ I I · I I I I I I I · I I I · · · I · 16, I Energy (MeV)
The 239Pu Microscopic Fission & Capture Cross Sections [46].
, , , , , I
For comparison the ratio of fission to absorption is plotted for 235U and 2 3 9pu in Figure 1.2.
Though the 235U ratio is gradually increasing from 0.75 to unity between neutron energies of 1 keV to 1 Me'V, the 239Pu ratio increases dramatically from 0.6 to unity. Figure 1.3 shows a related plot of the ratio of absorption yield for 235U and 2 39Pu; the combination of these figures indicate that the neutron yield from absorption of 239Pu in the core is heavily dependent on the
energy distribution of the neutron flux. It also indicates that each 239Pu nucleus will contribute more to the core reactivity than a single 235U nucleus.
2 ._ le 63 D L U i2 Figure 1.1 I I I I I I I I Il I I I I T 1 I. 12_ I I--14 l
of Of to a (10 keV to 10 MeV)
Pu239
U235
5.4 ItS 5NS 1*6 56 e7i
Figure 1.2 The 235U & 239Pu Ratio of Fission to Absorption Cross Sections [36].
1 L..lJ .J2 -LL 1A. . 7 r, t n V FA 1LU n tVJ 4- 3.5- 3-1.5 I
r sLlsu u VL tVo:x oa U he=V L 1U J re;
..
::%,,, - ' ''' -- ' '"'''
l4F 5e4 le 55 It6 536 le7
Before the 239Pu fissions it is bred into the fuel by neutron capture in 238U. However, the GFR neutron spectrum is exceptionally hard, and thus a significant portion of the flux is above 0.1 MeV. Figure 1.4 shows a plot of the 238U fission cross section between 10 keV and 10 MeV. While threshold fission is of little concern in LWRs it is critically important in the operation of a B&B GFR, especially when one considers metrics used to indicate neutronic performance.
The conversion ratio is basically a measure of the production of 23 9Pu in the fuel during irradiation. The conversion ratio is simply the ratio of the production rate of fissile material divided by the destruction rate of fissile material. An approximate representation for the conversion ratio is expressed symbolically in Equation (1.1). The expression does not consider potential transmutation of the intermediate nuclides during decay from the excited nucleus to the fissile daughter.
Figure 1.4
Energy (MeV)
The 238U Microscopic Fission Cross Section [46].
CR Iea
0z
(1.1)
Where CR is the conversion ratio, E is the macroscopic cross section, e denotes fertile,
i denotes fissile, y denotes capture, and
Here, the cross sections are spectrum averaged. The summation over "e" is over all fertile nuclides. At BOC the only fertile nuclide is 238U, but with burnup 240Pu and other nuclides
become an increasingly important component of the fissile production rate. The summation over "i" is over all fissile nuclides. In the hard GFR spectrum, fertile fission is significant, and can account for as much as 20% of fissions.
However, the conversion ratio for the B&B GFR is an inadequate metric for evaluating the neutron economy. There is a trade off between conversion ratio and the neutron absorption yield in 239u. Let us take an example reactor where all of the neutrons are above 0.1 MeV. To maintain the same reactivity in a very hard neutron spectrum core less 239Pu would be required than 235U because of the higher fission to absorption ratio and prompt yield, therefore with conversion ratios less than unity the reactivity may be constant or even increasing during irradiation as 235U is being burnt and 239Pu bred. Secondly, there will be a substantial component of the fission rate coming from direct 238U fission.
If 239Pu undergoes fission it would, over time, require two neutrons. The first neutron converts the 238U to 239Pu and the second induces fission. Therefore, while the prompt yield from 238U
fission may be somewhat lower than that for 239Pu it is beneficial from a long-term neutron economic standpoint to design a reactor that makes fullest use of 238U direct fission.
In the example reactor discussed above there will be a large contribution to the instantaneous reactivity from direct 238U fission, however, a softer spectrum reactor would have a larger portion of the flux below the 238U fission threshold and thus a higher 238U capture cross section. The larger capture cross section in a softer spectrum would thus yield a higher conversion ratio. However, the reactivity would be lower (because there is a smaller contribution from 238U) and more 239pu would be needed to sustain criticality as the 239pu neutron absorption yield increases with energy. Therefore, the B&B GFR strives for a very hard neutron flux; this is somewhat contrary to earlier approaches that would use limited addition of moderator to improve conversion ratio [3].
In general, as the neutron spectrum becomes harder the neutron economy improves because it will require fewer neutrons to induce eventual fissions and reactivity is supplemented by fertile fission. Therefore a new metric for assessing the neutron economic potential for the reactor must be used. Establishing this metric will prove very useful later when evaluating control schemes for the reactor. Any approach for developing this metric must examine more than the ratio of two instantaneous rates such that the long-term potential of the reactor to sustain criticality, i.e. breed in more reactivity, can be captured in a single quantity.
All fission neutrons are eventually lost, but they are lost in both productive and unproductive mechanisms. The productive mechanisms would lead to either fission (ideally) or fissile production. The unproductive mechanisms would include leakage or absorption in non-fertile species. It costs one neutron to fission 238U directly, and two neutrons to fission 239Pu in the B&B reactor. Here a metric of neutron economy (Y) is derived such that it will give a measure of a reactor's capability to breed reactivity using spectrum averaged quantities.
Imagine that the cost of fission in the current generation is borne entirely by the fission neutrons in the current generation. If that is the case, then the long-term ability of the reactor to breed reactivity will be related to the excess of fission neutrons available for breeding, as well as the worth of the bred material (namely 239pu). The inverse of Y is the fraction of fission neutrons that must be dedicated to inducing fission to produce the next generation. Therefore, Y becomes a
measure of the neutrons that are available for breeding new fissile material, and thus a measure of the potential for the reactor to breed additional reactivity.
The metric of neutron economy (Y) is shown symbolically as follows in Equation (1.2). It is approximated for the current purpose. The major approximations are that the primary species of interest are 238U and 239Pu, the yield from fertile capture to fissile production is unity, and both
238U and 239Pu have approximately the same prompt neutron yield.
~1
( t28
r
a)2
CT
f
002
2
12
a
49
28
2
.
aM
a
28 +.28 o ( r a 9 49 1 k _ _ Y x7r 49 28 (1.2) Where Y is the proposed metric,a is the microscopic cross section, k is the multiplication factor,
v is the average prompt neutron yield,
X is the ratio of the number density of 239Pu to the number density of 238U, 49 denotes 239Pu,
28 denotes 23 8U, 29 denotes 23 9U,
y(29,49) is the probability that 239U will become 239pu, f denotes fission,
L denotes loss.
The total loss rate is characterized above by a neutron loss cross section. It is the same as approximating a leakage cross section using buckling and adding that to the absorption cross section; however, the multiplication factor is the ratio of the production to loss, and the loss rate is represented using these quantities instead.
The inverse of Y is shown in Equation (1.2) to more clearly illustrate the physical meaning. Y takes into account several of the phenomena discussed above, namely that fertile fission must be taken into account, first because it is a significant fraction of the total fission rate, and secondly it takes fewer neutrons to induce direct fission than to breed and then fission 239Pu. While not being fully time-integral, the approach here attempts to take into account the past behavior of the fuel during irradiation by lumping the history of the fuel into an instantaneous rate.
The factor of two on the 239Pu cross section is meant to take this into account, and thus bring to light in some approximate sense the effectiveness of the reactor in utilizing neutrons over time. Additionally, spectral effects are accounted for in the 239Pu as the absorption to fission ratio is present. This factor takes into account that some neutrons absorbed in 239Pu do not induce fission, and as this ratio increases the cost to induce fission in 239pu is higher.
irradiation time as additional 239Pu is bred. It would continue to increase until reaching an asymptotic trend where the conversion ratio becomes unity. Fissile buildup has been studied for blankets in fast reactors and similar trends have been observed for several systems [57]. The maximum fissile inventory achievable, which is directly related to the asymptotic reactivity after long irradiation times, is directly related to the spectrum averaged cross sections, particularly those used in the expression for Y. Equation (1.3) shows that Y can be rewritten in terms of spectral indices as follows. The capture to fission ratio for a very hard spectrum reactor will be somewhat small for 239Pu and is neglected in the denominator in the following approximation.
49 28
+
2 28 CaIf
Y
a49
1 k 0-/Y v
X49 +-28
1 Y (1.3) Where a is the capture to fission ratio,rj is the absorption yield, and
6 is the fertile to fissile fission ratio.
When the conversion ratio is unity, one can write an expression for the peak asymptotic reactivity. If all species besides 238U and 239Pu are neglected and spectrum averaged cross
sections are assumed constant during irradiation, then Equation (1.4) shows that Y is related to the peak asymptotic reactivity, further reinforcing its usefulness as a metric to show the capability of a reactor to breed reactivity. It also illustrates the relationship between these two values: as the achievable reactivity (or peak asymptotic reactivity) increases so does Y. Yet, while Equation (1.4) is simpler than Equation (1.2), one cannot know the peak asymptotic reactivity apriori, and therefore, it is easier to calculate Y based on the instantaneous spectrum averaged cross sections using Equation (1.2).
2+
.
l
49
(1 +3) 1 Yk(l - Pasy)
(1.4)By using Y instead of CR it will be clear why a harder neutron spectrum is preferred during operation of the reactor at all stages of burnup. The 235U is left out of the metric, namely because
it will not dictate the long-term physics behavior of the fuel. Since the enrichment at the BOC is only 5% and the fuel reaches atomic burnup on the order of 15%, the long-term, high burnup trends in reactivity will be dictated purely by the 238U content and the spectrum. Also, while changing the enrichment from 5% to 10% may represent a 100% change in the 2 3 5
U content, it is
only -5% change in the 238U content; in essence, the long-term trend in fuel reactivity will be nearly completely independent of the initial enrichment. Figure 1.5 illustrates the asymptotic behavior using a simple unit cell fuel pin model (which is in agreement with the general trends displayed in reference [57]); thus motivating the investigation of natural uranium fueled B&B concepts. Yet, it is the long-term trends the metric is aimed at assessing, while the integral of the reactivity is what determines the limitations on discharge burnup, and thus fuel residency.
n R U.U a) -. -1.0 5 r 1 -1.5 2.0 --20 0 20 40 60 80 100 120 140 160 180 Burnup (MWD/kgHM)
Figure 1.5 Reactivity Histories for a UC Pin Cell Using Different BOC Enrichments'
The benefit to using LEU for reload fuel is that the reactivity integrated over burnup will be higher and thus the reactivity limited burnup is reduced. Unlike a LWR the reactivity limited burnup for the B&B GFR is a minimum burnup that the fuel must attain in order to sustain criticality through subsequent cycles. This is implicit to the B&B cycle because the partially burnt and discharge assemblies have excess reactivity while the fresh assemblies require reactivity sharing in order to breed sufficient plutonium. Therefore, choosing LEU fuel for reload instead of natural uranium will reduce the reactivity limited burnup and fuel residency time to reasonable levels suitable for a practical reactor design.
On the same note, the nature of the cycle presents a challenge when designing a control scheme. The discharged assemblies during operation have much higher fissile content than fresh
Figure 1.5 only shows results for UC cases, Chapter 3 will describe the impacts of other factors,
particularly fuel density, on the reactivity histories more fully.
U.;j
-11 1
I I . . I I I I I I I
assemblies, and therefore, the partially burnt assemblies must breed in enough plutonium during a given cycle to overcome the difference in reactivity between the discharged (high plutonium content) and fresh assemblies (negative reactivity, LEU). Thus the reactivity swing for a cycle will be necessarily large and positive (the opposite of thermal spectrum converter reactors such as LWRs).
For initial studies comparing core materials, it will be sufficient to use the asymptotic reactivity (which is a direct result of calculations), however, when direct calculations are prohibitive as in the case for critical burnup given limited resources, Y becomes increasingly useful. Schemes that control the buildup of reactivity over the cycle must be sensitive to how the control devices impact the future neutron economy and this is a prime example of a case where Y is a useful metric.
1.4.
Organization
This thesis is organized into three sections, each containing several chapters. The first section covers the methodology and the simple models used to make initial design decisions regarding core materials. Chapter 2 covers the codes and methods used to calculate neutronic and thermal hydraulic characteristics. Chapter 3 shows how the methods, once applied to simplified models allow for the selection of candidates for core materials. The second section begins with a brief overview of a demonstration B&B GFR core concept in Chapter 4. The demonstration core is in many ways easier to design and construct, however, at a penalty to the fuel cycle economics. Chapter 5 covers the neutronics of the demonstration core, Chapter 6 the thermal hydraulic analysis, and finally Chapter 7 describes the fuel cycle economics. Chapter 8 begins the third section of the thesis by describing the advanced core. The advanced core, while requiring an additional stretch from current design practices will improve the economics of the fuel cycle given some technology development. Chapter 9 deals with the neutronics of the advanced core, Chapter 10 the thermal hydraulics, and lastly Chapter 11 covers the economics. Final conclusions about the B&B GFR are made in Chapter 12 and recommendations for further investigation are made in Chapter 13.
Chapter 2. Methodology
2.1.
Introduction
This chapter describes the methods used during the course of this project to evaluate the performance of various core concepts. The nature of the calculations can be broken into three categories, the first of which is neutronics. The second category is the assessment of the thermal hydraulic performance of the core, and the last category deals with the fuel cycle economics. In many cases the methodologies, when applicable, were compared with other calculations or experiments to lend credence to the results.
2.2.
Neutronics
2.2.1. MCNP
MCNP stands for Monte Carlo N-Particle Code. The code is a general purpose transport code developed at Los Alamos National Laboratory and is useful in calculating not only neutron transport problems, but is capable of coupled neutron, photon, and electron problems. The code uses interaction data, such as neutron cross sections from ENDF. The code simulates particle trajectories through a model geometry and is capable of predicting eigenvalues for reactor systems and performing "tallies" in order to perform spectrum averaging of cross sections, calculate power shapes, and calculate neutron spectra [40].
MCNP is a Monte Carlo type code, which means that random numbers are used to simulate the trajectory, or history, of many individual particles. Therefore, while the results are subject to errors introduced by the cross section evaluations themselves, there is additional statistical uncertainty arising from the method itself. However, with the MIT Echelon Beowulf computing cluster, several computers are run in parallel to complete MCNP calculations, thus reducing the real-time necessary to perform sufficient trajectory calculations for a given error tolerance.
Several types of MCNP models are used to conduct analyses in the current project. Simplified studies are done using unit cell (or pin cell) models. These types of models reflect single fuel pins with radially reflective boundary conditions, hence effectively modeling an infinite array of fuel pins of one type. These types of models are excellent for predicting some neutronic parameters as well as for comparison studies when general trends are of particular interest. Pin cell models are sometimes modeled with both radially and axially reflective boundary conditions; this would in effect, model an infinite array of infinitely long, identical fuel elements. These types of models are particularly useful for calculating cladding fluence, or comparing calculations that require many neutron histories, such as calculations of the Doppler coefficient. Another set of pin cell models were used; these models retained the radially reflective boundary conditions, but allowed neutron leakage axially; these models are particularly useful for investigating axial power shapes and axial reflector comparisons.
Aside from pin cell models, infinite assembly calculations were also done. An infinite assembly is much like a pin cell model in that the radial, and perhaps axial, boundary conditions are reflective, except that instead of representing an infinite array of fuel pins, the model represents an infinite array of fuel assemblies.
Lastly, full core models were created. These are the most complex and truest to life models. They represent, as fully as possible, the heterogeneity of a reactor core with axial and radial
leakage. While called a full core model, several do contain reflecting boundary conditions where symmetry is present. Since the statistical uncertainty associated with an MCNP model is related to the number of histories traveling through the model geometry, it is advantageous to model as little volume as possible and make the fullest use of symmetry in the modeling.
Our MCNP modeling approach was tested using information published on a fast critical assembly experiment to validate the code as well as the cross sections used for physics calculations, as discussed in greater detail in section 2.2.1 .1.
In the full core models, aside from limitations imposed by the computer runtime necessary to run enough neutron histories for acceptable statistical error, there are limitations imposed by the available computer memory. The full core models used in the current work are approximate in several senses because there is insufficient memory on the current computers to carry out very high fidelity calculations. The fuel assemblies in the models are created using a repeating lattice method, as are the fuel batches comprised of these assemblies. Thus, the fuel in any batch is represented by a single materials card. It would be impossible to define in the model each and every fuel pin distinctly. Yet, while for a startup core there is high confidence in the MCNP results using the repeating lattice approach; during depletion analyses, the composition of the fuel is smeared throughout the entire batch.
Aside from employing a repeating lattice approach in the core geometry, there is not enough memory on the Echelon Beowulf computing cluster nodes to store enough geometry specification for full core models to allow for separate axial nodes in the fuel, and the radial reflector is modeled without heterogeneous coolant channels. Where possible simpler models, such as pin cell or infinite assembly models are used to quantify inaccuracies that arise from these methods. As these approximations are most relevant for burnup calculations, the assessment of the errors introduced as a result of these limitations are discussed at further length in sections 2.2.4.3 and 2.2.4.4.
2.2.1.1. ZPR-9 Benchmark
MCNP4c along with Evaluated Nuclear Data Files (ENDF) versions B5, B6, and B6vII cross sections were used for the neutronic calculations of the B&B GFR.2 The code and data were evaluated by performing a benchmark calculation against one of the ZPR-9 Gas-cooled Fast Reactor critical assemblies. The 2 8th, 29th, and 3 0th assemblies of ZPR-9 were built to support the
evaluation and design of Gas-cooled Fast Reactors [37]. The critical assembly modeled was constructed between June 1975 and September of 1976. To perform the benchmark, a series of MCNP calculations were performed using a model constructed of the phase III critical assembly (the 30th ZPR-9 assembly). Both homogenous and heterogeneous reactor models were developed using specifications in Argonne National Laboratory reports on the ZPR-9 experiment [44].
2.2.1.1.1. Homogenous Model
A homogenous approximation to the ZPR 9 GCFR Phase III experiment was created for MCNP4c2. The assembly is modeled with quarter-assembly symmetry, that is, only one fourth of the assembly was input in the model and reflecting boundary conditions were specified for the x-z and y-z planes. The cell-averaged homogenous number densities were calculated by ANL and used directly in the model [44]. Appendix A contains the MCNP deck used for the homogenous
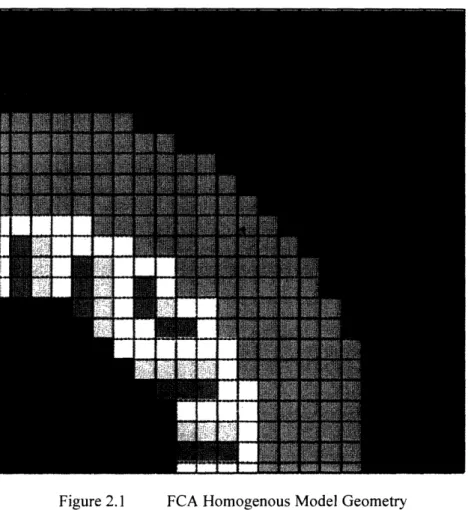
assembly calculations. The fast critical assembly (FCA) geometry is depicted in Figure 2.1.
2 ENDFB6vII cross sections were used when available, and in cases where not available were replaced with
ENDFB6; if those were not available then ENDF5 was used. All nuclides of interest were available among these sets with ENDFB6 representing most of the nuclides.
Figure 2.1 FCA Homogenous Model Geometry
The assembly is divided into three zones. The amount of plutonium in each zone is adjusted such that the equivalent enrichment of the fuel in zones 1, 2, and 3 is 13.1%, 17.3%, and 25.5% respectively. The equivalent enrichment is merely the ratio of fissile plutonium to total heavy metal in each zone. Each zone has a separate axial blanket, and the assembly is reflected by stainless steel blocks. Each zone is comprised of stacks of plates in drawers. Each drawer is approximately 5 cm x 5 cm and the total assembly height, including axial reflectors is approximately 214 cm.
While the homogenous model does not include reactivity effects from neutron streaming or heterogeneous self shielding, it is used to roughly determine the ability of MCNP4c to predict the multiplication factor as well as plot a flux spectrum to determine if the FCA results are applicable to a B&B GFR flux spectrum. The neutron streaming in the radial direction is purposefully "interrupted." In the FCA; samples are arranged in the various regions to avert "line of sight" streaming paths between the zones, thus reducing radial neutron streaming. Axial neutron streaming is still present, but the upper and lower axial reflectors are solid, thus improving the axial neutron reflection relative to power producing cores where coolant channels would most
likely be present.
For the purposes of the benchmark, the model was run on both the Echelon Beowulf computing cluster as well as the MightyAlpha computer at MIT. MCNP4c2 was used on both computers. Only one computer (node 13) of the 30 parallel computers of the Echelon cluster was used. The
result for the MightyAlpha calculation was 0.9698 with a standard deviation of 0.0003. For node 13, the eigenvalue was calculated to be 0.9694 with a standard deviation of 0.0004.
While these quantities are lower than unity, it is expected that the underestimated self-shielding of the fuel would contribute to an under-predicted reactivity value. While the homogenization eliminates direct streaming paths (and would increase reactivity), the FCA was designed to reduce radial streaming, and therefore it is likely that the reduction in reactivity arising from loss of self-shielding due to homogenization would be greater than the increase in reactivity arising from the reduction in axial neutron streaming.
Figure 2.2 shows the neutron flux spectra for the fuel elements. The flux spectrum is of interest in establishing if MCNP4c results are applicable for fast spectrum reactors. There are five types of fuel elements in the FCA; the first (inner) and third (outer) radial assembly regions are each comprised of one distinct type of fuel cell for that region. The second (middle) radial region, however, is comprised of three distinct types of fuel cells.3 While there are subtle differences, each of the regions experiences essentially the same neutron spectrum as predicted by the hoimogenous MCNP model. 1 a) k,..
-J
._ X a) clJ L -0 a) N-i
EZ
0.1 0.01 1E-3 1E-4 1E-5 1 E-61E-6 1E-5 1E-4 1E-3 0.01 0.1 1 10
Energy (MeV)
Figure 2.2 Neutron Spectra for Fuel Elements
3 Tally F101 refers to the flux spectrum in the first zone of the first fuel type. F201 refers to the flux
spectrum in the second zone of the first fuel type, and F202 to the second zone of the second fuel type, and
1 >,)
-x
a) N . oZ
0. 1 0.01 1E-3 1E-4 1E-5 1E.-6 1E-6 Figure 2.31E-5 1E-4 1E-3 0.01 0.1 1 10
Energy (MeV)
Neutron Spectra for the Axial and Radial Blankets
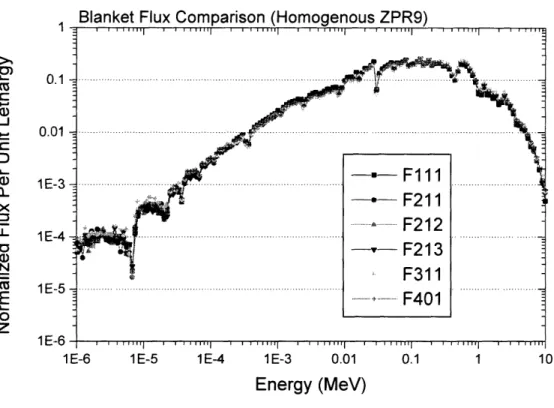
Figure 2.3 shows the neutron spectra in the axial and radial blankets. Again, there are only subtle differences in the spectra among the different radial zones. There are six tallies here because there are distinctive blanket cells for each of the fuel assemblies to preserve axial streaming channels. There is a sixth tally to represent the radial blanket.
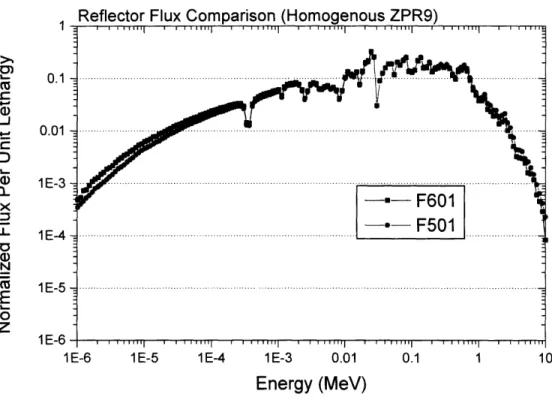
Figure 2.4 is a plot of the neutron flux spectra in the radial and axial reflectors.4 The results are fairly consistent and agree with the neutron spectra in the blanket and fuel cells of the FCA. The purpose of calculating the flux is to show that in hard neutron spectra that MCNP4c is adequate for calculating assembly eigenvalues. As shown in these plots significant portions of the flux resides above 10 keV and the flux peaks near 0.1 MeV, much like the B&B GFR neutron spectrum.5
1 >, L. 0.1
-J
0.01r
() 1E-3x
L 1E-4 a) N -i 1E-5 EZ
1E-61E-6 1E-5 1E-4 1E-3 0.01 0.1 1 10
Energy (MeV)
Figure 2.4 Neutron Spectra for the Axial and Radial Reflectors
2.2.1.1.2. Heterogeneous Model
A heterogeneous reactor MCNP model, still one quarter symmetric, was built. The material compositions for the samples were taken from the table of hot constants included in [44]. There are several assumptions made to enable the development of this model. The mass of the samples was used to generate the mass densities, and the isotopic compositions were developed based on the relative masses of the isotopes in the sample.
The plutonium was modeled throughout the assembly with a single composition. For each plutonium sample, the plutonium core (meat of the sample) and can (clad of the sample) were smeared together. While this introduces some error because the plutonium isotopics in different zones are slightly different, the divergence from the average composition is very small in all cases. Additionally, the hot constants table was somewhat inaccurate in that significant quantities of 241Pu had decayed to 241Am between when the material compositions were measured and the time of the actual experiment. The 24 1Pu and 24 1Am content of the plutonium elements was adjusted to reflect an equivalent enrichment of 25.5% in the third zone.
An intermediate model was created that took into account the heterogeneity of the small sample plates in the drawers without including the stainless steel in the matrix and drawers. The results showed that the model predicted a slightly higher than unity assembly eigenvalue. Based on the results of the preliminary analysis, additional model complexity was required to include the significant neutronic impact of the matrix and drawers.
Figure 2.5 shows the heterogeneous, one-quarter symmetric model geometry, which clearly illustrates the high degree of heterogeneity of the samples in the drawers. The matrix tubes and
drawers are also explicitly included, however, these are modeled with a single stainless steel region surrounding every 5 cm x 5 cm drawer location in the model. While the actual matrix and drawers include some void, the size of the matrix/drawer region in the current model is adjusted so that the mass of stainless steel in each cell is the same as the experiment, while the dimensions are reduced for the given density of the uniform stainless steel material. This approximation slightly increases the size of the small sample plates in the drawers; however, the density is reduced such that the mass is also consistent.
Figure 2.5 Heterogeneous One Quarter Symmetric Model Geometry
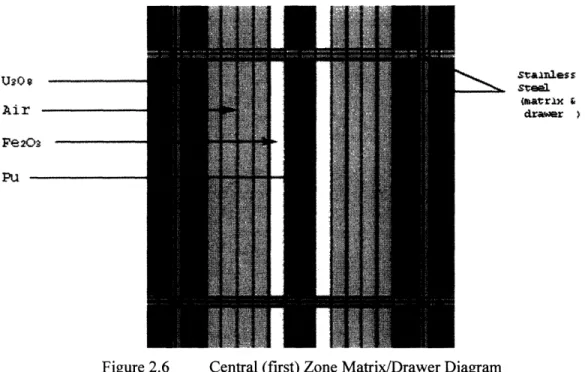
Figure 2.6 is a picture of a horizontal cross section of a matrix/drawer cell in the first (inner) zone of the FCA. The MCNP4c input (used in both MCNP4c2 and MCNP4c3) is shown in Appendix B.
stainless steel waitrix draysr
Air
Fe2OaFigure 2.6 Central (first) Zone Matrix/Drawer Diagram
Calculation of the assembly effective eigenvalue clearly indicates that the errors associated with these approximations are very small. The model was run using MCNP4c3 on node 13 of the Echelon Beowulf cluster and MCNP4c2 on the MightyAlpha computer. The Beowulf result for assembly eigenvalue was 1.0003 with a standard deviation of 0.001 and the MightyAlpha result for assembly eigenvalue was 0.99993 with a standard deviation of 0.001. The results not only indicate that MCNP can accurately model fast spectrum systems using ENDFB6 cross section libraries, but that MCNP4c2 and MCNP4c3 yield consistent results across different computing platforms.
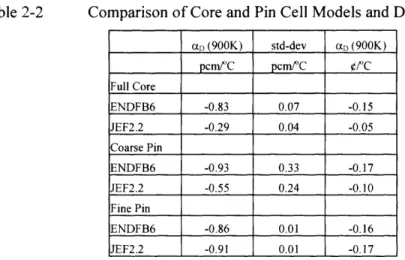
2.2.1.2. Cross Section Comparison and Doppler Coefficient
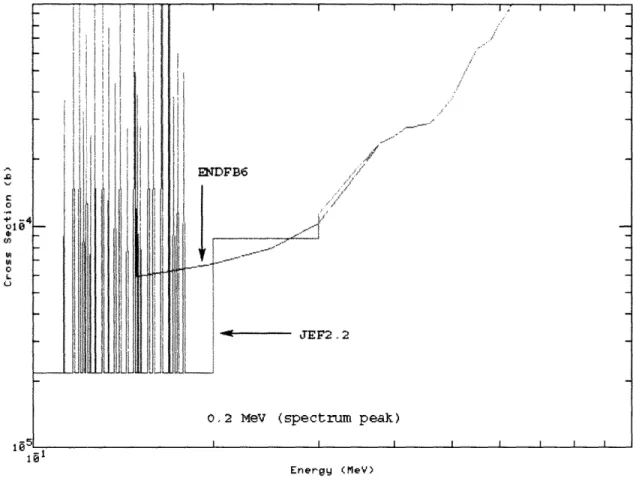
As a basis for comparison between different cross section libraries, the Doppler reactivity coefficient was evaluated for a representative full core MCNP model of the end of cycle GFR equilibrium configuration without control devices (described in Chapter 5 and Appendix E). The calculation was carried out using pre-broadened libraries for the actinides. A complete set of ENDFB6 libraries for the actinides at temperatures of 900 K and 300 K were used to evaluate the reactivity difference. A second analysis was carried out with JEF2.2 pre-broadened libraries at temperatures of 1000 K and 300 K to verify the result. A major difference between the two sets is shown in Figure 2.7 for the 238U fission cross section at 300 K.
1
-Energy (MeV)
Figure 2.7 ENDFB6 and JEF2.2 238U Fission Cross Section Comparison
It was found that subtle differences in the 238U sub-threshold fission cross section led to notable differences in the reactivity at any temperature. The JEF2.2 238U microscopic fission cross
section in the energy range between 150 keV and 200 keV at 300 K is approximately one order of magnitude lower than in the ENDFB6 library. While this may not initially seem like a large discrepancy, the GFR neutron flux spectrum peaks in this energy range. Figure 2.8 is a plot of representative B&B GFR neutron spectra. The plot illustrates that the peak in the neutron flux spectrum is essentially at the transition energy between the resolved resonance regime and the continuum for 238U, thereby making subtle differences in the cross section representation at these energies important.
![Figure 1.2 The 235U & 239Pu Ratio of Fission to Absorption Cross Sections [36].](https://thumb-eu.123doks.com/thumbv2/123doknet/14494874.526643/20.918.171.713.104.586/figure-amp-pu-ratio-fission-absorption-cross-sections.webp)