Understanding negative biodiversity–ecosystem functioning
relationship in semi-natural wildflower strips
Nadine Sandau1,2 · Russell E. Naisbit1,3 · Yvonne Fabian1 · Odile T. Bruggisser1 · Patrik Kehrli4 · Alexandre Aebi5 · Rudolf P. Rohr1 · Louis-Félix Bersier1
Abstract
Studies on biodiversity–ecosystem functioning (BEF) in highly controlled experiments often yield results incompatible with observations from natural systems: experimental results often reveal positive relationships between diversity and productiv-ity, while for natural systems, zero or even negative relationships have been reported. The discrepancy may arise due to a limited or closed local species pool in experiments, while natural systems in meta-community contexts experience dynamic processes, i.e., colonization and extinctions. In our study, we analysed plant community properties and above-ground bio-mass within a semi-natural (i.e., not weeded) experiment in an agricultural landscape. Eleven replicates with four different diversity levels were created from a species pool of 20 wildflower species. We found an overall significant negative relation-ship between total diversity and productivity. This relationrelation-ship likely resulted from invasion resistance: in plots sown with low species numbers, we observed colonization by low-performing species; colonization increased species richness but did not contribute substantially to productivity. Interestingly, when analysing the biomass of the sown and the colonizer species separately, we observed in both cases positive BEF relationships, while this relationship was negative for the whole system. A structural equation modelling approach revealed that higher biomass of the sown species was linked to higher species rich-ness, while the positive BEF relationship of the colonizers was indirect and constrained by the sown species biomass. Our results suggest that, in semi-natural conditions common in extensive agroecosystems, the negative BEF relationship results from the interplay between local dominant species and colonization from the regional species pool by subordinate species. Keywords BEF · Colonization · Invasibility · Phylogenetic diversity · Species richness
* Nadine Sandau [email protected] Russell E. Naisbit [email protected] Yvonne Fabian [email protected] Odile T. Bruggisser [email protected] Patrik Kehrli [email protected] Alexandre Aebi [email protected] Rudolf P. Rohr [email protected] Louis-Félix Bersier [email protected] 1
Department of Biology, Ecology and Evolution, University of Fribourg, Chemin du Musée 10, 1700 Fribourg, Switzerland
2 Agroscope, Reckenholzstrasse 191, 8046 Zurich, Switzerland 3
Department of Civil, Environmental and Geomatic Engineering, Groundwater and Hydromechanics, ETH Zurich, Stefano-Franscini-Platz 5, 8093 Zurich, Switzerland 4 Station de recherche Agroscope Changins-Wädenswil ACW ,
1260 Nyon, Switzerland 5
Laboratory of Soil Biology, University of Neuchâtel, Emile-Argand 11, 2000 Neuchâtel, Switzerland
http://doc.rero.ch
Published in "Oecologia 189(1): 185–197, 2019"
which should be cited to refer to this work.
Introduction
The observation that species extinction is accelerating worldwide is leading to increasing concern over how system functioning, and ultimately the provision of eco-system services to human societies, will be affected. As a result, several controlled biodiversity experiments [e.g., Cedar Creek (Tilman et al. 1996), BIODEPTH (Hector et al. 1999) and the Jena Experiment (Roscher et al. 2004), among many others] have been established during the last 20 years to evaluate so-called ‘biodiversity effects’. Spe-cies richness (and composition) were manipulated, with the aim of exploring the relationship between biodiversity and ecosystem functioning (BEF) (Hooper et al. 2012). Community productivity is regularly used as a surrogate for ecosystem functioning, as it represents an important characteristic of agricultural systems and a functional component of crucial interest for humanity. However, the transferability of these results remains controversial, as the direction of the relationship contrasts substantially between experimentally assembled simplified plant com-munities and naturally complex ecosystems (Chapin et al. 1997; Grace et al. 2007; Assaf et al. 2011). Highly con-trolled studies where species richness was maintained by weeding frequently reported that, irrespective of plant identity, an increase in species richness resulted in an increase in biomass (Hector et al. 1999; Van Ruijven and Berendse 2003; Roscher et al. 2005). The results often contrast with those from natural systems, where a vari-ety of relationships have been observed, from positive, to null, or negative (Thompson et al. 2005; Grace et al. 2007; Rose and Leuschner 2012). Several theories have been proposed to explain the discrepancy between experi-mental and semi-natural or natural systems (Lepš 2004). In contrast with the control exercised in BEF studies, natural plant communities experience a variety of small-scale environmental gradients, e.g., soil acidity, fertility, or microclimate. Environmental filtering and variable lev-els of competition along these environmental gradients may modulate the species richness in a way that does not necessarily translate into a linear shift in productivity (Rychtecká et al. 2014). Another rarely investigated aspect of the BEF relationship is the effect of colonization from the surrounding species pool into the studied communities (Roscher et al. 2009, 2013).
Theoretical models that take into account the size of the species pool and recruitment limitation predict variable outcomes for the link between diversity and productivity, depending on the level of immigration (Loreau and Mou-quet 1999; Cardinale et al. 2000; MouMou-quet et al. 2002). Colonizer species modify species richness and compo-sition in such a way that the positive BEF relationship
disappears quickly once cessation of weeding allows exter-nal species to establish within the plots (Pfisterer et al. 2004). In semi-natural and natural systems, local plant communities are part of a larger network of meta-commu-nities and so are subject to processes such as colonization and local extinction (Rösch et al. 2015). Colonizer species contribute to the diversity of the community but, depend-ing on their functional traits, may not necessarily add to the overall productivity (Jain et al. 2014). Regional species diversity could thus influence the diversity–productivity relationship equally or even more strongly than local spe-cies richness and has been suggested to control ecosystem level processes (Tscharntke et al. 2012).
Phylogenetic diversity has been argued to represent a bet-ter correlate of productivity than simple species richness in BEF experiments, based on the expectation that functional traits are phylogenetically conserved (Cavender-Bares et al. 2009). Phylogenetic distance between species is assumed to influence functional trait variation, which determines ecological and functional (niche) differences and is thus thought to improve ecosystem functioning (Narwani et al. 2015). Cadotte et al. (2008) presented a meta-analysis of 27 diversity experiments, finding that phylogenetic diversity was a far better predictor of variation in productivity than species richness or functional group diversity. This result supports the hypothesis that phylogenetically distinct com-munities can augment resource partitioning and thus opti-mize resource exploitation (Cavender-Bares et al. 2009; but see Venail et al. 2015).
Here, we analyse the BEF relationship in experimental wildflower strips distributed as a meta-community within an extensive agricultural landscape (Fabian et al. 2012, 2013, 2014; Bruggisser et al. 2012). Immigration of internal and external colonizers was allowed, which created an inter-mediate setting between experimental and observational studies. We show that this experimental approach is useful for disentangling the relationships between diversity and productivity of the resident and the colonizer species, and that it provides insights into the discrepancy between results obtained in experimental and unmanipulated systems. Our study is partially comparable to studies analysing the con-sequences of discontinuing experimental manipulations in highly controlled BEF experiments, which were necessary for maintaining the different experimental diversity levels (Pfisterer et al. 2004; Petermann et al. 2010). We examine the changes in species richness and composition and their impact on productivity in order to elucidate the mechanisms behind the observed relationship between diversity and bio-mass. To achieve this goal, it is first necessary to consider separately the biomass of the sown species and of the colo-nizer species, as in Roscher et al. (2009). Second, we use structural equation modelling to study how the biomasses of both groups of species are interrelated between themselves
and to the experimental treatments and community descrip-tors. Specifically, we ask the following questions:
(1) Does sown species richness result in a positive rela-tionship between diversity and total biomass, as often observed for highly controlled and manipulated BEF experiments? Performing the classical BEF analysis with sown species richness levels as the explanatory variable, we expect a positive relationship. However, we predict the positive slope to be low as colonizer species may blur the effect of the underlying degree of richness (e.g., Pfisterer et al. 2004).
(2) How does immigration of colonizer species and associ-ated change in species richness influence the positive relationship between total biomass and sown species richness as expected above? We predict either no or a negative relationship between biomass and total num-ber of species, as often found in observational stud-ies (e.g., Kahmen et al. 2005). In this respect, we also examine the invasion resistance (Hector et al. 2001) of sown communities to colonizers.
(3) How are sown species and colonizer species contribut-ing to the observed relationship? To explore this ques-tion in more detail, we separate the productivity meas-ure into the contribution of sown species biomass and of colonizer species biomass. Since these two groups are dependent, as together they yield the total biomass, we use structural equation modelling to explore several “causal” scenarios for the effects of factors known to influence productivity: species richness, phylogenetic diversity, and composition.
Finally, we frame our results within the context of a new theory for the BEF relationship, derived from a dynamical competition model. We believe that the outcomes of our study contribute to the reconciliation between the opposing results from experimental and observational studies.
Materials and methods
Experimental wildflower strip manipulations
The data were derived from the Grandcour Experiment, which was conducted in 12 wildflower strips situated in agri-cultural fields and meadows, and was originally designed to analyse multitrophic interactions in meta-communities. In Switzerland, wildflower strips are an agri-environmental scheme in which 24 plant species are sown in otherwise homogenous agricultural landscapes in order to provide shelter and food resources for threatened and beneficial spe-cies (Nentwig 2000; Haaland et al. 2011). The study region surrounding the village of Grandcour, 10 km south of Lake
Neuchâtel (479 m altitude; coordinates: 46°52ƍN, 06°56ƍE), represents a typical Swiss lowland agricultural landscape with a mosaic of arable fields interspersed with small fruit orchards, gardens, forest patches, permanent and temporary grasslands and farm buildings. Annual average air temper-ature is 10.1 °C and annual precipitation 941 mm (http:// www.agrom eteo.ch/fr/meteo rolog y/datas ).
The experiment followed a semi-manipulative/semi-mensurative approach (Fabian et al. 2012; Bruggisser et al. 2012; Sandau et al. 2014). Experimental plant communi-ties were established in spring 2007 by sowing different diversity levels (2, 6, 12 and 20 sown plant species, all from the tall herb functional group). Each field was treated with two successive stale seed beds before sowing. Sown mix-tures were generated by constrained random draw from a 20 species pool based on the conventional wildflower seed mixture (Günter 2000). Each of the four plant mixtures was then randomly sown in a 9 m × 6 m plot within a block of 216 m2. Within fields, the sown species richness mixtures were nested replicates, while between fields the species com-position of plant mixtures varied. The 20 species mixture was the sole reproduced in all fields. Species composition of each diversity plot was chosen by constrained random draw from the 20 plant species pool: (1) plants were chosen so that they appeared in the 2, 6 and 12 species levels the same number of times across all 12 wildflower strips; and (2) within a wildflower strip, there was no overlap in the species chosen in the 2, 6 and 12 species levels. Seed den-sity was kept constant between the diverden-sity levels, which resulted in a decreasing population size with increasing spe-cies richness. Thus, the experiment can be described as an incomplete (not all combinations of plants are considered) split-plot design, with wildflower strips as random factors, and with the diversity factor nested within an exclosure treat-ment (split-plot). This treattreat-ment used fences and mollusci-cide to control the main herbivores and their predators, and was composed of three levels: control = no fence, predator and herbivore exclusion = 8 mm fence (PHE) and predator exclusion = 25 mm fence (PE) (see Electronic Supplemen-tary Materials, Fig. S1, and Fabian et al. 2012). One of the fields was flooded shortly after sowing in July 2007 and was replaced by another field sown in September 2007. This later established field is not considered in the present study due to the different development time of the vegetation, which resulted in reduced establishment of the sown species. Ulti-mately, this experimental setup resulted in a split-plot design with 11 fields × 3 exclosure levels × 4 diversity levels, for a total of 132 plots. Note that the LAI measurements (see below) yielded aberrant results in six plots, which were excluded from the analyses. Additional information on the experimental setup can be found in the Electronic Supple-mentary Materials, Appendix S1. In our statistical models, we included sown species richness (SownS) and exclosure
treatment as fixed factors, and Field identity and split-plot structure as random factors.
Vegetation
Apart from the removal of agriculturally harmful weeds (i.e.,
Cirsium arvense, Rumex obtusifolius), weeding was kept to
a minimum and the establishment of external and internal colonizers was accepted. The experimental plots were not mown. This is contrary to most classical BEF experiments [e.g., Cedar Creek; Tilman (2001) and Jena Experiment; Roscher et al. (2004)], where sown communities are gener-ally maintained by eliminating species that were not part of the originally sown community. In addition, several annual species from the originally sown assemblage had already vanished after the first year. Consequently, in our case, the total number of species (S) represents realized species rich-ness, which can be decomposed into the remaining species (RemS) of the sown species assemblage, and the species emerging from the seed bank and/or colonizing from the surrounding landscape matrix, as well as from the sown mixtures of neighbouring plots (“external” and “internal” colonizers, ColS).
In early autumn 2008, we recorded species richness, iden-tity and abundance by identifying each plant species and visually estimating their cover using the standard Braun-Blanquet scale within each plot. The list of species is given in Electronic Supplementary Materials, Appendix S2. As a surrogate for productivity, the response variable was total above-ground biomass assessed from leaf area index (LAI) measurements to minimize disturbance. We calibrated the LAI measures with results from the classical clipping method in eight plots (the Pearson correlation between the two sets of measurements was 0.89, p = 0.003, for more information see Electronic Supplementary Materials, Appendix S3), allowing us to express total biomass in dry weight (g m−2). Biomass for the remaining sown species and
for the colonizer species was estimated by multiplying the cover by the average height of each plant species, with the latter being obtained from the LEDA Traitbase (Kleyer et al. 2008) or InfoFlora (www.infofl ora.ch, accessed in October 2015). This number was then summed over all species in both groups. These “volumes” were expressed as propor-tions that were multiplied by the total above-ground bio-mass, yielding the two dependent response variables RemB and ColB, respectively. Note that this estimate assumes that the density of all species is similar.
Phylogenetic diversity
We used the freely available online software Phylomatic (Webb and Donoghue 2005) to construct a dated phylog-eny that covered all 113 plant species observed in all 144
plots. Recent work did not reveal important differences in the capacity to uncover correlations of phylogenetic diver-sity and ecological patterns between the application of a fully resolved molecular phylogeny or a supertree with polytomies, as in our case (Cadotte et al. 2008, 2009). Congener data were employed for species identified only to the genus level. Using the R-package picante (Kem-bel et al. 2010), we determined the phylogenetic diver-sity (PD) within each experimental plot by calculating the mean pairwise phylogenetic distance weighted by the abundance of present species (Webb et al. 2002). This was achieved for the remaining sown (RemPD) and the colo-nizer species (ColPD).
Plant species composition
Due to non-independence among plots that share spe-cies, in BEF analyses, it is essential to take into account the composition of the experimental plots in order to avoid so-called ‘hidden treatments’ (Huston 1997). In a recent paper (Sandau et al. 2014), we demonstrated that incorporating compositional similarity between plots in GLMMs improved model fit. Here, we followed Kahmen et al. (2005) and used nonmetric multidimensional scal-ing (NMDS) (Legendre and Legendre 1998) to reduce the dimensionality of composition. We chose this approach, as composition can then be easily included in the statisti-cal model as a fixed effect (Sandau et al. 2014). NMDS is not influenced by non-normally distributed data, as it uses rank order instead of Euclidian distances, and is considered very robust (Minchin 1987). We computed NMDS for the different groups of species in our experi-mental plots: the sown assemblages, the total plant com-munity, the remaining sown species, and the colonizer species. The axes representing composition for the dif-ferent groups were based on Sørensen dissimilarity for the sown composition (presence/absence data), and on Bray–Curtis dissimilarity for the total, the remaining, and the colonizer groups (cover data). The coordinates along two or three quantitative axes, depending on the stress values, were used as quantitative variables express-ing plant composition and were entered in the statistical model as fixed effects. Using the metaMDS function from the vegan package (Oksanen et al. 2015) with 50,000 random starting points, we calculated NMDS plot scores for sown plant species mixtures (two axes: nmdsSownX, nmdsSownY; stress value = 0.14), for the remaining sown plant composition (two axes: nmdsRemX, nmdsRemY: stress value = 0.18), and for the composition of coloniz-ers (three axes: nmdsColX, nmdsColY, nmdsColZ; stress value = 0.23). NMDS plots for these three groups are given in Electronic Supplementary Materials, Appendix S4.
Statistical analyses
We built general linear mixed effect models (GLMMs) using the lme function from the nlme-package (Pinheiro et al. 2013) to investigate the influence of species richness, composition, phylogenetic diversity, and exclosure treat-ment on productivity. To meet the normality assumption of our statistical models, some variables were Box–Cox transformed; in all cases, we examined the distribution of the residuals with QQ plots. The response variable ‘total above-ground biomass’ was Box–Cox-transformed with the power parameter γ = 0.54 using the car-package version 2.1-0 (Fox and Weisberg 2011). As customarily done in BEF studies (e.g., Hector et al. 1999), the variables sown richness (SownS), remaining sown species (RemS), colonizer species (ColS), and total species richness (S = RemS + ColS) were log2-transformed. These variables were included in the dif-ferent models to analyse the classical BEF relationship. Note that, to account for the different abundances (here, covers) of the plant species, we also performed analyses with Hill number H1 (Hill 1973) instead of species richness, and with evenness measures based on Shannon index in addition to species richness. Since the inclusion of these additional vari-ables did not improve the fits of the statistical models [see Rohr et al. (2016) for an argument], they are not presented here. Composition and phylogenetic diversity were meas-ured as explained above; exclosure treatment was included as a factor with three levels (Control, PE, PHE), with Con-trol corresponding to the intercept. All quantitative variables were scaled to zero mean and unit standard deviation, which allows for the comparison of parameter estimates. The 11 fields and the split-plot design were included as random effects.
In our analyses, we retained in all models the combination of (1) exclosure treatment, (2) sown species diversity and (3) the NMDS-axes representing the sown species composi-tion, as these variables reflect the design of the experimental setup. Our most complex model for total biomass contained the additional predictor variables species richness of remain-ing and colonizer species, phylogenetic diversity, and the NMDS-axes representing composition for the remaining sown species and for the colonizer species.
We applied an information theoretic framework for model selection (Jørgensen 2004). Using the dredge function of the package MuMin (Bartón 2015, v 1.15.1.), we fitted models with all possible combinations of predictor variables. First, we ranked models according to the values of the Akaike Information Criterion for finite sample sizes (AICc) before selecting all “plausible” models with a ΔAICc ≤ 6. We chose this value because it has been shown that the most parsimo-nious model may not be included when using the usual cri-terion of ΔAICc ≤ 2 (Richards 2005). Next, we singled out models with AICc values lower than those of all the models
within which they were nested. The application of this rule created a model subset that excluded unduly complex mod-els (Richards 2008). We then performed a model averaging approach that allowed accounting for model uncertainty. We derived estimates of model parameter values from the sub-set of candidate models. Relative importance of explanatory variables was calculated by summing model weights, AICω, across all models of the subset where the variable was sent. The explanatory power of parameters that are not pre-sent in any model is usually deemed to be unimportant. We report both the best model and the model averaging results.
The above approach considered biomass globally. We further separated biomass into the contributions of remain-ing and of colonizer species. As the proportions of above-ground biomass of the two groups are not independent, we used structural equation models (SEM) to explore the fit of several a priori causal models, starting with the most com-plete one (Electronic Supplementary Materials, Appendix S5), from which we evaluated simpler plausible models. The variables representing species composition (the NMDS axes) and phylogenetic diversity were initially linked to all four response variables (richness and biomass of colonizer and of remaining sown species) and were then subjected to backward elimination, using AICc as a criterion. Note that the selection process was not applied individually to the NMDS axes representing species composition, but to the group of variables (two axes for the remaining sown species, three axes for the colonizer species).
We used piecewise SEM (package piecewiseSEM in R; Lefcheck 2016) for this purpose. This approach offers the possibility to include random effects, in our case the field and split-plot structure. All paths were assumed to be directional. The variables for the biomasses were Box–Cox transformed (remaining sown species RemB, γ = 0.84; colo-nizer species ColB, γ = 0.33). All statistical analyses were performed using R version 3.2.2 (R Development Core Team 2015).
Results
Diversity–productivity analyses and community invasibility
The initial sown species richness varied between 2 and 20 species, whereas total species richness in plots ranged from 9 to 42. Across all plots, we found 113 different plant spe-cies, the sown species included (Electronic Supplementary Materials, Appendix S2). While there was still a strong cor-relation between the number of species sown in plots and the diversity of remaining sown species (Pearson’s product-moment correlation, r = 0.978, df = 124, p < 0.001); there
was no correlation between sown species level and total species richness (r = 0.021, df = 124, p = 0.812).
The results of the traditional BEF analysis, which used sown species richness as an explanatory variable, confirmed our first hypothesis: the sown species richness levels and the aboveground biomass were weakly but significantly
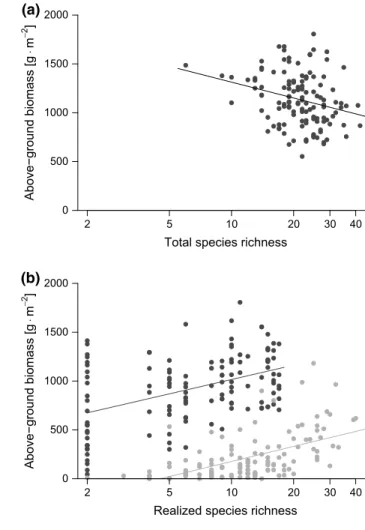
positively correlated (0.200 ± 0.067 SE, t = 2.996, p = 0.004) (Fig. 1a). In contrast, replacing sown species richness with total species richness produced a significant negative rela-tionship (− 0.242 ± 0.079 SE, t = − 3.063, p = 0.003, Fig. 2a). Note that exclosure treatment was not associated with pro-ductivity in either of the two models.
Greater sown species richness increased the resist-ance to “invasion”. Significantly fewer colonizer spe-cies could immigrate into higher diversity plots (slope = − 0.657 ± 0.061 SE, t = − 10.840, p < 0.001) (Fig. 1b). In line with this result, when separating the bio-mass of remaining sown species and of colonizer species, we found that the latter decreased markedly with sown spe-cies richness (− 0.500 ± 0.071 SE, t = − 7.086, p < 0.001), while the former increased (0.460 ± 0.067 SE, t = 6.851,
p < 0.001) (Fig. 1c). The relationships between the biomass of remaining sown species and of colonizer species and
2 6 12 20 0 500 1000 1500 2000 Above−ground biomass [g ⋅m − 2 ] (a) 2 6 12 20 0 10 20 30 40 Number of colonizers (b) 2 6 12 20 0 500 1000 1500 2000
Sown species richness
Above−ground biomass [ g ⋅m − 2 ] (c)
Fig. 1 Results for the sown species richness, displayed on a
log-scaled x-axis. a Total above-ground biomass per m2. b Number of colonizer species. c Above-ground biomass separated between the remaining sown species (dark grey) and the colonizer species (light grey); boxplots give minimum, 1st quartile, median, 3rd quartile, and maximum values, with observations outside 1.5 times the interquar-tile range being plotted as dots
2 5 10 20 30 40 0 500 1000 1500 2000
Total species richness
Above−ground biomass [g ⋅m − 2 ] (a) 2 5 10 20 30 40 0 500 1000 1500 2000
Realized species richness
Above−ground biomass [ g ⋅m − 2 ] (b)
Fig. 2 Results for the realized species richness, displayed on a
log-scaled x-axis. a Total above-ground biomass per m2 as a function of the total number of species. b Above-ground biomass separated between the remaining sown species (black) and the colonizer spe-cies (grey) as a function of their respective realized spespe-cies richness (RemS and ColS, respectively)
their corresponding realized species richness (RemS and ColS, respectively) were strongly positive for both groups (0.497 ± 0.068 SE, t = 7.337, p < 0.001; 0.630 ± 0.070 SE,
t = 8.969, p < 0.001, respectively) (Fig. 2b), which is an intriguing result since the combination of the two groups yielded the negative relationship between total biomass and total species richness (Fig. 2a).
Influence of species composition and phylogenetic diversity on total biomass
In addition to different measures of species richness, other factors are known to influence productivity. We included species composition (NMDS-axes) and phylogenetic diver-sity (PD) to explain total community above-ground biomass; the full model also included the exclusion treatment and the sown, remaining sown, and colonizer species richness. After model selection, the best model (ΔAICc = 0.098) showed significant effects of the second NMDS-axis of sown species composition, of the first NMDS axis of the remaining sown species composition, and of species richness of the colonizer species (Table 1). Since the model selection did not reveal a single best model with ΔAICc < 2, we complemented the analysis with a model averaging approach. Thirty-three models had a reasonable likelihood to be the best model (i.e., models with ΔAICc ≤ 6 relative to the model with the
smallest AIC value) and had model weights ranging from 0.10 to 0.01 (Electronic Supplementary Materials, Appen-dix S6). Excluding overly complex models resulted in a subset of 12 candidate models, which yielded the results presented in Table 2. The negative role of colonizer spe-cies richness for community biomass then became apparent, as evidenced by the high value for relative variable impor-tance (Σωi= 0.90) and the marginally significant negative correlation (r = − 0.226, p = 0.056); colonizer composition was not significant and of minor relevance (Σωi = 0.46). As in the best model described above, the second NMDS-axis representing the remaining sown species composition was significantly associated with total above-ground biomass (0.045, p = 0.030), but showed a moderate relative vari-able importance (Σωi = 0.63). Phylogenetic diversity of the remaining species (Σωi= 0.57) displayed an even smaller variable importance, and the measure was not significant. Note that the variables SownS, exclosure treatment and the quantitative NMDS scores for sown species composition were included in all models, as they represent the experi-mental setup.
Structural equation modelling for the biomass of the sown and of the colonizer species
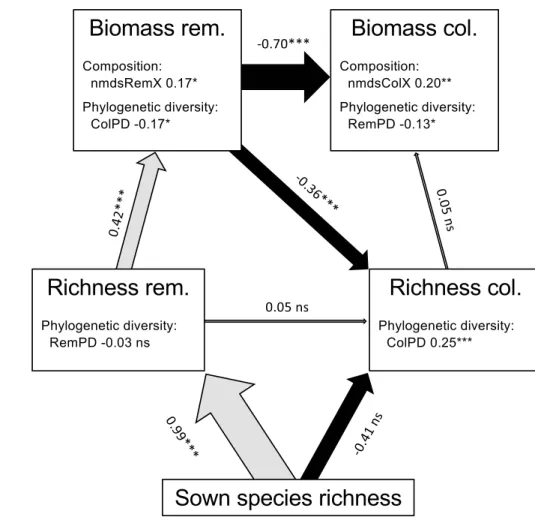
The best a priori “causal” model is presented in Table 3 and summarized in Fig. 3. Interestingly, it shows that the positive relationship between the diversity and biomass of Table 1 Results for the best linear mixed effects model explaining
total aboveground biomass per plot
The initial full model included the effect of species richness, compo-sition (NMDS-axes) and phylogenetic diversity (PD) of the originally sown species, of the remaining sown species and of the colonizer spe-cies. Given are the model average parameter estimates, the adjusted standard errors, t values and the p values
Parameters: PE predator exclusion, PHE predator and herbi-vore exclusion, SownS sown species richness, nmdsSownX and
nmdsSownY 1st and 2nd NMDS axes for sown composition, ColS
species richness of colonizers, RemPD phylogenetic diversity of remaining sown species, nmdsRemX and nmdsRemY 1st and 2nd NMDS axes for the composition of remaining sown species. Note that SownS, PE and PHE, and nmdsSownX and nmdsSownY were retained in the model as they represent the experimental design Parameter Estimate Adjusted SE t value p value
(Intercept) − 0.139 0.218 − 0.637 0.526 PE 0.102 0.195 0.523 0.607 PHE 0.253 0.194 1.301 0.208 log2 (SownS) 0.176 0.117 1.499 0.138 nmdsSownX − 0.022 0.107 − 0.207 0.837 nmdsSownY 0.237 0.091 2.590 0.011 log2 (ColS) − 0.241 0.092 − 2.617 0.011 RemPD − 0.178 0.111 − 1.598 0.114 nmdsRemX 0.228 0.098 2.332 0.022 nmdsRemY 0.032 0.112 0.286 0.775
Table 2 Model averaged coefficients for the fitted general linear
mixed effects models explaining total aboveground biomass per plot
Legend as in Table 1, with additionally: nmdsColX, -Y, and -Z 1st, 2nd, and 3rd NMDS axes for the composition of colonizer species. Relative variable importance equals the sum of Akaike weights for the models including the variable; as SownS, PE and PHE, and nmdsSownX and -Y were coerced to be present in all fitted models, their relative importance equals 1
Parameters Estimate Adjusted SE z value p value Variable importance (Intercept) − 0.121 0.217 0.558 0.577 PE 0.093 0.204 0.458 0.647 1.00 PHE 0.218 0.209 1.043 0.297 1.00 log2 (SownS) 0.148 0.137 1.084 0.279 1.00 nmdsSownX − 0.060 0.125 0.479 0.632 1.00 nmdsSownY 0.192 0.089 2.171 0.030 1.00 log2(ColS) − 0.226 0.118 1.913 0.056 0.90 RemPD − 0.126 0.139 0.907 0.365 0.57 nmdsRemX 0.163 0.148 1.102 0.270 0.63 nmdsRemY 0.045 0.096 0.468 0.640 0.63 nmdsColX 0.101 0.125 0.807 0.420 0.46 nmdsColY 0.023 0.067 0.339 0.735 0.46 nmdsColZ − 0.029 0.060 0.476 0.634 0.46
http://doc.rero.ch
colonizers (Fig. 2b) was in fact indirect, being constrained by the biomass of the remaining sown species: this vari-able had a strong direct negative influence on both the spe-cies richness and biomass of colonizers. As expected, we find that the experimentally sown species richness strongly determined the number of remaining sown species; also, it negatively affected the richness of colonizer species, but the relationship was not statistically significant despite the large effect size. The positive diversity–biomass rela-tionship customarily observed in highly controlled experi-ments is visible in our framework by the positive effect of remaining sown species diversity on their biomass. We find that species composition played a role on the biomass of both groups of species, but only the first NMDS axes were statistically significant (Table 3). Finally, the correla-tion between phylogenetic diversity and species richness was not significant for the remaining sown species, which is expected since species composition was experimen-tally manipulated (Electronic Supplementary Materials, Fig. S4.1), but was positive and strongly significant for the colonizer species. Interestingly, the phylogenetic diversity of both groups of species had a significant negative influ-ence on the biomass of the other group, but was not related to their own biomass.
Discussion
Diversity–productivity analyses and community invasibility
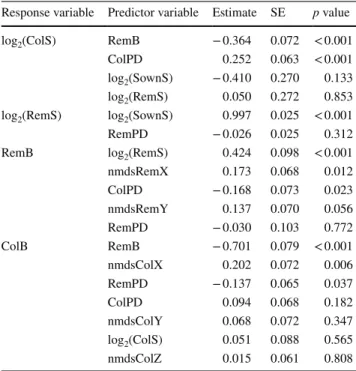
By applying either “classical” sown species richness levels or total species richness to explain total above-ground bio-mass, we observed a change in the sign of the relationship for the BEF analysis (Figs. 1a, 2a). The negative relation-ship that was observed between total species richness and productivity can largely be explained as a result of the com-bined effects of the remaining sown species richness and the number of colonizer species immigrating from the regional species pool of the surrounding agricultural landscape. The differential contribution of the two groups (remaining sown and colonizer species) to total above-ground biomass is dis-played in Fig. 1c; with increasing sown species richness, the colonizers contribute proportionally less to total above-ground biomass. As a result of complementarity effects or of the selection of highly productive remaining sown species, the establishment of colonizers is limited by the formation of denser communities in high sown-diversity plots. This phenomenon is well established and is known as invasion (or community) resistance (e.g., Hector et al. 2001). In con-trast, numerous colonizers could establish in plots with low sown diversity, but the per-species increase in productivity is much lower for colonizers than for sown species (Fig. 2b). Together, invasion resistance and the different contributions of sown and colonizer species to biomass production com-bined to create a reversed species richness gradient. This phenomenon resulted in the observed negative BEF rela-tionship with total richness, where some plots formerly low in sown species richness became more species rich than originally species rich plots, and, at the same time, total biomass was little affected by the small-statured colonizer species. This phenomenon is consistent with results of other studies. Leps et al. (2007) described that 8 years after the beginning of experiments where plots were open to immi-gration, productivity was lowest where the highest plant spe-cies richness values were found. As our wildflower strips were established in arable fields, the plant species colonizing our experimental plots were mostly small-statured, annual arable weeds that are adapted to fulfil their life cycle within one growing season. In contrast, the majority of the sown species from the wildflower-strip mixture were biannual or perennial species of rather tall stature and they were already well established in the 2nd year of their life cycle. We sug-gest that the difference in life history traits of sown species vs. colonizer species, in combination with available space, may be one key to understanding our observed negative BEF relationship, and argue for a functional approach to under-stand ecosystem functioning (Bracken and Williams 2017). Table 3 Results of the best piecewise structural equation model using
biomass of the remaining sown species (RemB) and colonizer species (ColB) as the response variables of interest
Legend as in Tables 1 and 2, with additionally: ColPD phylogenetic diversity of colonizer species, RemS number of remaining sown spe-cies
Response variable Predictor variable Estimate SE p value
log2(ColS) RemB − 0.364 0.072 < 0.001 ColPD 0.252 0.063 < 0.001 log2(SownS) − 0.410 0.270 0.133 log2(RemS) 0.050 0.272 0.853 log2(RemS) log2(SownS) 0.997 0.025 < 0.001 RemPD − 0.026 0.025 0.312 RemB log2(RemS) 0.424 0.098 < 0.001 nmdsRemX 0.173 0.068 0.012 ColPD − 0.168 0.073 0.023 nmdsRemY 0.137 0.070 0.056 RemPD − 0.030 0.103 0.772 ColB RemB − 0.701 0.079 < 0.001 nmdsColX 0.202 0.072 0.006 RemPD − 0.137 0.065 0.037 ColPD 0.094 0.068 0.182 nmdsColY 0.068 0.072 0.347 log2(ColS) 0.051 0.088 0.565 nmdsColZ 0.015 0.061 0.808
http://doc.rero.ch
Traditionally, the often reported positive relationship between diversity and above-ground biomass is explained by either the sampling effect or niche complementarity (Cardinale et al. 2007). The sampling effect refers to the idea that diverse plots are more likely to include the most dominant species that will have a major effect on the func-tion of the community (Loreau 1998). Niche complemen-tarity assumes that species use different resources in differ-ent ways, e.g., variation in rooting depth for soil nutridiffer-ents, so that resources are exploited more completely in more diverse plots. We were not able to apply the additive parti-tioning method usually implemented to separate these two effects (Loreau and Hector 2001), as it was not feasible to include monocultures for the unpredictable 93 colonizer species. In our case, we cannot estimate the relative impor-tance of the two processes, but it is likely that alone or col-lectively, they account for the observed positive effect of sown species richness on total biomass. Interestingly, since sown species of the wildflower-strip mixtures all belong to the tall-herb functional group (Roscher et al. 2004), the positive BEF relationship for these species (Fig. 2b) is not due to complementarity at the functional-group level (Loreau and Hector 2001), at least when group member-ship is defined a priori (Petchey 2004).
Global relationships of remaining sown and of colonizer species to the BEF relationship The SEM approach indicated that remaining sown spe-cies richness was positively related to the biomass of the remaining sown species, which reflects the results of highly controlled BEF experiments. In contrast, the positive rela-tionship between richness and biomass of colonizer species observed (Fig. 2b) was in fact indirect, being constrained by the biomass of remaining sown species. This result can be explained by invasion resistance: the lower resistance of the low sown diversity allowed the colonization by low produc-tive species from the surrounding landscape. However, the SEM analysis indicated that it was not a direct effect of the diversity, but rather that it operated through the biomass of the remaining sown species (Milbau et al. 2005). Higher numbers of sown species resulted in higher biomasses, preventing the installation of colonizer species, probably through niche packing (Levine and D’Antonio 1999; Funk et al. 2008) and competition for light (Hautier et al. 2009).
The observation that the BEF relationships for the remaining sown and the colonizer species are both positive (Fig. 2b), but that this relationship becomes negative when both groups are merged (Fig. 2a), may also be explained Fig. 3 Structural equation
model for the Grandcour experiment. Boxes represent measured variables and arrows unidirectional relationship among variables. Black arrows denote negative relationships; grey arrows positive ones, with their thickness proportional to their standardized regression coefficient (given in number with their significance along the corresponding arrow). For clar-ity, variables expressing species composition and phylogenetic diversity are given within the corresponding box of the response, and some non-signif-icant variables are omitted. Full results and abbreviations are in Table 3, with additionally: rem. remaining sown species, col. colonizer species
under the framework of a new BEF theory (Parain et al. 2019). This theory is based on a mechanistic Lotka–Volterra competition model and posits that the relationship between relative biomass (i.e., total biomass of the polyculture divided by the average biomasses of the species in mono-cultures; Cardinale et al. 2006) follows a saturating function whose asymptote is tuned by the average level of competi-tion between the species. Increased interspecific competicompeti-tion will flatten the relationship between species richness and relative biomass, which can even become negative if inter-specific is stronger than intrainter-specific competition. Such a situation is predicted to lead to extinctions in the community, except in the case of strong asymmetric competition. In our case, it is plausible that asymmetric competition for light between sown species and small statured colonizers will increase markedly the average level of competition when considering all species together (Hautier et al. 2009), and consequently render the relationship negative. The global driving factor would be competition between the tall- and small-herb functional groups, while complementarity effects could operate within each group.
Influence of species composition and of phylogenetic diversity
Since species composition changes with species diversity, we accounted for this factor in the BEF analyses. We used a NMDS approach to reduce the dimensionality of the com-position data, and included the coordinates of the plots on the NMDS axes as fixed effects in the statistical model. In the global BEF analyses, we found a strong effect of plant composition of sown species on productivity (Tables 1, 2). In the SEM analysis, when separating the community into remaining sown species composition and colonizer com-position, the contribution of species composition became apparent for both groups (Fig. 3 and Table 3). This indicates that, in general, plots with similar composition tend to have similar biomass.
Phylogenetic diversity has been suggested as a better pre-dictor for productivity than species richness (Cadotte et al. 2008). The rationale is that ecological traits are phylogeneti-cally conserved and, thus, assemblages composed of spe-cies from more distantly related taxa should have a higher potential for complementarity. In accordance with the results of a recent meta-analysis (Venail et al. 2015), we found no relationship between phylogenetic diversity and productivity when considering global biomass. However, the results are intriguing when separating the biomass of the remaining sown and of the colonizer species in the SEM analysis. We found no direct relationship between phylogenetic diversity and biomass within each group, but a crossed effect: phylo-genetic diversity of remaining sown species was negatively related to the biomass of the colonizer species, and similarly
for the phylogenetic diversity of colonizer species and bio-mass of remaining sown species. The former relationship hints at plots with higher trait diversity being more resistant to invasions; the latter relationship could be interpreted as a result of high sown diversity communities having a filtering effect on the colonizer species, allowing only taxonomically different species to establish, or possibly that groups of colo-nizers with higher trait diversity may be more competitive against the established sown species.
The relationship between species richness and phylo-genetic diversity is very strong for the colonizer species, but absent for the remaining sown species, which is likely a consequence of the experimental setup, as sown communi-ties were randomly assembled from the experimental species pool. Finally, it should be noted that the potential effect of phylogeny may be difficult to detect when species composi-tion is accounted for in the models, as these two factors are not independent. Phylogenetic diversity for the different spe-cies groups and the first NMDS axes are indeed significantly correlated in both groups (for remaining sown and colonizer species, Pearson correlation coefficients equal − 0.26 and − 0.28, respectively, with both p values < 0.003).
Conclusion
The results from our field experiment, where communities sown with different species richness levels were open to immigration, shed new light on the discrepancy between results obtained in controlled and in unmanipulated studies. While the BEF relationship is negative when considering total species richness, the signal of a positive relationship remains for the group of experimentally manipulated spe-cies. Our results agree with previous observations from sys-tems under discontinued experimental control and after the cessation of weeding, in which the positive BEF relation-ship faded (Pfisterer et al. 2004; Roscher et al. 2009). In our case, this relationship even became negative (Fig. 2a). Experimental studies that artificially maintain different spe-cies diversity levels may reflect semi-natural situations only, especially when largely isolated plant communities with a high “dark diversity” (sensu Pärtel et al. 2011) are compared with functionally diverse and species-rich grasslands (Lepš 2004). Our experimental setting is closer to semi-natural conditions common in extensive agroecosystems, where plant assemblages are generally embedded within a meta-community network linked by migration and subjected to perturbations, where a species-poor community will quickly be colonized by propagules from the local species pool. In turn, the relationship between diversity and productivity will depend on the functional traits of the colonizers (Díaz et al. 2007), whether they are agricultural small-statured annual weeds with no strong contribution to total biomass and
functionally redundant to established species, or comple-mentary productive species that might greatly increase total biomass. Sustaining the service of productivity in a land-scape context requires the adoption of a meta-community approach, which will enable a better understanding of the connectivity between communities and the functional con-sequences of those species exchanges.
Acknowledgements We thank Jan Lepš, Loïc Pellissier and Sarah M.
Gray for helpful suggestions on an earlier version of the manuscript, and Sven Bacher for help with model averaging. We are grateful for the participation of Jacques Studer and of the farmers from Grandcour and all the valuable help provided by friends and family members.
Author contribution statement NS, PK and LFB planned the
experi-ment, NS, AA, YF and OTB conducted the experiexperi-ment, NS, RPR and LFB conducted the analyses; NS, REN and LFB wrote the article.
Funding This study was supported by the Swiss National Science
Foundation (Grant 31003A_138489 to LFB).
Compliance with ethical standards
Conflict of interest The authors declare that they have no conflict of
interest.
Data accessibility Data will be available in Dryad.
References
Assaf TA, Beyschlag W, Isselstein J (2011) The relationship between plant diversity and productivity in natural and in managed grass-lands. Appl Ecol Environ Res 9:157–166. https ://doi.org/10.15666 /aeer/0902_15716 6
Bartón K (2015) MuMIn: multi-model inference. R package version 1.9.13. 1:18
Bracken MES, Williams SL (2017) The underappreciated role of life history in mediating the functional consequences of biodiversity change. Oikos 126:488–496. https ://doi.org/10.1111/oik.03884
Bruggisser OT, Sandau N, Blandenier G, Fabian Y, Kehrli P, Aebi A, Naisbit RE, Bersier L-F (2012) Direct and indirect bottom-up and top-down forces shape the abundance of the orb-web spider
Argiope bruennichi. Basic Appl Ecol 13:706–714. https ://doi.
org/10.1016/j.baae.2012.10.001
Cadotte MW, Cardinale BJ, Oakley TH (2008) Evolutionary history and the effect of biodiversity on plant productivity. Proc Natl Acad Sci USA 105:17012–17017. https ://doi.org/10.1073/pnas.08059 62105
Cadotte MW, Hamilton MA, Murray BR (2009) Phylogenetic relatedness and plant invader success across two spatial scales. Divers Distrib 15:481–488. https ://doi.org/10.111 1/j.1472-4642.2009.00560 .x
Cardinale BJ, Nelson K, Palmer MA (2000) Linking species diver-sity to the functioning of ecosystems: on the importance of envi-ronmental context. Oikos 91:175–183. https ://doi.org/10.103 4/j.1600-0706.2000.91011 7.x
Cardinale BJ, Srivastava DS, Duffy JE, Wright JP, Downing AL, Sankaran M, Jouseau C (2006) Effects of biodiversity on the func-tioning of trophic groups and ecosystems. Nature 443:989–992.
https ://doi.org/10.1038/natur e0520 2
Cardinale BJ, Wright JP, Cadotte MW, Carroll IT, Hector A, Srivas-tava DS, Loreau M, Weis JJ (2007) Impacts of plant diversity on biomass production increase through time because of species complementarity. Proc Natl Acad Sci 104:18123–18128. https :// doi.org/10.1073/pnas.07090 69104
Cavender-Bares J, Kozak KH, Fine PVA, Kembel SW (2009) The merging of community ecology and phylogenetic biology. Ecol Lett 12:693–715. https ://doi.org/10.1111/j.1461-0248.2009.01314 .x
Chapin FS III, Walker BH, Hobbs RJ, Hooper DU, Lawton JH, Sala OE, Tilman D (1997) Biotic control over the functioning of eco-systems. Science 277:500–504. https ://doi.org/10.1126/scien ce.277.5325.500
Díaz S, Lavorel S, de Bello F, Quétier F, Grigulis K, Robson TM (2007) Incorporating plant functional diversity effects in ecosys-tem service assessments. Proc Natl Acad Sci USA 104:20684– 20689. https ://doi.org/10.1073/pnas.07047 16104
Fabian Y, Sandau N, Bruggisser OT, Kehrli P, Aebi A, Rohr RP, Nais-bit RE, Bersier L-F (2012) Diversity protects plant communities against generalist molluscan herbivores. Ecol Evol 2:2460–2473.
https ://doi.org/10.1002/ece3.359
Fabian Y, Sandau N, Bruggisser OT, Aebi A, Kehrli P, Rohr RP, Naisbit RE, Bersier L-F (2013) The importance of landscape and spatial structure for hymenopteran-based food webs in an agro-ecosystem. J Anim Ecol 82:1203–1214. https ://doi. org/10.1111/1365-2656.12103
Fabian Y, Sandau N, Bruggisser OT, Aebi A, Kehrli P, Rohr RP, Nais-bit RE, Bersier L-F (2014) Plant diversity in a nutshell: testing for small-scale effects on trap nesting wild bees and wasps. Ecosphere 5:art18. https ://doi.org/10.1890/es13-00375 .1
Fox J, Weisberg S (2011) An R companion to applied regression, 2nd edn. Sage, Thousand Oaks
Funk JL, Cleland EE, Suding KN, Zavaleta ES (2008) Restoration through reassembly: plant traits and invasion resistance. Trends Ecol Evol 23:695–703. https ://doi.org/10.1016/j.tree.2008.07.013
Grace JB, Anderson TM, Smith MD, Seabloom E, Andelman SJ, Meche G, Weiher E, Allain LK, Jutila H, Sankaran M, Knops J, Ritchie M, Willig MR (2007) Does species diversity limit produc-tivity in natural grassland communities? Ecol Lett 10:680–689.
https ://doi.org/10.1111/j.1461-0248.2007.01058 .x
Günter M (2000) Establishment and care of perennial wildflower strips under specific conditions for arable farming in the Swiss mid-lands. Agrarökologie 37:1–154
Haaland C, Naisbit RE, Bersier L-F (2011) Sown wildflower strips for insect conservation: a review. Insect Conserv Divers 4:60–80.
https ://doi.org/10.1111/j.1752-4598.2010.00098 .x
Hautier Y, Niklaus PA, Hector A (2009) Competition for light causes plant biodiversity loss after eutrophication. Science 324:636–638.
https ://doi.org/10.1126/scien ce.11696 40
Hector A, Schmid B, Beierkuhnlein C, Caldeira MC, Diemer M, Dimi-trakopoulos PG, Finn JA, Freitas H, Giller PS, Good J, Harris R, Högberg P, Huss-Danell K, Joshi J, Jumpponen A, Körner C, Leadley PW, Loreau M, Minns A, Mulder CPH, O’Donovan G, Otway SJ, Pereira JS, Prinz A, Read DJ, Scherer-Lorenzen M, Schulze E-D, Siamantziouras A-SD, Spehn EM, Terry AC, Troumbis AY, Woodward FI, Yachi S, Lawton JH (1999) Plant diversity and productivity experiments in European grass-lands. Science 286:1123–1127. https ://doi.org/10.1126/scien ce.286.5442.1123
Hector A, Dobson K, Minns A, Bazeley-White E, Lawton JH (2001) Community diversity and invasion resistance: an experimental test in a grassland ecosystem and a review of comparable studies. Ecol Res 16:819–831. https ://doi.org/10.1046/j.1440-1703.2001.00443 .x
Hill MO (1973) Diversity and evenness: a unifying notation and its con-sequences. Ecology 54:427–432. https ://doi.org/10.2307/19343 52
Hooper DU, Adair EC, Cardinale BJ, Byrnes JEK, Hungate BA, Matu-lich KL, Gonzalez A, Duffy JE, Gamfeldt L, O’Connor MI (2012) A global synthesis reveals biodiversity loss as a major driver of ecosystem change. Nature 486:105–108. https ://doi.org/10.1038/ natur e1111 8
Huston MA (1997) Hidden treatments in ecological experiments: re-evaluating the ecosystem function of biodiversity. Oecologia 110:449–460. https ://doi.org/10.1007/s0044 20050 180
Jain M, Flynn DFB, Prager CM, Hart GM, DeVan CM, Ahrestani FS, Palmer MI, Bunker DE, Knops JMH, Jouseau CF, Naeem S (2014) The importance of rare species: a trait-based assessment of rare species contributions to functional diversity and possible ecosystem function in tall-grass prairies. Ecol Evol 4:104–112.
https ://doi.org/10.1002/ece3.915
Jørgensen SE (2004) Model selection and multimodel inference. Ecol Modell 172:96–97. https ://doi.org/10.1016/j.ecolm odel.2003.11.004
Kahmen A, Perner J, Audorff V, Weisser W, Buchmann N (2005) Effects of plant diversity, community composition and environ-mental parameters on productivity in montane European grass-lands. Oecologia 142:601–615. https ://doi.org/10.1007/s0044 2-004-1749-2
Kembel SW, Cowan PD, Helmus MR, Cornwell WK, Morlon H, Ack-erly DD, Blomberg SP, Webb CO (2010) Picante: r tools for inte-grating phylogenies and ecology. Bioinformatics 26:1463–1464.
https ://doi.org/10.1093/bioin forma tics/btq16 6
Kleyer M, Bekker RM, Knevel IC, Bakker JP, Thompson K, Sonnen-schein M, Poschlod P, Van Groenendael JM, Klimeš L, Klimešová J, Klotz S, Rusch GM, Hermy M, Adriaens D, Boedeltje G, Bossuyt B, Dannemann A, Endels P, Götzenberger L, Hodgson JG, Jackel A-K, Kühn I, Kunzmann D, Ozinga WA, Römermann C, Stadler M, Schlegelmilch J, Steendam HJ, Tackenberg O, Wil-mann B, Cornelissen JHC, Eriksson O, Garnier E, Peco B (2008) The LEDA traitbase: a database of life-history traits of the North-west European flora. J Ecol 96:1266–1274. https ://doi.org/10.111 1/j.1365-2745.2008.01430 .x
Lefcheck JS (2016) piecewiseSEM: piecewise structural equation mod-elling in r for ecology, evolution, and systematics. Methods Ecol Evol 7:573–579. https ://doi.org/10.1111/2041-210X.12512
Legendre P, Legendre L (1998) Numerical ecology, 2 english edn. Elsevier, Amsterdam
Lepš J (2004) What do the biodiversity experiments tell us about con-sequences of plant species loss in the real world? Basic Appl Ecol 5:529–534. https ://doi.org/10.1016/j.baae.2004.06.003
Lepŝ J, Doleਊal J, Bezemer TM, Brown VK, Hedlund K, Arroyo MI, Bracht Jörgensen H, Lawson CS, Mortimer SR, Peix Geldart A, Rodríguez Barrueco C, Santa Regina I, Ŝmilauer P, van der Putten WH (2007) Long-term effectiveness of sowing high and low diversity seed mixtures to enhance plant community devel-opment on ex-arable fields. Appl Veg Sci 10:97–110. https ://doi. org/10.1111/j.1654-109X.2007.tb005 08.x
Levine JM, D’Antonio CM (1999) Elton revisited: a review of evi-dence linking diversity and invasibility. Oikos 87:15. https ://doi. org/10.2307/35469 92
Loreau M (1998) Biodiversity and ecosystem functioning: a mecha-nistic model. Proc Natl Acad Sci USA 95:5632–5636. https ://doi. org/10.1073/Pnas.95.10.5632
Loreau M, Hector A (2001) Partitioning selection and complementa-rity in biodiversity experiments. Nature 412:72–76. https ://doi. org/10.1038/35083 573
Loreau M, Mouquet N (1999) Immigration and the maintenance of local species diversity. Am Nat 154:427–440. https ://doi. org/10.1086/30325 2
Milbau A, Nijs I, De Raedemaecker F, Reheul D, De Cauwer B (2005) Invasion in grassland gaps: the role of neighbourhood richness, light availability and species complementarity during
two successive years. Funct Ecol 19:27–37. https ://doi.org/10. 1111/j.0269-8463.2005.00939 .x
Minchin PRR (1987) An evaluation of the relative robustness of techniques for ecological ordination. Vegetatio 69:89–107. https ://doi.org/10.1007/BF000 38690
Mouquet N, Moore JL, Loreau M (2002) Plant species richness and community productivity: why the mechanism that promotes coexistence matters. Ecol Lett 5:56–65. https ://doi.org/10.104 6/j.1461-0248.2002.00281 .x
Narwani A, Matthews B, Fox JW, Venail PA (2015) Using phy-logenetics in community assembly and ecosystem func-tioning research. Funct Ecol 29:589–591. https ://doi. org/10.1111/1365-2435.12431
Nentwig W (2000) Streifenförmige ökologische Ausgleichsflächen in der Kulturlandschaft: Ackerkrautstreifen, Buntbrachem, Fel-dränder. vaö - Verlag Agrarökologie, Bern, Hannover
Oksanen J, Blanchet FG, Kindt R, Legendre P, Minchin PR, O’Hara RB, Simpson GL, Solymos P, Stevens MHH, Wagner HH (2015) Vegan: community ecology package. R packag. version 2.2-1 Parain E, Rohr RP, Gray SM, Bersier L-F (2019) Global warming
dis-rupts biodiversity-ecosystem functioning relationships. Am Nat
(in press)
Pärtel M, Szava-Kovats RC, Zobel M (2011) Dark diversity: shedding light on absent species. Trends Ecol Evol 26:124–128. https ://doi. org/10.1016/j.tree.2010.12.004
Petchey OL (2004) On the statistical significance of functional diver-sity effects. Funct Ecol 18:297–303. https ://doi.org/10.111 1/j.0269-8463.2004.00852 .x
Petermann JS, Fergus AJF, Roscher C, Turnbull LA, Weigelt A, Schmid B (2010) Biology, chance, or history? The predictable reassembly of temperate grassland communities. Ecology 91:408–421. https ://doi.org/10.1890/08-2304.1
Pfisterer AB, Joshi J, Schmid B, Fischer M (2004) Rapid decay of diversity-productivity relationships after invasion of experi-mental plant communities. Basic Appl Ecol 5:5–14. https ://doi. org/10.1078/1439-1791-00215
Pinheiro J, Bates D, DebRoy S, Sarkar D, R Core Team (2013) nlme: linear and nonlinear mixed effects models. R package version 1–86
R Core Team (2015). R: a language and environment for statistical computing. R foundation for statistical computing, Vienna, Aus-tria. https ://www.R-proje ct.org/
Richards SA (2005) Testing ecological theory using the information-theoretic approach: examples and cautionary results. Ecology 86:2805–2814. https ://doi.org/10.1890/05-0074
Richards SA (2008) Dealing with overdispersed count data in applied ecology. J Appl Ecol 45:218–227. https ://doi.org/10.11 11/j.1365-2664.2007.01377 .x
Rohr RP, Saavedra S, Peralta G, Frost CM, Bersier L-F, Bascompte J, Tylianakis JM (2016) Persist or produce: a community trade-off tuned by species evenness. Am Nat 188:411–422. https ://doi. org/10.1086/68804 6
Rösch V, Tscharntke T, Scherber C, Batáry P (2015) Biodiversity con-servation across taxa and landscapes requires many small as well as single large habitat fragments. Oecologia 179:209–222. https ://doi.org/10.1007/s0044 2-015-3315-5
Roscher C, Schumacher J, Baade J (2004) The role of biodiversity for element cycling and trophic interactions: an experimental approach in a grassland community. Basic Appl Ecol 5:107–121.
https ://doi.org/10.1078/1439-1791-00216
Roscher C, Temperton VM, Scherer-Lorenzen M et al (2005) Overy-ielding in experimental grassland communities—irrespective of species pool or spatial scale. Ecol Lett 8:419–429. https ://doi.org /10.1111/j.1461-0248.2005.00736 .x
Roscher C, Temperton VM, Buchmann N, Schulze E-D (2009) Com-munity assembly and biomass production in regularly and never
weeded experimental grasslands. Acta Oecol 35:206–217. https ://doi.org/10.1016/j.actao .2008.10.003
Roscher C, Fergus AJF, Petermann JS, Buchmann N, Schmid B, Schulze E-D (2013) What happens to the sown species if a biodi-versity experiment is not weeded? Basic Appl Ecol 14:187–198.
https ://doi.org/10.1016/j.baae.2013.01.003
Rose L, Leuschner C (2012) The diversity–productivity relationship in a permanent temperate grassland: negative diversity effect, dominant influence of management regime. Plant Ecol Divers 874:1–10. https ://doi.org/10.1080/17550 874.2012.72376 3
Rychtecká T, Lanta V, Weiterová I, Lepš J (2014) Sown species rich-ness and realized diversity can influence functioning of plant com-munities differently. Naturwissenschaften 101:637–644. https :// doi.org/10.1007/s0011 4-014-1198-7
Sandau N, Rohr RP, Naisbit RE, Fabian Y, Bruggisser OT, Kehrli P, Aebi A, Bersier L-F (2014) Including community composition in biodiversity-productivity models. Methods Ecol Evol 5:815–823.
https ://doi.org/10.1111/2041-210X.12215
Thompson K, Askew AP, Grime JP, Dunnett NP, Willis AJ (2005) Biodiversity, ecosystem function and plant traits in mature and immature plant communities. Funct Ecol 19:355–358. https ://doi. org/10.1111/j.0269-8463.2005.00936 .x
Tilman DG (2001) Diversity and productivity in a long-term grassland experiment. Science 294:843–845. https ://doi.org/10.1126/scien ce.10603 91
Tilman DG, Wedin D, Knops J (1996) Productivity and sustainabil-ity influenced by biodiverssustainabil-ity in grassland ecosystems. Nature 379:718–720. https ://doi.org/10.1038/37971 8a0
Tscharntke T, Tylianakis JM, Rand TA, Didham RK, Fahrig L, Batáry P, Bengtsson J, Clough Y, Crist TO, Dormann CF, Ewers RM, Fründ J, Holt RD, Holzschuh A, Klein AM, Kleijn D, Kremen C, Landis DA, Laurance W, Lindenmayer D, Scherber C, Sodhi N, Steffan-Dewenter I, Thies C, van der Putten WH, Westphal C (2012) Landscape moderation of biodiversity patterns and processes—eight hypotheses. Biol Rev 87:661–685. https ://doi. org/10.1111/j.1469-185X.2011.00216 .x
Van Ruijven J, Berendse F (2003) Positive effects of plant species diversity on productivity in the absence of legumes. Ecol Lett 6:170–175. https ://doi.org/10.1046/j.1461-0248.2003.00427 .x
Venail PA, Gross K, Oakley TH, Narwani A, Allan E, Flombaum P, Isbell F, Joshi J, Reich PB, Tilman D, van Ruijven J, Cardinale BJ (2015) Species richness, but not phylogenetic diversity, influ-ences community biomass production and temporal stability in a re-examination of 16 grassland biodiversity studies. Funct Ecol 29:615–626. https ://doi.org/10.1111/1365-2435.12432
Webb CO, Donoghue MJ (2005) Phylomatic: tree assembly for applied phylogenetics. Mol Ecol Notes 5:181–183. https ://doi.org/10.111 1/j.1471-8286.2004.00829 .x
Webb CO, Ackerly DD, McPeek MA, Donoghue MJ (2002) Phylog-enies and community ecology. Annu Rev Ecol Syst 33:475–505.
https ://doi.org/10.1146/annur ev.ecols ys.33.01080 2.15044 8