OPERATIONAL MODAL ANALYSIS OF A HIGH RISE RC
BUILDING AND MODELLING
Guillermo Wenceslao Fern´andez Lorenzo 1, Diego Mercerat2, Maria Paola Santisi d’Avila3, Etienne Bertrand4, Anne Deschamps5
1PhD student, G´eoazur, Universit´e de Nice Sophia Antipolis, guillermo.fernandez [email protected] 2
Dr., Dir. Ter. M´editerran´ee, Laboratoire de Nice, CEREMA, [email protected]
3
Dr., Laboratoire Jean Alexandre Dieudonn´e, Universit´e de Nice Sophia Antipolis, [email protected]
4Dr., Dir. Ter. M´editerran´ee, Laboratoire de Nice, CEREMA, [email protected] 5
Dr., G´eoazur, Universit´e de Nice Sophia Antipolis, [email protected]
ABSTRACT
Analysis of ambient vibration records enables the dynamic structural behaviour identification trough Operational Modal Analysis (OMA) techniques. This study uses a set of recordings of a 22-storey Re-inforced Concrete (RC) building in Nice (France), where no remarkable damages are detected since it is instrumented. Signals acquired using accelerometers and velocimeters are compared in different fre-quencies ranges. The main goal is to extract dynamic parameters (natural frefre-quencies, mode shapes and damping) of the building using different OMA techniques: Basic Frequency Domain (BFD), Frequency Domain Decomposition (FDD) and Random Decrement Technique (RDT). Obtained results are then compared to those provided by a Finite Element Model (FEM).
Keywords: Tall building, System identification, Ambient vibration, Operational Modal Analysis, Fre-quency Domain Decomposition, Random Decrement Technique, Finite Element Method
1. INTRODUCTION
Monitoring of buildings is becoming an increasingly popular topic of research. It allows to evaluate the structural health and check for any possible damage through changes on their dynamic properties. Widely accepted modal testing techniques for such a purpose are Experimental Modal Analysis (EMA) and Operational Modal Analysis (OMA). The first is based on the recording of the response to a known excitation (usually induced). The last only requires the output response to be recorded.
traffic, people moving around the building, etc.). This is extremely convenient as it is usually expensive, hard and undesired to induce artificial loading to existing buildings. Operation Modal Analysis algo-rithms can be divided in two types, whether if they operate in the frequency domain (Basic Frequency Domain (BFD), Frequency Domain Decomposition (FDD), etc.) or in the time domain (Random Decre-ment Technique (RDT), Stochastic Subspace Identification (SSI), etc.).
Continuous ambient vibration recording is carried out in a high-rise Reinforced Concrete (RC) building in Nice (France) at different levels of the structure. This study aims to identify dynamic properties of the structural system trough different OMA techniques. Empirical measures allow to verify the validity of numerical models. A reliable Finite Element (FE) model enables to simulate extreme situations, predict critical elements in the structure and observe the influence of damages on the building response for applications in Structural Health Monitoring (SHM).
2. CASE STUDY
2.1. Description of the building
The Prefectural Government building of Nice, shown in Figure 1, is a 22-storey building of 67.5 meters height, built in 1979. It is conformed by two principal RC towers. They are separated by a 10 centimetres joint designed to break away the dynamic response of both parts during strong motions. Each of the towers consist of a central RC cage (containing lifts and stairs) and a large glass fac¸ade supported by RC slabs, which are connected trough columns. Both parts of the building have identical bearing structure. The building is irregular in elevation according to Eurocode 8 criteria [11].
Geotechnical explorations show a high heterogeneity in the alluvial deposits under the building (located in the Var valley). This basin geological configuration produces local amplification effects on seismic waves exciting the structure [2]. A succession of ambient vibration studies, carried out between 2000 and 2007, estimate the fundamental frequency of the soil profile underneath as 2.7 Hz [7]. In the same context, the fundamental transverse and longitudinal frequencies of the building were estimated at 1.20 Hz and 1.22 Hz respectively.
The structure is classified as having low vulnerability according to VULNERALP assessment method [26]. It is an importance category 4 building according to Eurocode classification [11] (its integrity during earthquakes is of vital importance for civil protection), located in the level 4 (design peak ground acceleration of 2.24 m/s2) seismic region of the EC8 [11], according to the 2010 French seismic zoning.
2.2. Signal acquisition
The building is included in the French National Building Array Program (NBAP) for response analysis and vulnerability assessment and it is continuously monitored since June 2010 through 24 accelerometric sensors, operated by the French Accelerometric Network (RAP). The location of different sensors across the structure is detailed in Figure 2. Only one of the towers is instrumented due their similarity. The recording station is a Kephren 24 channels, which is disposed in the underground level of the building (level -2). The network is composed of:
• 18 mono-axial accelerometers Episensor type FBA ES-U2, at different levels • 2 tri-axial accelerometers Episensor type FBA EST, at the basement
The captors are configured to a sensibility of ±1 g. Recordings are performed at a sampling frequency of 125 Hz. Synchronized in time by the use of a GPS Garmin 16. Details regarding the process of installation and network characteristics are reported in [8].
3. COMPARISON OF RECORDINGS
3.1. Motivation of comparison
Sensors used to record building response to ambient vibrations should provide a low amount of electrical noise and be sensible enough to record weak excitations in the frequency range of interest (from 0.4 to 25 Hz for conventional buildings [17]).
Velocimeters are commonly used in traditional broad-band seismology, which are very sensible for a large frequency range and small amplitudes. Earthquake engineering however, is more interested in strong motions; accelerometers are then more appropriate as they are less sensible to wide band excitation and do not suffer from saturation. Both velocimeters and accelerometers have been widely used to record ambient vibrations in structures. Being the first more sensible, but the last more compact and portable. A number of sensors were evaluated to register ambient noise (based on the signal characteristics and sensors specifications) in the context of the project SESAME [1]. An in-situ comparison of registered signals, other than solely based on the specifications given by the manufacturers, is proposed in this study to corroborate the validity of the present accelerometric network for noise recording.
3.2. Study and results
Cross correlation between time-histories of an accelerometer (Episensor FBA EST) and a velocimeter (CGM40) disposed next to each other is computed. It is decided to locate them at the base of the building, expecting this point to record the lowest amplitudes (due to signal amplifications across the building) and hence show higher distortion of the records.
Time windows of 1000 s of ambient noise are studied. The signals are passband filtered, varying the low-cut and high-cut frequencies from 0.1 Hz to 100 Hz with a frequency step of 0.01 Hz. Instrumental correction was applied to obtain acceleration, velocity and displacement seismograms from both type of instruments.
Figure 3 shows the results of the analysis for an horizontal components of the accelerometer (channel HN2) and velocimeter (channel HH2) at the basement (location A1 in Figure 2). The time window is arbitrary chosen to start the 1st February 2014 at 12:00 a.m. Values of cross correlation coefficient are higher than 97%, 97%, and 90% (respectively for acceleration, velocity and displacement) for the above mentioned classical 0.4-25 Hz range in conventional buildings (red crosses in Figure 3). Better results are found in the case of adapting the filter to the natural frequency content of the building. For example, a filter between 1-10 Hz provides the principal modes of the structure and increase the cross correlation coefficients values to more than 99%, 98%, and 95% (green crosses in Figure 3).
Figure 3: Contour plots of cross correlation coefficient between accelerometer and velocimeter recordings for different passband cutting frequencies. Red and green crosses highlight values for 0.4-25 Hz and 1-10 Hz passband filters respectively
4. STRUCTURAL IDENTIFICATION
The three first modes are identified using the Basic Frequency Domain (BFD), Frequency Domain De-composition (FDD) and Random Decrement Technique (RDT). Brief description and interpretation of the results on each case is provided for better understanding.
Being the lowest natural frequency around 1.2Hz and assuming a damping ratio of 1%, a recording length of 833 s is recommended [24]. In accordance, time length is selected as 1000s to provide a resolution of 10−3 in the frequency spectrum. Studied windows are limited to 10 and selected contiguously to minimize variability of the natural frequencies due to the environmental conditions [13]. Confidence interval is provided as one standard deviation of the measures. The outset of the first window is the same as in Figure 3. Signals are passband filtered (using a fourth order Butterworth filter) to the previously mentioned typical range of interest of 0.4 Hz to 25 Hz.
4.1. Basic Frequency Domain
The BFD technique [4], also called Peak Picking method, is often used as a simple way to estimate modal parameters from output-only data [15]. It is based on the Fourier Transform of the signal to the frequency domain by using the FFT algorithm. Details about obtaining reliable estimates of modal frequencies using this technique are presented by Felber [12].
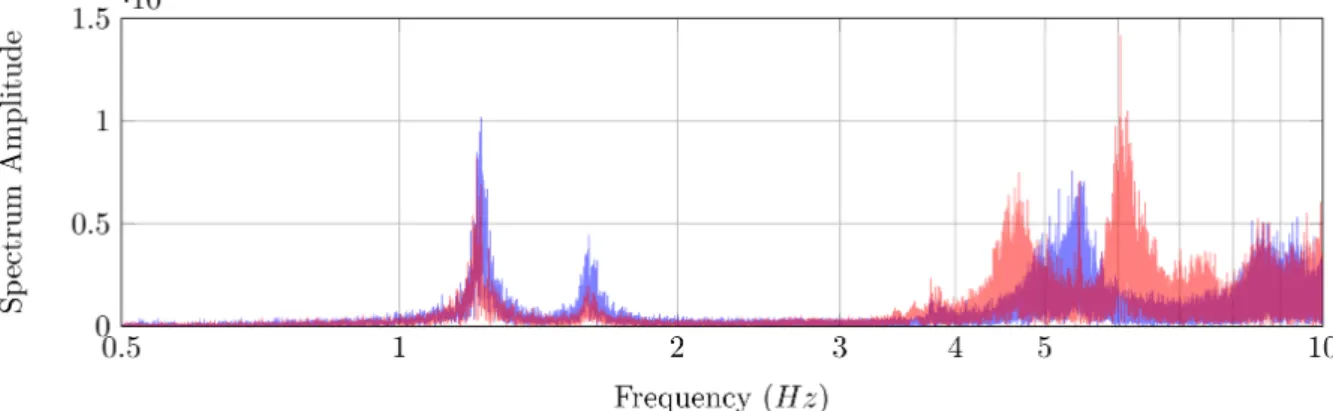
Figure 4 shows the Fourier Transform, of the longitudinal (HN2) and transversal (HN3) components, at
Figure 4: Amplitude of the frequency spectrum for the HN2 (blue) and HN3 (red) components at the top of the building (V0)
the top of the building (V0 in Figure 2), for the selected first time window. Resonant frequencies are seen for both motion directions around 1.2Hz and 1.6Hz in Figure 4. The proximity of the values for the two components suggests either the existence of two different modes, or a single one that affects both directions.
Modal frequencies are identified at the maximum amplitude values (for the ten time windows) of the spectrum crests across the different levels of the building. Results of the average values and confidence interval are seen in Table 3.
4.2. Frequency Domain Decomposition
The FDD method [5], or Complex Mode Indicator Function (CMIF) [19], is a non-parametric frequency domain technique for modal identification of output-only systems. It is based on the decomposition of the Power Spectral Density (PSD) matrix of recorded signals into a set of single degree of freedom systems. The separation is done trough the Singular Value Decomposition (SVD) method [20]. It is a Multi-Input/Multi-Output (MIMO) technique, and the relationship between the unknown input x(t) and the measured response y(t) is based on the Power Spectral Density (PSD) relationship for stochastic processes [3]:
Gyy(jω) = H∗(jω)Gxx(jω)H(jω)T (1)
where Gxx(jω) is the input PSD matrix, Gyy(jω) is the output PSD matrix, H(jω) is the Frequency Response Function (FRF) matrix, where∗ andT denote complex conjugate and transpose, respectively. Details of the technique are provided by Brincker et al. [6].
Figure 5: 1st(blue), 2nd(red) and 3rd(green) Singular Values of the of the PSD matrix from FDD technique
All available components (a total of 23 channels) are provided as input to the FDD. First, second and third Singular Values (SV) for the selected first time window is shown in Figure 5, which show the participation of the predominant modes for a given frequency.
The case of two close modes is observed around 1.2 Hz. The existence of a single torsional mode is seen around 1.5 Hz, which influences both longitudinal and transverse motion (channels HN2 and HN3) as seen in Figure 4. This technique provides a clearer modal identification and interpretation compared with BFD.
Principal frequency values are identified at the maximum amplitude of the SV of PSD crests. Average values and confidence interval provided by the ten studied time windows are seen in Table 3. Modal shapes extracted using FDD can be seen in Figure 6.
4.3. Random Decrement Technique
RDT is a time domain procedure originally proposed by Cole [9] where structural responses are trans-formed into a RD function, sometimes called randomdec signature. It is based on the concept that the
response of a system to random input loads is composed by the response to an initial displacement, an initial velocity and the random loads. Hence, by averaging time segments with identical initial condi-tions, the random component tends to disappear while the response of the structure is revealed. This provides an estimate of its free-vibration decay, y(τ ), which can be obtained as:
y(τ ) = N X i=1
s (ti+ τ ) (2)
where N is the number of windows with fixed initial conditions, s is the ambient vibration window of duration τ , and ti is the time verifying the initial conditions. Details on the theory can be found in Vandiver et al. [25]. The RDT can be faster than a FFT algorithm [21], which makes it suitable for continuous monitoring of frequencies.
Null displacement and positive velocity triggering conditions are used as proposed by Cole [9]. More than 500 windows, N , are considered for the identification of each mode as recommended by Jeary [14]). A segment length, τ , of 15s is used, being at least 10 times the fundamental period of the building [23], to assure a complete decrement of the signal for modal damping estimation. Signals are pre-processed using a Butterworth passband filter centred in the principal frequencies (previously identified using FDD) with a frequency band length of 10% [18]. Damping is obtained by fitting a logarithmic decrement function e−ξωt; where ξ is the modal damping and ω is the angular frequency (related to the signal frequency by ω = 2πf ). Values of the modal frequencies and damping, as average of the ten studied time windows, can be shown in Table 3 and Table 2, respectively.
4.4. Finite Element Model
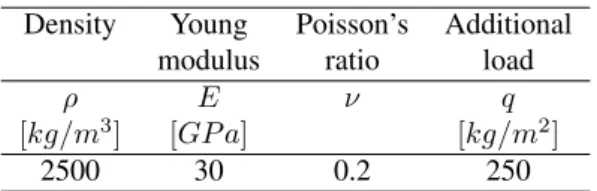
A FE model of the structure is adopted in this research, done using the finite element software Abaqus. The mesh is conformed of both Timoshenko beams [10] and quadrilateral shell element with reduced integration (S4R). Spacing is fine enough to allow convergence to stable natural frequency values. A linear elastic behaviour is assumed for Reinforced Concrete material, appropriate under the assumption of small strains. Material resistance is defined according to design plans. Density and Poisson’s ratio are taken as typical properties for Reinforced Concrete [16]. Adopted values can be found in Table 1.
Table 1: Adopted values of density, Young modulus, Poisson’s ration and non-structural load
Density Young Poisson’s Additional
modulus ratio load
ρ E ν q
[kg/m3] [GP a] [kg/m2]
2500 30 0.2 250
Table 2: Modal damping using RDT Damping Mode RDT [%] 1 0.512 ± 0.093 2 0.424 ± 0.061 3 0.458 ± 0.078
Inclusion of details such as interior walls, floors, and holes in shear resisting walls may significantly influence the rigidity of the structure. Such considerations directly affect the natural frequencies of the model. Consequently, modelling of structural details should require a careful attention.
Simulations consider the cases of both towers behaving as dynamically independent or rigidly connected structures. Results suggest that they may provide mutual constraint to each other (despite the existence of a seismic joint between them). The third natural frequency (corresponding to a torsional mode) obtained supposing structural independence between the two towers do not correspond to the measured value. The whole building is modelled together to reproduce the observed behaviour.
Modal shapes obtained using FEM are shown in Figure 7. Values of the modal frequencies are shown in Table 3.
a) b) c)
Figure 6: 1st (a), 2nd(b) and 3rd (c) modal shapes of the instrumented tower of the building extracted from recordings using FDD
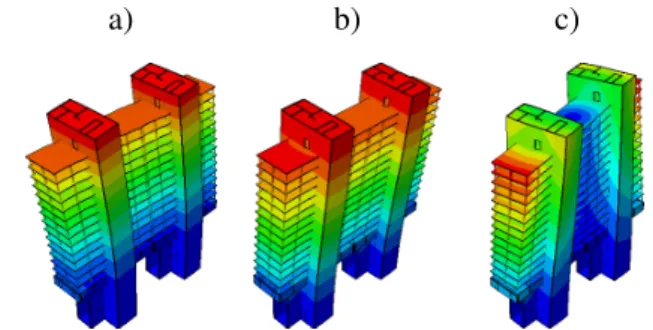
a) b) c)
Figure 7: 1st (a), 2nd(b) and 3rd (c) modal shapes of the building extracted numerically using FEM. Colours show the relative normalized displacement of the nodes.
4.5. Comparison and discussion
The comparison of the first three natural frequencies, obtained numerically and extracted from record-ings trough the applied techniques, can be seen in Table 3. Values provided by OMA techniques agree between each other. Only small deviations have been observed for the different approaches (BFD, FDD, RDT). Highlights of each technique are the simplicity of BFD, the clear interpretation of FDD, and the efficiency and stability of RDT. Combination of different methods is also possible for improvement of results [22]
Table 3: Comparison between experimental (BFD, FDD, RDT) and numerical (FEM) results Frequency Mode BFD FDD RDT FEM [Hz] [Hz] [Hz] [Hz] 1 1.216 ± 0.009 1.218 ± 0.007 1.209 ± 0.002 1.200 2 1.228 ± 0.006 1.224 ± 0.006 1.219 ± 0.002 1.249 3 1.602 ± 0.011 1.604 ± 0.011 1.600 ± 0.003 1.591
The FEM is able to reproduce the observed modes of this high-rise non-regular Reinforced Concrete building. Similitude of the empirical (Figure 6) and numerical (Figure 7) modal shapes corroborate their correct identification. Values of natural frequencies calculated using the FEM have a good agreement with those obtained from the recordings.
5. CONCLUSIONS
OMA techniques are employed to deduce dynamic properties of a tall RC building in Nice, using am-bient vibration recordings. Parameters extracted from three different techniques (BFD, FDD and RDT) show good agreement between each other. The Finite Element model is able to accurately reproduce the observed frequencies and mode shapes of the analysed non-regular building. Influence of existing con-nections between dynamically independent parts of the resisting structure (separated by seismic joints but connected by non-structural elements) is noticed using the FE model. The validation of dynamical properties enables the use of this model for evaluating the response of this building to seismic motions, which is object of further study by the authors.
ACKNOWLEDGMENTS
The first author is grateful for the financial support received from La R´egion Provence - Alpes - Cˆote d’Azur for this research. He also thanks the F´ed´eration W. Doeblin for supporting interlaboratory re-search. He wants to express his gratitude to the researchers of the laboratories G´eoazur, CEREMA, LJAD and ISTerre.
REFERENCES
[1] Atakan, K. (2002). Site Effects Assessment Using Ambient Excitations (SESAME). WP 2: Con-trolled instrumental specifiations. Technical report.
[2] BACHY (1974). Rapport geotechnique: CCTP gros-oevure du CADAM, dossier annexe relatif aux reconnaissances du sol. Technical report.
[3] Bendat, J. S. and Piersol, A. G. (1986). Random data: measurement and analysis procedures. Wiley. [4] Bendat, J. S. and Piersol, A. G. (1993). Engineering applications of correlation and spectral
analy-sis. J. Wiley.
[5] Brincker, R., Ventura, C., and Andersen, P. (2001a). Damping estimation by frequency domain decomposition. IMAC XIX, Kissimmee, USA.
[6] Brincker, R., Zhang, L., and Andersen, P. (2001b). Output-only modal analysis by frequency domain decomposition. In The International Conference on Noise and Vibration Engineering, pages 717–723. [7] CETE (2007). Mesures de bruit de fond dans une s´election d’immeubles `a Nice. Technical report. [8] CETE (2010). Instrumentation du bˆatiment de la pr´efecture des Alpes Maritimes, Nice (06), France.
Technical report.
[9] Cole, H. A. (1973). On-line failure detection and damping measurement of aerospace structures by random decrement signatures.
[10] Davis, R., Henshell, R. D., and Warburton, G. B. (1972). A Timoshenko beam element. Journal of Sound and Vibration, 22(4):475–487.
[11] European Committee for Standardisation (2004). EN 1998-1: Eurocode 8: Design of structures for earthquake resistance – Part 1: General rules, seismic actions and rules for buildings.
[12] Felber, A. J. (1993). Development of a hybrid bridge evaluation system. PhD thesis, University of British Columbia.
[13] Gueguen, P., Langlais, M., Roux, P., Schinkmann, J., and Douste-Bacqu´e, I. (2014). Frequency and Damping Wandering in Existing Buildings Using the Random Decrement Technique.
[14] Jeary, A. P. (1986). Damping in tall buildings—a mechanism and a predictor. Earthquake engi-neering & structural dynamics, 14(5):733–750.
[15] Maia, N. M. M. and Silva, J. M. M. (1997). Theoretical and experimental modal analysis. Research Studies Press Taunton.
[16] Meschke, G., Borst, R. d., Mang, H., and Bicanic, N. (2006). Computational Modelling of Concrete Structures: Proceedings of the EURO-C 2006 Conference, Mayrhofen, Austria, 27-30 March 2006. CRC Press.
[17] Michel, C. (2007). Vuln´erabilit´e Sismique de l’´echelle du bˆatiment `a celle de la ville - Apport des techniques exp´erimentales in situ - Application `a Grenoble. PhD thesis.
[18] Mikael, A., Gueguen, P., Bard, P.-Y., Roux, P., and Langlais, M. (2013). The Analysis of Long-Term Frequency and Damping Wandering in Buildings Using the Random Decrement Technique. Bulletin of the Seismological Society of America, 103(1):236–246. arXiv: 1303.2642.
[19] Peeters, B. and De Roeck, G. (2001). Stochastic system identification for operational modal analy-sis: a review. Journal of Dynamic Systems, Measurement, and Control, 123(4):659–667.
[20] Prevosto, M. (1982). Algorithmes d’identification des caract´eristiques vibratoires de structures m´ecaniques complexes. PhD thesis.
[21] Rodrigues, J. and Brincker, R. (2005). Application of the Random Decrement Technique in Oper-ational Modal Analysis. In Proceedings of the 1st InternOper-ational OperOper-ational Modal Analysis Confer-ence, April 26-27, 2005, Copenhagen, Denmark, pages 191–200. Aalborg Universitet.
[22] Rodrigues, J., Brincker, R., and Andersen, P. (2004). Improvement of frequency domain output-only modal identification from the application of the random decrement technique. In Proc. 23rd Int. Modal Analysis Conference, Deaborn, MI.
[23] Roux, P., Gu´eguen, P., Baillet, L., and Hamze, A. (2014). Structural-change localization and mon-itoring through a perturbation-based inverse problem. The Journal of the Acoustical Society of Amer-ica, 136(5):2586–2597.
[24] Van Overschee, P. and De Moor, B. L. (1996). Subspace identification for linear systems: theory, implementation, applications, volume 3. Kluwer academic publishers Dordrecht.
[25] Vandiver, J. K., Dunwoody, A. B., Campbell, R. B., and Cook, M. F. (1982). A mathematical basis for the random decrement vibration signature analysis technique. Journal of Mechanical Design, 104(2):307–313.
[26] VULNERALP (2007). Evaluation de la VULN´erabilit´e Sismique `a l’´echelle d’une ville de Rhˆone-ALPes – Application `a Grenoble. Technical report.