HAL Id: cea-01802689
https://hal-cea.archives-ouvertes.fr/cea-01802689
Submitted on 19 Mar 2020
HAL is a multi-disciplinary open access
archive for the deposit and dissemination of
sci-entific research documents, whether they are
pub-lished or not. The documents may come from
teaching and research institutions in France or
abroad, or from public or private research centers.
L’archive ouverte pluridisciplinaire HAL, est
destinée au dépôt et à la diffusion de documents
scientifiques de niveau recherche, publiés ou non,
émanant des établissements d’enseignement et de
recherche français ou étrangers, des laboratoires
publics ou privés.
Radioluminescence Dosimetry Technique and Algorithm
for Radiation Therapy With LINACs
Sylvain Magne, Sybelle Deloule, Aimé Ostrowsky, Pierre Ferdinand
To cite this version:
Sylvain Magne, Sybelle Deloule, Aimé Ostrowsky, Pierre Ferdinand. Fiber-Coupled, Time-Gated
Al_2O_3:C Radioluminescence Dosimetry Technique and Algorithm for Radiation Therapy With
LINACs. IEEE Transactions on Nuclear Science, Institute of Electrical and Electronics Engineers,
2013, 60 (4), pp.2998 - 3007. �10.1109/TNS.2013.2263640�. �cea-01802689�
Abstract—An original algorithm for real-time In Vivo Dosimetry (IVD) based on Radioluminescence (RL) of dosimetric-grade Al2O3:C crystals is described and demonstrated in reference conditions with 12-MV photon beams from a Saturne 43 linear accelerator (LINAC), simulating External Beam Radiation Therapy (EBRT) treatments. During the course of irradiation, a portion of electrons is trapped within the Al2O3:C crystal while another portion recombines and generates RL, recorded on-line using an optical fiber. The RL sensitivity is dose-dependent and increases in accordance with the concentration of trapped electrons. Once irradiation is completed, the Al2O3:C crystal is reset by laser light (reusable) and the resultant OSL (Optically Stimulated Luminescence) is also collected back by the remote RL-OSL reader and finally integrated to yield the absorbed dose. During irradiation, scintillation and Cerenkov lights generated within the optical fiber ("stem effect") are removed by a time-discrimination method involving a discriminating unit and a fiber-coupled BGO scintillator placed in the irradiation room, next to the LINAC. The RL signals were then calibrated with respect to reference dose and dose rate data using an ionization chamber (IC). The algorithm relies upon the integral of the RL and provides the accumulated dose (useful to the medical physicist) at any time during irradiation, the dose rate being derived afterwards. It is tested with both step and arbitrary dose rate profiles, manually operated from the LINAC control desk. The doses measured by RL and OSL are both compared to reference doses and deviations are about ±2% and ±1% respectively, thus demonstrating the reliability of the algorithm for arbitrary profiles and wide range of dose rates. Although the calculation was done off-line, it is amenable to real-time processing during irradiation.
Index Terms— Radiation Therapy, In Vivo Dosimetry,
RadioLuminescence, Optically Stimulated Luminescence, Time discrimination, Alumina, Optical Fiber Sensor
This work was done during the INTRADOSE Project supported by the Agence Nationale pour la Recherche (ANR) – Technologies pour la Santé (TECSAN).
S. Magne and P. Ferdinand are with the CEA, LIST, Laboratoire de Mesures Optiques, F-91191 Gif-sur-Yvette, France. (corresponding author: S. Magne, phone: 33.1.69089047; e-mail: sylvain.magne@ cea.fr).
S. Deloule and A. Ostrowsky are with the CEA, LIST, Laboratoire National Henri Becquerel, F-91191 Gif-sur-Yvette, France. (e-mail: sybelle.deloule@cea.fr).
I. INTRODUCTION
ancer treatment by External Beam Radiation Therapy (EBRT) involves pulsed photon or electron beams (energy in the range 4 to 25 MeV) delivered by linear accelerators (LINACs). The objective for the radiation oncologist is to deliver the prescribed dose to the tumor while sparing healthy tissues and organs at risk to avoid undesirable complications. According to IAEA [1], the difference between planned and delivered doses must remain within ± 2 % to ± 3 %. If it exceeds ± 5 %, the treatment should not be initiated and the reasons for discrepancy must be investigated.
Severe accidents in radiation therapy (RT) have been associated with the incorrect use of Treatment-Planning Systems (TPS) or false dose measurement during their commissioning. In vivo Dosimetry (IVD) is an additional safeguard against set-up, dose calculation and transfer errors. It is performed invasively by inserting a suitable dosimeter probe into the patient or non-invasively by placing the dosimeters away (Electronic Portal Imaging Dosimetry - EPID) or onto the skin (point dosimeters) [2]. Since most treatments are fractionated, a deviation in the delivery of the latest dose fraction (e.g. 2 Gy) may be corrected during the next one. For this reason, IVD may be performed with passive dosimeters (mainly thermoluminescent (TLD), RadioPhotoluminescent (RPL) or Optically Stimulated Luminescence (OSL)). However, medical physicists are willing to save time in Quality Assurance (QA) program and in this respect, are looking for real-time (active) dose monitoring. Real-time dose monitoring is also mandatory for some treatments (e.g. Total Body Irradiation (TBI), Total Skin Electron Therapy (TSET)) in order to provide feedback to the physician during the course of the treatment. Since ionization chambers (IC) are usually not used on patients (on account of their size and the use of high voltage), IVD is now often performed with semiconductors (P-N junction type diodes). However, the use of diodes invokes extensive workload due to many additional correction factors (dose rate (source-to-sensor distance), angular incidence, energy etc). Moreover, the coaxial cable disturbs the dose distribution due to presence of metal and the external diameter of diode chains (e.g. 5-diode chains of IBA Dosimetry GmbH (Schwarzenbruck, Germany) or PTW
Fiber-coupled, Time-gated Al
2
O
3
:C
Radioluminescence Dosimetry Technique and
Algorithm for Radiation Therapy with LINACs
Sylvain Magne, Sybelle Deloule, Aimé Ostrowsky, Pierre Ferdinand
(Freiburg, Germany)) is too large (7 mm) to be inserted into urethras or esophagus for an intracavitary use for instance.
IVD is also provided by luminescence dosimetry techniques involving fiber-coupled organic scintillators [3]-[4], doped silica glass [5] or carbon-doped aluminum oxide (Al2O3:C) crystals
[6]-[7]. They are all plagued with light perturbations (so-called “stem effect”) due to Cerenkov and scintillation processes that occur within the light guide [8]. Since this amount of stem light is not controlled, it must be removed from the useful luminescent signal. With optical fibers (refractive index ~ 1.5), the Cerenkov effect occurs for electron energies higher than 180 keV and is therefore ubiquitous in any treatments involving LINACs.
As far as low-frequency pulsed sources are concerned, the time-discrimination (or time-resolved gating) method provides an efficient way to get rid of the stem effect since its decay time is usually less than 1 µs in PMMA and silica fibers [8]. However, this method is difficult to implement with short-lived scintillators (< 10 ns), e.g. plastic scintillators. The Radioluminescence (RL) from Al2O3:C crystals also features a
"fast" component (330 nm, decay time less than 7 ns) associated to F+-center [9] that cannot be distinguished from the stem effect. Fortunately, the dominant RL component of Al2O3:C is a “slow” one (410 nm, decay time ~ 33 ms)
associated to F-centers. Most LINACs used in Medical Physics operate at Pulse Repetition Rates (PRR) in the range [100 Hz - 300 Hz] and each pulse lasts several microseconds. Therefore, the slow RL component of Al2O3:C crystals persists long after
the LINAC pulse and is easily discriminated against stem light. Most time-discrimination demonstrations [5]-[7] involve simple, medium bandpass (MHz) and low-cost transistor-based electronics. They are triggered by the gate synchronization signal of the LINAC, provided early before the pulse is emitted in order to efficiently switch off the perturbation. However, access to the LINAC electronics is rarely allowed in hospitals for safety or conformity reasons. Recently, another discrimination detection scheme made use of a fiber-optic-coupled scintillator that detects ambient scattered radiation [10]-[11] to remove the stem light from the luminescence of a copper-doped fused quartz fiber (RL decay times ~ 52 µs and 104 µs). The RL reader operates in an autonomous way regardless of LINAC electronics thanks to an additional fast detection unit (e.g. photo-multiplier) that provides a gating signal in phase with LINAC pulses.
Dosimetric-grade Al2O3:C crystals provide both active
(real-time) and integrator modes of operation. During irradiation, the radioluminescence (RL) spontaneously emitted by Al2O3:C
crystals may be monitored to provide real-time estimation of the accumulated dose. Al2O3:C crystals usually exhibit higher light
yields than organic scintillators [12] and so small volumes (< mm3) may be used in the purpose of highly spatially
accurate IVD. However, as OSL material, the RL behavior of a Al2O3:C crystal is strongly dependent on trap concentrations
(dosimetric and deep traps) owing to charge transfer and retrapping. This has two important consequences.
First, pristine crystals are usually pre-irradiated before use, in order to fill deep traps. Once filled up, electron occupancy within deep traps reaches a state of equilibrium between the amount of charges brought and released by irradiation (i.e. photoelectric and Compton effects) and those released by light, as recently shown by Damkjaer et al. [13].
Second, the estimation of the dose rate from the luminescent signal is not straightforward as the RL sensitivity of Al2O3:C
crystals is strongly dose-dependent. Indeed, as irradiation advances, the concentration of trapped electrons increases and the RL signal increases accordingly. This dose-dependency is usually considered as a pernicious effect compromising its use as real-time dosimeter. In this work, we show that this may be easily overcome by the use of a convenient algorithm that directly provides the accumulated dose from which the dose rate may be derived afterwards if necessary.
A previous algorithm was proposed by Andersen et al. to correct for sensitivity changes of Al2O3:C [7]. This algorithm
processes iteratively on dose increments D as irradiation advances assuming that the RL sensitivity only depends on dose. Actually, the RL signal depends both on dose and dose rate and so this previous algorithm lacks to take into account the dose rate explicitly. In this paper, we describe an original, integral-based, algorithm in the purpose of retrieving the accumulated dose from the integral of the RL of Al2O3:C
crystals. It is easy to use, performs well under a large range of dose rate values, and processes continuously. It is tested in reference conditions with 12-MV photon beams from a Saturne 43 LINAC, simulating EBRT treatments.
Following the demonstration of Tanyi et al. [10]-[11], we implemented a time-discrimination method involving a logic gate (inserted into the RL-OSL reader) and a dedicated discriminating unit that detects ambient scattered radiation in the irradiation room, next to the LINAC. This configuration enables our RL reader to work in an autonomous way, eliminating the need to access to the LINAC control desk.
II. THEORY
The kinetic model of Pagonis et al. provides theoretical grounds for understanding of the RL behavior in Al2O3:C [14].
In this model, two electron trapping states (dosimetric and deep traps) and two recombination hole centers (radiative and non-radiative) are involved. Dosimetric traps are bleached by light whereas deep traps are not. Pagonis et al. did not take into account shallow traps (i.e. low-energy traps) and also made the assumption that deep traps are empty (i.e. the material was previously annealed at high temperature). Following these authors, we note M1 and M2 as the concentrations of radiative
and non-radiative hole centers respectively (with instantaneous occupancy m1 and m2 and trapping probability coefficients B1
and B2), N1 and N2 the concentrations of dosimetric and deep
traps (with instantaneous occupancy n1 and n2) respectively.
However, our experimental conditions do not match previous assumptions. Since alumina crystals are pre-irradiated before
use, deep traps are filled and consequently the value of n20 is
presumably close to N2 (saturation) while other traps are
considered as nearly empty. Moreover, it is worthwhile noticing that the RL behavior also depends on predose [15]. As a consequence, we consider the following initial conditions instead (at time t = 0): m10 << M1, m20 = 0, n20 ~ N2, n10 = 0.
The RL light arises from recombination of free electrons traveling within the conduction band (CB) onto radiative recombination centers M1 and is given by
c
mmn
A t
RL() 1 1 (1)
where nc is the concentration of electrons within CB released
at the rate of production of electron-hole pairs X (proportional to dose rate) and Am1 is the recombination probability coefficient
on radiative hole centers. Expressions for m1 and nc may be
found in [14].
After simplification (granted initial conditions), one may find that the RL is ruled by the following time-equation
RLt AX BX2t
)
( (2)
where the coefficients A and B are given by
1 1 10 1 N A m A A n m ; s D A B (3)
where An1 is the trapping probability coefficient onto
dosimetric trap N1 and Ds is a specific dose value (in Gray)
that mainly depends on m10 according to
1 1 2 2 10 . 1 . . M B M B m C DS (4)
where C is an experimental dose parameter (J.m3. kg-1).
Eq (2) shows that the experimental behavior of RL in Al2O3:C may be explained by usual rate equations.
Since the electron concentration nc in CB is proportional to
dose rate while the occupancy n1 is proportional to accumulated
dose (prior to saturation), Equation 2 may be rewritten to yield the general form
. () . (). () ) (t Dt Dt Dt RL (5) where ) (t
D is the dose rate, D(t) is the accumulated dose since previous laser reset, (Cts/Gy) and (Cts/Gy2) are
calibration parameters.
Equation (5) may also be written under an integral form as
2 0 ) ( . 2 ) ( . ). ( ) (t RL d Dt Dt I t
(6)This equation is applicable up to a dose of about 7 Gy for the crystals tested (Landauer Inc.). For higher dose, a third-order term is used to account for saturation of the dose response. D(t) is then calculated by solving equation (6), as follows
. 1 1 2. . () ) (t D 2 I t D S (7)
where Ds is a specific dose value, related to calibration
parameters by B A DS (8)
For small values of I(t)/Ds with respect to unity, Equation
(7) reduces to
D(t)I(t)/ (9)
Conversely, for high values of I(t)/DS with respect to unity,
Equation (7) reduces to
D(t) 2I(t)/ (10)
For early irradiation times (D(t) < DS), only the -coefficient
matters while the coefficient takes on for longer times (D(t) > DS).
Once the dose data are calculated by Equation (7), the dose rate data are estimated using Equation (5), to yield
) ( . ) ( ) ( t D t RL t D (11)
The calibration of the RL signal is usually done at constant dose rate D (i.e. step profile). In this case, the equation (5) reduces to t D D t RL() . . . 2 (12)
III. EXPERIMENT
A. Experimental scheme
The RL/OSL sensor used for the demonstration was already used in an earlier study [16]. It consists of a polymer package rigidly fixed onto flexible opaque tubing that protects a small alumina crystal (~ 1 mm3) affixed on the extremity of a silica
optical fiber (SpecTran HCP600, Ø = 0.6 mm) that carries the light from the sensor up to the reader placed in the control room. The Al2O3:C crystals used in this study were purchased from
Landauer Inc. [17]. The sensor was predosed (~ 250 Gy) so as to fill deep traps and to stabilize the dose response.
The scheme of the RL-OSL reader is depicted in fig. 1. It is essentially the same as the one already described in an earlier work [18] except that a logic gate is inserted in-between the amplifier-discriminator (A-D) and the counter. This logic gate is a simple bipolar (NPN) transistor (BC 546) that inhibits the transmission of the pulses exiting the A-D towards the counter when the input gating signal is low and let them through when the input gating signal is high (base-emitter forward-biased).
After each irradiation and RL recording, the sensor is stimulated by laser light (Diode-pumped solid-state DPSS @ 532 nm) to empty dosimetric traps. The OSL produced is recorded on-line (i.e. without disconnecting the sensor) and provides absorbed dose data that are compared to reference dose data provided by the IC. The OSL/FO sensor is then re-used for another irradiation.
Fig 1. Scheme of the RL/OSL reader involving a logic gate enabling time-discrimination of Cerenkov light.
The experimental set up is shown in fig. 2. As proof-of-principle experiment, we used 12-MV photon beams from the Saturne 43 LINAC (GE) of the CEA-LNHB. Photon irradiations were done in reference conditions [1] (source-to-sensor distance = 1 m (including water depth), depth in water = 10 cm, field size = 10 x 10 cm2). A large amount of stem light is
produced due to this large field size (ambient radiation in the room also contributes to a lesser extent).
The LINAC operates at a standard PRR of about 100 Hz at 12 MV and 20 MV and 200 Hz at 6 MV. The LINAC pulse lasts about 4 µs. The duty factor of the LINAC pulse pattern is thus 4.10-4 leading to a peak dose rate about 2500 times more
intense than the average dose rate. Some LINACs can operate up to 317 Hz (e.g. VARIAN Clinac), thus the minimum LINAC pulse period likely to be encountered is 3.15 ms.
The input gating signal serves to trigger the logic gate and to disable the acquisition during the emission of the pulse. A gating signal is already available from the control desk of the LINAC of the CEA-LNHB. In hospitals however, access to the control desk is restricted due to security/conformity reasons. Therefore, following [10]-[11], we developed and tested an independent discriminating unit associated to a fiber-coupled BGO scintillator (Bismuth Germanate, length: 10 mm, surface: 1.5 x 1.5 mm2) placed next to the LINAC (but away from the
patient) as shown in Fig. 3.
Fig 2. Experimental set-up. The RL/OSL sensor is immersed within a water phantom in reference conditions [1]. A fiber-coupled BGO scintillator (placed next to the LINAC) provides light pulses in phase with LINAC pulses. The discriminating unit provides a TTL signal that serves to trigger the logic gate inserted within the RL-OSL reader to wipe out the stem effect.
The ratio of ambient dose rate vs direct dose rate is less than 10-3 (~ mGy/min). The light from the BGO scintillator is
converted by the discriminating unit into a TTL signal, synchronous with the LINAC pulse pattern, eventually sent to the logic gate. BGO was chosen on account of its high density (7.13 g.cm-3) resulting in a small-size detector. The decay time
of the BGO luminescence is about 0.3 µs, lower than the pulse duration of the LINAC (several µs). Its peak wavelength is 480 nm, thus compatible with the multialkali photocathode of the R928 PhotoMultiplier Tube (PMT, Hamamatsu) used in the discriminating unit. The BGO sensor was packaged within a brass cylinder (external diameter: 12 mm, length: 30 mm) that provides electronic equilibrium (thickness ~ 3 mm for a 12-MV photon beam), light tightness and mechanical connection to a fiber-optic cable (3M TECS48, Ø = 1 mm, length = 20 meters).
Fig 3. View of the fiber-coupled scintillator (BGO) for the detection of ambient scattered radiation (left) and associated discriminating unit and logic gate (on top) developed by the CEA LIST (right).
B. Time discrimination of stem effect
The electronic layout of the discriminating unit is depicted in fig. 4.
Fig 4. Electronic layout of the discriminating unit
The light from the BGO scintillator is collected by the fiber and carried in front of the photocathode of the R928 PMT. A high voltage (1 kV) is applied to the PMT in negative polarity (anode earthed, cathode at high negative potential), loaded with 56-Ohm. The PMT provides current amplification up to 106 over a 200-MHz bandwidth (i.e. 5 ns full width at
half-maximum (FWHM)), the pulse voltage is ~ -80 mV. A capacity isolates the measuring circuit from the high voltage and transmits only the pulses (high-pass filter) that are sent into an inverter amplifier (gain = -27.5) based on a high-bandwidth operational amplifier (Intersil EL8201). To avoid noise triggering, the pulses are then low-pass filtered by another capacitor (47 nF) providing a time constant of 4.7 µs. Consequently, only a bunch of pulses is able to build up a useful trigger signal. The other utility of the low-pass filter is to shift in time (by a time delay of about 7 µs) the trigger signal with respect to the LINAC pulse. Indeed, the LINAC pulse pattern may be poorly defined. For instance, the pulse pattern of the Saturne 43 LINAC of the CEA-LNHB features a smaller pre-pulse (occurring several microseconds before the real LINAC pulse) likely to randomly trigger the gate (according to detection threshold). Therefore, the value of the capacitor also has an impact on the reliability of the discrimination process since it must be high enough to ensure that the gate signal does not transit to high value before the LINAC pulse ends. In our case, since the LINAC pulse lasts 4 µs, the logic gate is thus activated 11 µs after the onset of the LINAC pulse, as confirmed from DPO recordings (Digital Phosphor Oscilloscope Tektronix TDS3014B, fig. 5). This time shift has no significant impact on RL detection since the decay time of Al2O3:C is 33 ms.
The resulting signal is then sent through a voltage follower to a comparator (Texas Instruments TLV 3501) whose output is connected to the falling edge triggered input of a monostable multivibrator (Texas Instruments SN 74221). The comparator
output is high whenever the input signal exceeds a threshold voltage set to 90 mV. At the end of the LINAC pulse, the low-pass filtered signal returns to zero, thus triggering the monostable device and setting the logic gate output to high. It is kept high for a time delay of 2.46 ms, adjusted by a RC-circuit (R = 15 kOhm, C = 235 nF), chosen as surface-mounted devices on account of their temperature stability. The duty factor of the discriminating unit is then either 24.6 % at 12 MV/20 MV (100 Hz) or 49.2 % at 6 MV (200 Hz).
Fig 5. DPO monitoring of the LINAC pulse (as detected by the IC located within the LINAC head) and resultant TTL signal (monostable output) provided by the discriminating unit. The rising edge transition logic gate output is shifted in time (7 µs) in order to make sure that no overlap occurs between the LINAC pulse and the optical detection even in case of trigger by undesirable pre-pulses. The DPO acquisition was triggered by the synchronization output of the LINAC control desk (occuring 11 µs earlier to the LINAC pulse).
It is worth noticing that the electronic circuit is powered by unipolar (0-5 V) power supply and operational amplifiers are biased in balanced configuration. Finally, the low-pass filter is a simple passive circuit but active filter circuits could have been used instead.
C. Influence of the discrimination circuit on the RL signal
The RL signal was recorded in similar conditions with gating ("gating ON") and without ("gating "OFF"). The fig. 6 shows the RL signals obtained in both cases.
Fig 6. Influence of the gating circuit on the RL signal (12-MV photon beams, PRR = 104 Hz, duty factor ~ 0.256) for a dose rate of about 200 MU/min. Sampling rate is 10 Hz.
As expected, when gating is on, roughly ¼ of the RL signal is actually recorded on account of the duty factor (0.256 for 12-MV photon beams under a PRR of 104 Hz). The raw time-gated RL signal corrected for duty factor influence (i.e. multiplied by 1/0.256) is found parallel to the RL signal without gating (i.e. with stem effect). The difference between both signals corresponds to a fairly large amount of discriminated stem signal (about 520 cts/0.1 s, i.e. 15 % of the integrated RL at 200 UM/min). It is worth noticing that both slopes are similar (the RL curves are parallel to each other, as expected since the stem effect is proportional to dose rate).
The RL signal shown in fig. 6 is split in two contributions, a constant term proportional to dose rate and another one, function of both dose and dose rate as described by Eq. (5).
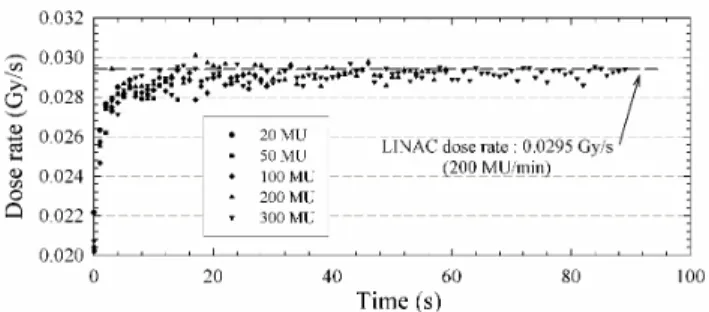
The analysis of the RL signal shows a transient behavior before it reaches permanent state (Fig. 7). It is partly due to the LINAC itself and to electron trapping by shallow traps [19], also visible at the end of the irradiation when the RL signal decays back to zero (fig. 6). From the recording of Cerenkov light from a blank fiber (without crystal), a risetime of ~ 0.3 s (at 90 %) is measured for LINAC emission.
The evolution of the transient signal is tentatively adjusted by the following relation:
D Dt t D t RL() '. ( ' . .).1 exp . (13) where '.D ~ 8000 cts/s, .D ~ 13776 cts/s and .D ~ 19726 cts.Gy-1.s-1 for a dose rate of 0.0295 Gy/s. The timeconstant is ~ 0.8 s.
Although ' is poorly determined, one can see that for time t > 3.~ 2.5 s, equation (13) reduces to (12).
Fig 7. View of transient RL behavior after onset of LINAC irradiation. Several RL signals (obtained for a dose rate of 200 UM/min) are superimposed to improve the statistics. Sampling rate is 10 Hz.
IV. CALIBRATIONS
Reference dose data are usually given in Monitor Units (MU). For the sake of a real-time experiment, the LINAC “scope” output voltage (available from the control desk) was recorded during irradiation with the help of the DPO (Tektronix TDS3014B). The “scope” voltage is proportional
to the dose rate within the LINAC head and was calibrated with respect to dose rate in the water phantom with the help of an ionization chamber (IC NE 2571, C = 23.347 nF, sensitivity = 1.998.10-10 C/MU), placed in similar reference
conditions. The conversion coefficient is 8,859.10-3 Gy/MU
under reference conditions and with 12-MV photon beams. The voltage of the IC is obtained by applying the Coulomb law (V = Q/C). For instance, for a dose of 100 MU (0.8859 Gy), the charge collected is 1.998.10-8 C and its voltage is 0.856 V.
A. Calibration of the LINAC "scope" output
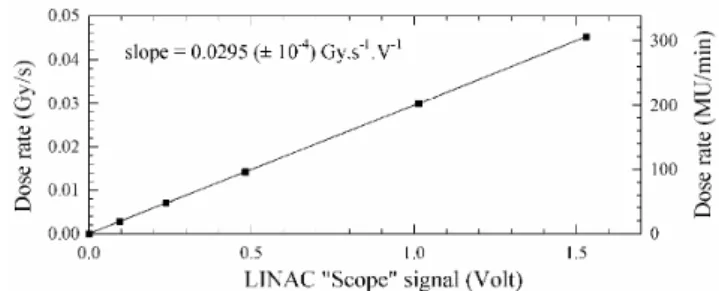
The Saturne 43 LINAC usually operates in feedback mode ("Medical Physicist") at the nominal dose rate of 200 MU/min. This mode is more convenient for delivering a constant dose rate. For the experiment, other dose rates than the nominal one were also experimented and in this case, the LINAC operated without feedback. Typical IC and scope voltages are shown in Fig. 8 for a constant dose rate (200 MU/min). The amplitude of the scope voltage was recorded with respect to dose rate in water in reference conditions and yields the linear relationship shown in Fig. 9.
The calibration coefficient is 0.0295 Gy.s-1.V-1 ± 10-4 in
feedback mode (100 Hz). The scope voltage was adjusted so that a value of 1 V corresponds to a dose rate of 200 MU/min. A slight difference is observed when the LINAC operates without feedback. In this case, a scope value of 1 V corresponds to a dose rate of 0.0307 Gy/s (i.e. 4 % more) due to a slight increase of both PRR (104 Hz instead of 100 Hz) and duty factor (0.256 instead of 0.246).
Once the scope values have been checked with respect to dose rates measured by the IC, the IC was removed from the phantom and only the RL-OSL sensor was immersed in water.
Fig 8. Typical voltages recorded for the IC and LINAC scope output for a dose rate of 200 MU/min.
Fig 9. Calibration of scope value in feedback mode: Dose rate in water (in reference conditions) as a function of scope voltage.
B. Calibration of RL signal with respect to dose rate
The LINAC operated without feedback. The irradiation followed a step profile and the irradiation time was adjusted so as to deliver a constant dose of ~ 2 Gy. The RL signals were recorded for several dose rate values ranging from about 21 MU/min up to 315 MU/min (as displayed in Fig. 10).
As shown in Fig. 11, the constant term grows linearly with dose rate with a coefficient = (478 ± 8)x103 Cts/Gy. As
expected, according to equation 12, the slope exhibits a linear dependence with the square root of the dose rate according to a coefficient ~ 820 ± 10 Cts1/2/Gy, from which we get the
following value for the -coefficient = (672 ± 17)x103 Cts/Gy2.
Finally, the specific dose value DS is ~ 0.71 Gy ± 0.03 Gy for
the Al2O3:C crystals tested.
Fig 10. Calibration of the RL sensor with respect to dose rate (dose is kept constant ~ 2 Gy). The dose rate are estimated from the MU given at the end of irradiation (divided by the irradiation duration) and compared to the scope voltage. The RL signals at 200 MU/min and 300 MU/min are noisier than the 3 others because the sampling rate was 10 Hz instead of 1 Hz.
Fig 11. Calibration of the RL parameters and . The slope interception (constant term) grows linearly with dose rate (left) while the slope increases with the square of the dose rate (right).
C. Calibration of RL signal with respect to dose
The LINAC operated in the "Medical Physicist" mode (with feedback). Similarly, the RL signals were recorded for several doses (by changing the irradiation time), under a constant dose rate (step profile), as displayed in Fig. 12.
This mode of operation provides a double check of the calibration values and . However, one may argue that the integration of the experimental RL signal is not exactly equivalent to the integration of equation (12). Indeed, it is slightly underestimated on account of the transient RL behavior depicted in figure 7, that also happens on falling edge
of the RL at the end of irradiation. However, in the present situation, it is not recorded (as the logic gate is turned to low value), and therefore cannot compensate for the loss of RL signal occurring at the beginning of irradiation.
Fig 12. Evolution of RL signals under a constant dose rate (200 MU/min) but with several irradiation durations (sampling rate: 10 Hz). Note the reproducibility of the RL signals that overlap from one irradiation to another.
Let Ith and Iexp be respectively the integrals of equations (12)
and (13) (from t = 0 to ∞), one can find that Iexp may be
corrected for the influence of shallow traps as follows:
2 2 exp '. (0). . (0) . I D D Ith (14)At the beginning of irradiation, the accumulated dose is close to zero, so that: .D(0)RL(0)
. Taking into account
this assumption, Eq (14) can be written as:
2 2 2 exp . ) 0 ( . ). 0 ( . ' RL RL I Ith (15)
The value for RL(0) is actually recorded several seconds after onset on LINAC emission. Eq (15) accounts well for the observed discrepancy, predominant for short irradiation times. For instance, the signal loss is about 5000 cts (at 200 MU/min), i.e. 0.7 % of the RL integral at 100 MU. Finally, Iexp
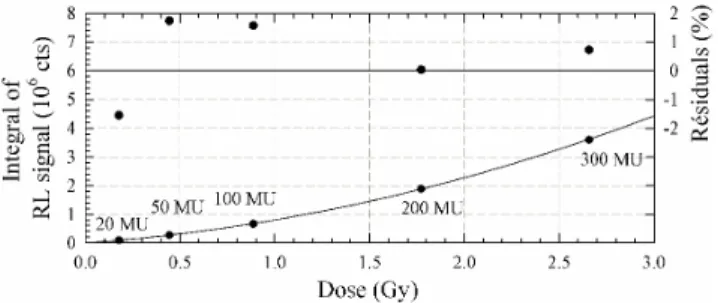
was plotted with respect to dose in Fig. 13.
Fig 13. Evolution of the integral of the RL signal with respect to dose, for a constant dose rate (200 MU/min). The and values are respectively 478x103
Cts/Gy and 668x103 Cts/Gy2. Residuals between experimental and calculated
The experimental data were then adjusted by Equation (6) with the values of and previously determined and corrected for shallow trap influence (eq (15)). The residuals between experimental and theoretical data (using Eq (6)) are plotted on the upper part of the graph. A deviation of ± 2 % is observed between experiment and theory for small dose values as expected due to counting statistics while the deviation is less than ± 1 % for usual dose fractions encountered in EBRT (~ 1 Gy to 2 Gy). This second mode of operation demonstrates the consistency of the algorithm as it performs well in both cases (variable or constant dose rate).
Finally, the ability of the algorithm to predict the dose rate from the RL signal was tested. The RL signals shown in Fig. 13 were corrected for dose-dependency using Equation (11) and the dose rate data retrieved by this method are compared to the expected dose rate value (i.e. 0.0295 Gy/s) on Fig. 14. The uncertainty is about ± 1 % (for 1 s sampling time) and the statistical uncertainty improves as RL signal grows. As expected, the dose rate is slightly underestimated at early stage of irradiation due to electron retrapping by shallow traps. However, this is not detrimental for a medical use since most radiation therapy treatments actually last several minutes or so.
Fig 14. Calculation of the dose rate from the RL data, corrected for dose-dependency using Equation (11) and using the same calibration coefficients as in Fig. 13. Sampling rate is 1 Hz.
D. Calibration of OSL signal with respect to dose
The RL-OSL sensor also provides an OSL dose measurement in addition to both scope and MU values given by the LINAC software. The OSL were also recorded with respect to dose during the same set of experiment in "Medical Physicist" mode (i.e. calibration of RL signal with respect to dose) and shown in Fig. 15. After background subtraction, the OSL signals were integrated and the result is plotted with respect to dose in the inset of Fig. 15.
The dose response of Al2O3:C crystals follows a second-order
polynomial equation according to [16] :
s D OSL D Gy D M M . 2 1 1 . ) ( (16)where OSL is the integrated OSL signal and DM is a
crystal-dependent dose parameter (DM = 13.67 Gy [16]).
In this experiment, the slope s was 5.1x10⁶ cts/Gy and the
uncertainty in OSL dose measurement is typically ± 1 % [18].
Fig 15. Dose calibration of the OSL signal (sampling rate: 1 Hz). Same experiment as Fig. 12.
V. DOSE AND DOSE RATE MONITORING IN ARBITRARY CASE
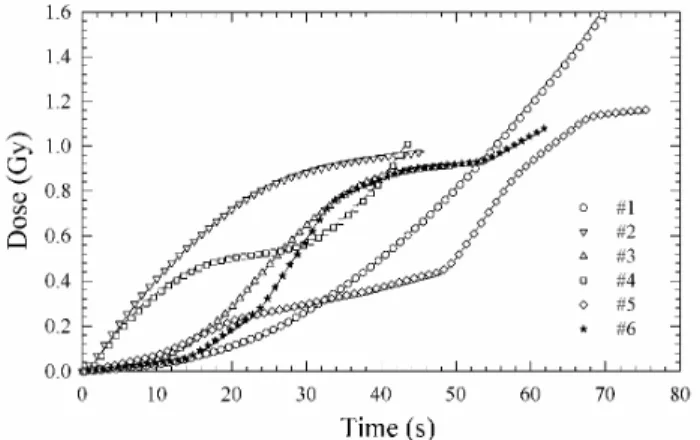
In real medical configuration, dose and dose rates are likely to change depending on treatment configuration, e.g. during Intensity-Modulated Radiation Therapy (IMRT) with Multi-Leaf Collimators (MLC). The algorithm was therefore tested for arbitrary dose rate profiles. A set of 6 experiments was performed as described in Table 1. The LINAC operated without feedback, manually controlled from the control desk (potentiometer). Fig. 16 shows the raw RL signals recorded at sampling rate of 10 Hz. RL signals were then run-averaged at 1-s sampling time and for each profile, dose and dose rate data were calculated using Equations (7) and (11) respectively. Reference dose and dose rate profiles were also calculated from the scope voltage and displayed for comparison. Fig. 17 compares experimental dose profiles vs reference dose profiles and Fig. 18 compares experimental dose rate profiles vs reference dose rate profiles. The absorbed doses measured by RL and OSL were compared to reference dose from MU values and from integrals of scope voltage (Table 1). The uncertainty in MU and scope values are about ± 1% and ± 0.5 % respectively.
N° Profile Reference dose (Gy) Measured dose (Gy) Deviations vs dose MU (%) From MU From scope RL OSL RL OSL #1 1.59 1.58 1.59 1.59 -0.5 -0.1 #2 0.96 0.97 0.97 0.95 1.1 -1.3 #3 0.89 0.91 0.91 0.89 1.5 -0.7 #4 1.01 1.00 1.01 1.01 -0.6 -0.2 #5 1.14 1.15 1.17 1.14 2 -0.3 #6 1.07 1.07 1.08 1.08 0.7 1.2
Tab. 1. Dose rate profiles of six experiments and comparison of absorbed dose data obtained. Data are rounded two digits after point value.
Deviations between total doses (i.e. [doseMU
Fig 16. Raw RL signals recorded with respect to time for each of the 6 irradiation profiles. Sampling rate is 10 Hz (upper graph : #1, #2 and #3, lower graph : #4, #5, #6)
Fig 17. Accumulated dose with respect to time, as calculated from the integral of RL data (Fig. 16) using equation (7), for each of the 6 irradiation profiles (dots). The and values are respectively 478x103 Cts/Gy and 668x103
Cts/Gy2. Also shown is the reference dose calculated from the integral of scope
voltage (continuous lines). Sampling rate is 1 Hz.
Fig 18. Dose rate with respect to time, as calculated from RL data (Fig. 16) using equation (11), for each of the 6 irradiation profiles (dots). Also shown is the reference dose rate calculated from the scope voltage (continuous lines). Sampling rate is 1 Hz.
The relative uncertainties of both RL and OSL dose measurements are respectively about ± 2% and ± 1%. OSL measurements are more accurate than RL measurements. This might be due to the large difference in the integrals. For instance, the OSL integral is about 4.106 cts for 100 MU whereas the RL
integral barely amounts one fourth of this value (~ 0.8.106 cts)
for the same MU value. Therefore, it is no surprise that the expected experimental uncertainty due to counting statistics of RL measurements is less than that of OSL.
VI. CONCLUSION
An original algorithm for IVD accurately dealing with the dose-dependency of the RL of dosimetric-grade alumina crystals (Al2O3:C) is described and tested under constant and arbitrary
dose rate conditions with 12-MV LINAC photon beams, simulating EBRT treatments.
The rate-equation model [14] accounts well for the time-equation of the RL signal and was adapted to our experimental conditions. It involves two calibration parameters ( and ) that rule the luminescence of Al2O3:C, respectively related to
scintillation and dose-dependent part of the RL. The ratio is a specific dose value Ds (~ 0.71 Gy) that is presumably
attributed to initial occupancy of radiative hole centers. Practically, it serves as a criterion distinguishing prominence of each RL contribution (scintillation dominates for D(t) < DS,
while the dose-dependent RL part dominates for D(t) > DS).
This algorithm directly provides the accumulated dose at any time during irradiation from the integral of the RL data (it is worth reminding that the main parameter of interest for the medical physicist is the accumulated dose rather than the dose rate). The dose rate is inferred afterwards from RL data using a dose-dependent coefficient. After irradiation, the Al2O3:C crystal
is reset by laser light and the stimulated OSL is also recorded to provide additional dose data, compared to Monitor Units values. As proof-of-principle experiment, irradiations of a fiber-coupled RL-sensor were performed under reference conditions in a water phantom. The large field size (10 x 10 cm2) produces
a large amount (~ 15 % of the integrated RL at 200 UM/min) of Cerenkov radiation and scintillation in the fiber that superimposes over the useful RL signal (so called "stem effect"). Fortunately, the beam size is smaller in most medical situations, making this configuration conservative. The stem light is removed with the help of a logic gate inserted within the RL-OSL reader, activated by a trigger signal in phase with LINAC pulses. The trigger signal is provided by a dedicated discriminating unit that detects the light from a fiber-coupled BGO scintillator placed next to the LINAC. This configuration enables our RL fiber optic reader to work in an autonomous way, eliminating the need to access to the LINAC control desk often unavailable in hospitals due to safety/conformity reasons. Since a time delay of 7 µs is used (for a LINAC pulse of 4 µs) and at least several microseconds are required for the measurement, the maximum PRR allowed is thus of the order of 10 kHz or so with this setup. It may thus be used for a large
panel of LINACs (especially those used for Medical Physics) except quasi-CW ones.
The algorithm was first calibrated with step irradiation profiles. The RL-sensor was first calibrated with respect to dose rate (the dose being kept constant). Although this calibration is already self-sufficient (providing both and coefficients), a complementary calibration of the RL signal is proposed with respect to dose (at constant dose rate), based on the integral of the RL signal, corrected from shallow trap influence. Both calibration procedures lead to similar results and practically, the correction for shallow trap influence may be neglected since it is often less than measurement uncertainty.
The dose rate may be recovered after dose calculation, and we show that the uncertainty is about ± 1 % (for 1 s sampling rate). It is slightly under-estimated during the first seconds of irradiation due to electron retrapping by shallow traps (time constant ~ 0.8 s at room temperature). However, in practice, this is not detrimental for a medical use since most radiation therapy treatments actually last several minutes or so.
Finally, the algorithm was tested using six different dose rate profiles, manually operated from the LINAC control desk. For each profile, dose and dose rate data were calculated from RL signals using the values and obtained by calibration. Reference dose and dose rate profiles were also calculated from the scope voltage and displayed for comparison. Finally, the absorbed doses measured by RL and OSL were compared to dose calculated from MU values and deviations lies within ± 1% for OSL and within ± 2% for RL.
This work demonstrates the reliability of this integral-based algorithm that performs well for any profile (step or arbitrary) and a wide range of dose rates. Although the calculation was done off-line, it is amenable to a real-time processing during irradiation. For the sake of demonstration, only one sensor was used but this measurement protocol may be extended to a plurality of sensors (e.g. a dosimetric catheter including a chain of Al2O3:C crystals for intracavitary IVD [20]),
connected to a multichannel RL-OSL/FO reader. ACKNOWLEDGMENT
Special thanks to Dominique Chambellan (CEA LIST DISC), Loïc de Carlan, Cindy Le-Bret and Line Sommier (CEA LIST LNHB).
REFERENCES
[1] International Atomic Energy Agency (IAEA), "Absorbed dose determination in external beam radiotherapy: An international code of practice for dosimetry based on standards of absorption dose to water. TRS-398", Vienna, Austria (2000)
[2] B. Mijnheer, "State of the art of in vivo dosimetry". Radiat. Prot. Dosim., vol. 131, pp. 117-122, September 2008
[3] A.S. Beddar, "Water equivalent plastic scintillation detectors in radiation therapy", Radiat. Prot. dosim., vol. 120, pp. 1-6, August 2006 [4] A.M. Frelin, J.M. Fontbonne, G. Ban, J. Colin, M. Labalme, A. Batalla,
A. Isambert, A. Vela, T. Leroux, "Spectral discrimination of Cerenkov radiation in scintillating dosimeters", Med. Phys., vol. 32, pp. 3000-3006, September 2005
[5] B.L. Justus, P. Falkenstein, A.L. Huston, M.C. Plazas, H. Ning, R.W. Miller. "Elimination of Cerenkov interference in a fibre-optic-coupled radiation dosemeter", Radiat. Prot. Dosim., vol. 120, pp. 20-23, May 2006.
[6] M.C. Aznar, C.E. Andersen, L. Botter-Jensen, S.A.J. Bäck, S. Mattsson F. Kjaer-Kristoffersen, J. Medin, "Real-time optical fibre luminescence dosimetry for radiotherapy: physical characteristics and applications in photon beams", Phys. Med. Biol., vol. 49, pp. 1655-1669, April 2004 [7] C.E. Andersen, C.J. Marckmann., M.C. Aznar, L. Botter-Jensen, F.
Kjaer-Kristoffersen, J. Medin, "An algorithm for real-time dosimetry in intensity-modulated radiation therapy using the radioluminescence signal from Al2O3:C", Radiat. Prot. Dosim., vol. 120, pp. 7-13, June
2006
[8] C.J. Marckmann, M.C. Aznar, C.E. Andersen, L. Botter-Jensen, "Influence of the stem effect on RadioLuminescence signals from optical fibre Al2O3:C dosimeters", Radiat. Prot. Dosim., vol. 119, pp.
363-367, June 2006
[9] A. Peto, A. Kelemen. "Radioluminescence properties of -Al2O3 TL
dosemeters", Radiat. Prot. Dosim., vol. 65, pp. 139-142, January 1996 [10] J.A. Tanyi, S.P. Kraft, T. Ushino, A.L. Huston, B.L. Justus.
"Performance characteristics of a gated fiber-optic-coupled dosimeter in high-energy pulsed photon radiation dosimetry", Appl. Rad. Isot., vol. 68, pp. 364-369, February 2010
[11] J.A. Tanyi, K.D. Nitzling, C.J. Lodwick, A.L. Huston, B.L. Justus, "Characterization of a gated fiber-optic-coupled detector for application in clinical electron beam dosimetry", Med. Phys., vol. 38, pp. 961-967, February 2011
[12] A.R. Beierholm, C.E. Andersen, L.R. Lindvold, F. Kjaer-Krisstoffersen, J. Medin, "A comparison of BCF-12 organic scintillators and Al2O3:C
crystals for real-time medical dosimetry", Radiat. Meas., vol. 43, pp. 898-903, February-June 2008
[13] S.M.S Damkjaer, C.E. Andersen, "Memory effects and systematic errors in the RL signal from fiber-coupled Al2O3:C for medical dosimetry".
Radiat. Meas., vol. 45, pp. 671-673, March-July 2010
[14] V. Pagonis, J. Lawless, R. Chen, C.E. Andersen, "Radioluminescence in Al203:C – analytical and numerical simulation results", J. Phys. D:Appl.
Phys., vol. 42, 175107, August 2009
[15] J.M. Edmund, C.E. Andersen, C.J. Marckmann, M.C. Aznar, M.S. Akselrod, L. Botter-Jensen, "CW-OSL measurement protocols using optical fibre Al2O3:C dosemeters", Radiat. Prot. Dosim., vol. 119, pp.
368-374, January 2006
[16] S. Magne, L. de Carlan, J.M. Bordy, A. Isambert, A. Bridier, P. Ferdinand, "Multichannel dosimeter and -Al2O3:C OSL fiber sensors
for use in radiation therapy – Evaluation with photon beams", IEEE Trans. Nucl. Sci., vol. 58, pp. 386-394, April 2011
[17] G. Ranchoux, S. Magne, J.P. Bouvet, P. Ferdinand, "Fibre Remote Optoelectronic gamma dosimetry based on Optically Stimulated Luminescence of Al2O3:C", Radiat. Prot. Dosim., vol. 100, pp.
255-260, October 2002
[18] S. Magne, L. Auger, J.M. Bordy, L. de Carlan, A. Isambert, A. Bridier, P. Ferdinand, J. Barthe, "Multichannel dosemeter and Al2O3:C Optically
Stimulated Luminescence fibre sensors for use in Radiation Therapy: Evaluation with electron beams", Radiat. Prot. Dosim, Vol. 131, pp. 93-99, August 2008
[19] S.M.S Damkjaer, C.E. Andersen, M.C. Aznar, "Improved real-time dosimetry using the radioluminescence signal from Al2O3:C", Radiat.
Meas., vol. 43, pp. 893-897, February-June 2008
[20] E. Spasic, S. Magne, I. Aubineau-Lanièce, L. de Carlan, C. Malet, C. Ginestet, P. Ferdinand, "Intracavitary in vivo dosimetry based on multichannel fiber-coupled radioluminescence and optically stimulated luminescence of Al2O3:C", 2nd International Conference on
Advancements in Nuclear Instrumentation Measurement Methods and their Applications (ANIMMA), Ghent, 6-9 June 2011, DOI: 10.1109/ANIMMA.2011.6172964