HAL Id: hal-02989584
https://hal.archives-ouvertes.fr/hal-02989584
Submitted on 12 Nov 2020
HAL is a multi-disciplinary open access
archive for the deposit and dissemination of
sci-entific research documents, whether they are
pub-lished or not. The documents may come from
teaching and research institutions in France or
abroad, or from public or private research centers.
L’archive ouverte pluridisciplinaire HAL, est
destinée au dépôt et à la diffusion de documents
scientifiques de niveau recherche, publiés ou non,
émanant des établissements d’enseignement et de
recherche français ou étrangers, des laboratoires
publics ou privés.
Non network-former cations in oxide glasses spotted by
Raman scattering
Bernard Hehlen, Daniel Neuville
To cite this version:
Bernard Hehlen, Daniel Neuville. Non network-former cations in oxide glasses spotted by Raman
scattering. Physical Chemistry Chemical Physics, Royal Society of Chemistry, 2020, 22 (22),
pp.12724-12731. �10.1039/d0cp00630k�. �hal-02989584�
Non network-former cations in oxide glasses spotted
by Raman scattering
Bernard Hehlen,∗aand Daniel R. Neuville,b
The depolarized Raman spectra of about 30 binary and ternary aluminosilicate glasses have been collected. Two spectral responses involving the cations are observed below 400 cm−1. One of the two bands arises solely from cations close to non-bridging oxygens. This observation holds for all the glasses investigated providing thereby a simple test for qualifying the polymerization state of oxide glasses. The second feature involves all cations whatever their role in the glass and is found to be twofold: one contribution arises form cations charge compensating AlO−4 tetrahedra and the other one by network modifier cations. These results confirm the net vibrational contrast of cations depending on their structural surrounding. Finally, while alkali atoms vibrate independently from the rest of the network, alkali-earth cations close to non-bridging oxygens drag the latter in their motion.
1
I. Introduction
Raman scattering is very sensitive to structural modifications in materials and provides in principle a powerful tool for probing the atomic structures. In disordered solids however the vibra-tional responses are usually broad, dissymmetric, and sometimes overlapping. In addition, the structural disorder often prevents for a selection rule analysis similar to that developed for crystals and molecules. Glasses suffer from these spectroscopic limitations which considerably limit the spectral analyses. Despite, there ex-ists spectral indicators in Raman which provide valuable infor-mation on local and medium range structure, some being hardly accessible otherwise. In simple oxide glasses, these are for ex-ample the number of threefold and fourfold Si-O-Si rings1–4, the
distribution of SiO(4−n)−4 tetrahedra (so-called Qnspecies)5–7, the
Si-O-Si angle distribution in silicates1,4,8, the amount of BO3
tri-angles and BO4tetrahedra in botates9, among others. Very often
though, relating the Raman data to structural numbers deserves calibration with a third party experiment such as NMR, X-Ray diffraction, or numerical simulations.
Vibrations involving the cations are located at low frequency, below 400 cm−1typically and by now have been studied mostly
a Address, Laboratoire Charles Coulomb (L2C), UMR 5221 CNRS-Université
Montepllier, Montpellier, France; Tel: +33 4 67 14 34 64; email : [email protected]
bAddress, Géomatériaux, IPGP-CNRS, Université de Paris, 1 rue Jussieu, 75005 Paris,
France.
by infrared spetroscopies10–14. Interestingly, there exists very few reports on Raman scattering, althought cations play a cru-cial role in the glass, for example when considering the melt-ing temperature, the diffusion processes, the mechanical prop-erties... From a structural point of vu, the cations (M) depoly-merize the Si-O-Si connected network by creating ionic bonds with alkali and alkaline-earth units, in which the oxygen ions are called non-bridging oxygens (NBO). In aluminosilicates, when Al is in fourfold coordination it acts as a network former by forming AlO−4 tetrahedra covalently connected to the silica network. The cations can therefore be either network modifiers as in the previ-ous case, or charge compensators when they compensate the nega-tive charge carried by the AlO−4 tetrahedra. The balance between these two distinct functions varies as a function of the M/Al ratio and controls many of the physical properties of the glass, such as the viscosity.
In a previous report we show that the depolarized Raman spec-tra of alumino-silicate glasses exhibit two cation bands: a low frequency one around 150 cm−1 hereafter called ω1 and a high
frequency one around 330 cm−1 hereafter referred to as ω2.15
In the two glass families investigated, ω2 involved only cations
at modifier place, while all cations where supposed to contribute to ω1. The atomic displacements underlying these modes are not
yet identified. However, a visual inspection of the vibrations cal-culated using first principle molecular dynamic simulations sug-gests that the latter corresponds to a dangling of the Na atom around the oxygen atom to which it is attached16.
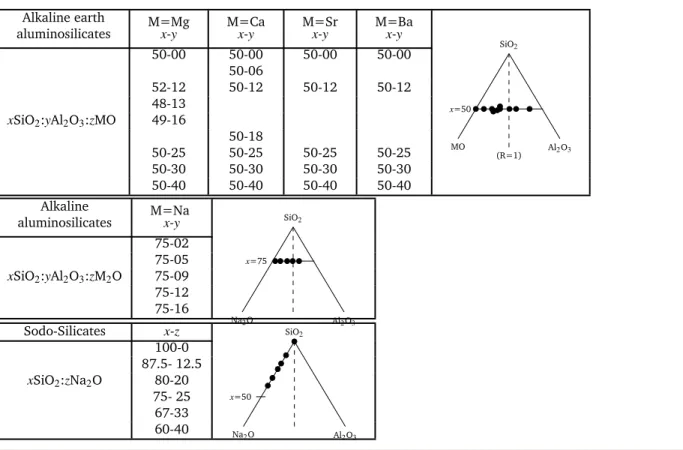
The aim of the present work is to investigate a large set of al-kali and alal-kali earth silicate glasses in order to get more insights into the vibrational motions underlying the cations bands, enabel-ing conclusions which apply over the whole aluminosilicate glass family. To reach this objective, we investigated more than 30 glass compositions, the most prominant series being sets of alcaline-earth aluminosillicates with constant silica content, 50SiO2
-zMO-yAl2O3and M = Mg, Ca, Sr, Ba, with y varying between 0 to 40
in mole %. The ratio R =MO/Al2O3ranges from 0.25 to infinity
and therefore crosses the tectosilicate join at R = 1 (Table 1). The glasses contain both modifier and charge compensator cations for compositions in the paralcaline domain (R > 1), and only charge compensator cations for compositions in the peraluminate region (R < 1), in a simple model assuming all aluminum atoms four-fold coordinated. Sodo-silicates and sodo-aluminosilicates have also been studied to complement these series with alkali-based glasses. The compositions are summarized in Table 1.
Spectroscopic details and sample preparation are shortly de-scribed in section II. The spectroscopy in the binary glasses is presented in section III while ternary systems are discussed in detail in section IV. A special attention has been given to the low frequency cation mode which turned to be twofold in the alumi-nosilates glasses.
2
II. Experimental conditions and sample
preparation
The Raman spectra have been recorded using a single pass HR630 Jobin-Yvon diffractometer. The incident light was delivered by a solid state laser working at 532 nm with a linearly polarized beam focused into the sample with a × 100 microscope objective. The polarization of the light scattered in the backscattering geome-try was analysed by a half plate wave followed by a broad band Glan-Thomson polarizer while the strong elastic line was rejected using two Bragg filters17. To ensure a good reproducibility of the
scattered intensities, the irradiated surface of the samples were all flats and polished to optical quality. Finally all spectra were recorded after each other keeping the same experimental condi-tions.
The samples were obtained by melting mixtures of Na2CO3,
CaCO3, SrCO3, BaCO3, MgO, Al2O3 and SiO2 (Rectapur from
Merck). The mixing was ground for 1 hour under alcohol in an agate mortar, heated slowly to decompose the carbonates, and then heated above the melting point following18. The melts were
maintained for a few hours at high temperature (1900K for alu-minosilicate melt and 1400 K for silicate melt) in air. The sample was quenched in a few seconds from high temperature by dipping the bottom of the platinum crucible into pure water. Peralumi-nous glasses were obtained by melting a ceramic firstly made at high temperature following previous paper19–21 respectively for Ca-, Mg-, and Sr-aluminosilicate glasses). The heating procedure was repeated until no crystallization could be detected by optical
microscope and X-ray diffractometry. All materials were found to be chemically homogeneous glassy phases before and after viscos-ity measurements. Glass sample were analyzed using an electron microprobe analyses, Cameca SX100.
3
III. Binary glasses
3.1 Sodo-silicates: fitting strategy
For sake of data homogeneity, the Raman spectra of the sodosil-icates investigated in15were recorded again using the same
ex-perimental conditions as for all the other glasses studied in this work. The depolarized Raman spectra shown in Figure 1 provides
Fig. 1 Depolarized Raman spectra (IV H) of selected sodosilicate glasses
and pure silica in the region of the cations modes ω1and ω2. The solid
lines result from a fit using a modified lognormal function for the boson peak (see text) and gaussians for the cation modes ω1and ω2(dashed
lines).
examples for describing the fitting procedure. Extracting infor-mation on the cation modes deserves fitting simultaneously the boson peak (BP) and its decay at high frequency. The steep in-crease up to its maximum arises from quasi-local optic vibrations competing with a continuum of acoustic-like excitations. Above the maximum, incoherent scattering from optic modes possibly comes into play giving rise to a sample dependent response.22,23
Whatsoever the origin, there exists no analytical way to describe this complex spectral shape and one therefore has to find accept-able compromises. In our former paper15this signal was mod-eled by an exponential decay in the frequency region surrounding the high frequency cation mode ω2maround 330 cm−1. We now
want to analyse ω1 at low frequency together with ω2. This
re-quires fitting a larger spectral range and hence the boson peak as a whole. The model chosen for fitting the boson peak is composed by a lognormal function accounting for its low frequency part, an exponential decay taking over continuously at frequencies above
Table 1 List of glass samples and location in the ternary phase diagram.
Alkaline earth
aluminosilicates M=Mgx-y M=Cax-y M=Srx-y M=Bax-y
MO SiO2 Al2O3 x=50 (R=1) 50-00 50-00 50-00 50-00 50-06 52-12 50-12 50-12 50-12 48-13
xSiO2:yAl2O3:zMO 49-16
50-18
50-25 50-25 50-25 50-25 50-30 50-30 50-30 50-30 50-40 50-40 50-40 50-40 Alkaline
aluminosilicates M=Nax-y
Na2O SiO2 Al2O3 x=75 75-02 75-05 xSiO2:yAl2O3:zM2O 75-09 75-12 75-16 Sodo-Silicates x-z Na2O SiO2 Al2O3 x=50 100-0 87.5- 12.5 xSiO2:zNa2O 80-20 75- 25 67-33 60-40
its maximum (above ∼150 cm−1 typically), and a cutoff with a gaussian decay shape around 450-500 cm−1. This ”modified
log-normal” function is clearly a rough approximation, but it has the merit of being relatively stable during the fitting procedure, with fitting parameters evolving smoothly and monotoneously from one spectrum to the other, reproducing thereby the evolution of the boson peak. The cation modes ω1and ω2on top of this signal
have been modeled by gaussian functions characterized by their frequency, width, and area. The numerous fitting tests we per-formed reveal that the output parameters of ω2are quite robusts.
The reason is that it stands on a relatively flat background in all glasses. The steep and curved slope on which stands ω1leads to
larger uncertainties, sometimes limiting the spectral analysis.
The superposition of the model (solid line) with the experimen-tal data in sodosilicates (Fig. 1) highlights the good quality of the fits, at least for that glass series. Despite, in pure silica the modi-fied lognormal function is unable to reproduce the bump around 120 cm−1 24. For some glasses this peculiar shape of the BP is an additional drawback limiting the fitting quality. Therefore, we will only present below the trends of the fitting parameters which are not (or weakly) sensitive to the fitting quality of the boson peak “background” signal. The only exception is the area of ω1,
subject to large uncertainty, but whose behavior turns out to be useful for the discussion. It is finally worth noticing here that the
IR response of ω1 is most likely bimodal11,12but still, we fitted
its Raman signature with a single gaussian according to the fact that the proximity of the strong boson peak prevents from a more detailed analysis.
3.2 Alkali earth silicates
ω1 and ω2 are also present in alkali-earth silicates as shown in
the depolarized Raman spectra of the 50SiO2:50MO glasses with
M=Mg, Ca, Sr, and Ba (Figure 2). The responses are intense and can also be observed in experiments performed without polariza-tion analysis. In the latter situapolariza-tion however, the Si-O-Si bending motions (R-band) together with the signal arising from the boson peak drastically confuse the spectral analysis. The arrow in Fig-ure 2a indicates the position of ω2in MgSiO3 extrapolated from
the three other glasses. It shows that ω2is absent (or very weak)
in that glass while very strong in the three other compounds. This observation provides an additional evidence that Mg-based sili-cates behave in a peculiar way as compared to other silisili-cates. For example, they exhibit a highly disordered local structure with a coordination number of ∼ 4 to 4.520,25,26significantly lower than for the other alkaline earth cations, between 6 and 8. These effect correlate with the value of the field strength which is the highest for magnesium, bringing the authors to sometimes position this cation as intermediate between glass modifier and glass former.
Fig. 2 a) Depolarized Raman spectra (IV H) of MSiO3 glasses
(50MO:50SiO2) with M=Mg, Ca, Sr, Ba, and their fits. The arrow
in-dicates the position of ω2 in MgSiO3 extrapolated from the three other
glasses.b) Polarized Raman spectra (IVV): zoom on the Qnbands. For
sake of visibility, the spectra have been translated vertically.
These structural specificities are also captured in the Raman re-sponse of the Qnspecies shown in Figure 2b. The Q2and Q1bands
are rather well defined except in the Mg-based glass where the Qn
feature transforms into a single and very broad structure. This be-havior likely results from a pronounced structural disorder at the Si-NBO sites giving rise to ill-defined Si-NBO stretching motions. Finally, the strong disorder close to the Mg cation also explains the very broad response of ω1in MgSiO3(Fig. 2a) as compared to
other MSiO3glasses.
Fig. 3 Comparison between the dielectric function ε2 measured in IR
(circles) and the response of the two cations bands ω1and ω2extracted
from the Raman spectra (lines, see text for details) ina) CaO:SiO213and
b) Na2O:2SiO210.
Figure 3 compares the Raman signature of the cation modes ω1
and ω2with the IR spectra for the binary compounds CaO:SiO213
(CaSiO3) and Na2O:2SiO210(Na2Si2O3). ω2falls in the deep
be-tween the broad feature ωIR assigned to cation motions12 and
the transverse optic mode TO4 around 480 cm−1corresponding
to the rocking of the Si-O-Si bonds27. ω1has a frequency similar
to that of ωIR suggesting that both responses correspond to the
same type of vibrations. For the reasons mentioned in the pre-ceding section (lack of accuracy owing to the strong boson peak nearby), we prefered to fit ωIRwith one single gaussian although
the IR data clearly show a structured spectral shape du to differ-ent cation environmdiffer-ents motivating fitting procedures using two gaussians12.
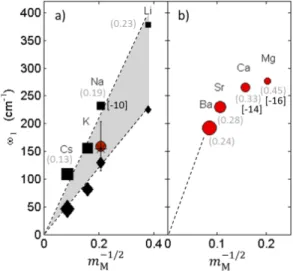
For a harmonic oscillator involving n atoms, like e.g. a molecule, the eigenfrequencies are given by ω0=
p
kc/µ where
kcis the caracteristic spring constant and µ the reduce mass of
the eigenmode under consideration. The frequency of the two IR components building the infrared response ωIRis reproduced in
Figure 4. It exhibits a linear behavior when plotted as a function ofp1/mM, where mMis the mass of the cation12. Since µ = mM,
this lead the authors to conclude that the modes building ωIR
in-volve solely the cations, i.e. in a motion almost independent from their anionic surrounding.
Fig. 4 Frequency of ω1 in Raman and ωIRin Infrared plotted as
func-tion ofp1/mM. The size of the symbols refers to the atomic radii of the
cationsa) Alkaline-silicates: The circle is our work, the filled squares and
filled losanges correspond to the two-component description of the IR response ωIR12, and the star is reproduced from10.b) Alkaline-earth
sil-icates (our work). The numbers in parentheses are the field strengths28
and those in braquets are log10(D)where D are the diffusion coefficients compiled from?.
Lets now consider the case of alkaline-earth silicates (Fig-ure 4b). The frequency ω1 now deviates from the linear
behav-ior and the effect becomes more pronounced for lighter cations. This different behavior between alkali and alkali earth ions goes along with the increase of the atomic field strengths which are
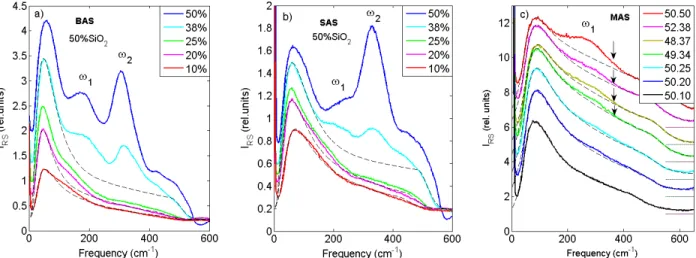
Fig. 5 Depolarized Raman spectra (IV H) of aluminosilictes, xSiO2:yAl2O3:zMO.a) M=Ba, with x=50% and z in the legend, b) M=Sr, with x=50% and z
in the legend,c) M=Mg, with the legend in the format x.z. Examples of fitted boson peaks are shown to give an idea of the spectral shapes underneath
ω1and ω2(dashed lines). The spectra in Mg-based glasses have been translated-up for sake of clarity. The baselines are given by the horizontal lines
on the right. The arrows indicate the expected positon of ω2in MAS.
higher for the former. Indeed, when the electrostatic interaction increases, the cation become more and more bonded to the oxy-gens nearby and drag them along in its motion. The mass of the vibrating structure increases and hence mMshould be replaced by
µ .
When considering mM instead, the curve ω = f (p1/mM)
artificially bends down, exactly as ω1 does in Figure 4b. The
increasing network connectivity for light atoms goes along with a decrease of the cation diffusivity D, revealing in addition the close link between mode frequency, field strength, and diffusivity. This analysis captures the overall motions of the cations : two main vibrations in their cage, ω1 and ω2, and the relaxations at
high temperature, i.e diffusion processes characterized by the diffusion coefficient D.
4
IV. Aluminosilicates
The depolarized Raman spectra of the ternary aluminosilicates se-ries xSiO2:yAl2O3:zMO with M=Ba, Sr, Mg, are shown in Figure
5. The spectra of calcium glasses are displayed in Figure 4b of Ref.15. Surprisingly, the appearance of an additional structural surrounding for the cations in the ternary systems does not trans-late into additional Raman bands. However, a direct inspection shows that ω1is present down to the lowest cation concentration
suggesting that the band now gather the motions of both network modifier and charge compensator cations. One also observes that ω2 vanishes around z = 25, that is at the joint R = 1 (Ba and Sr
glasses) confirming previous anticipations that this band arises solely from cations close to non-bridging oxygens. Similarly to the binary MgO:SiO2 system, ω2 is still absent (or very weak)
in all of the MgO-aluminosilicates investigated. For this set of glasses the silica content is close but not always equal to 50% and the spectra are displayed by decreasing concentration of MgO to highlight the concomitant intensity decrease of ω1.
4.1 Low-frequency cation mode ω1
Figure 6a gather the fitted integrated intensities of ω1in the
alu-minosilicates and sodosilicates series. In calcium glasses ω1 is
embedded under the strong ω2 band and the fitting parameters
could not been exploited (see Fig. 2a). For the other glasses, the relatively large dispersion of the points arises from the fit-ting limitations mentioned in section III. Despite, when scaling all the intensities on the same value at z = 25 (R = 1) one clearly observes a change in the slope between peraluminate and paral-caline domains. The effect is more pronounced for heavy cations and likely accounts for a change in the Raman efficiency when network modifiers (R > 1) or charge compensators (R < 1) are in-volved.
This and the step increase of the frequency of ω1 around R = 1
shown in Figure 6b suggests a doublet structure of the Raman response : when all cations are charge compensators ([z] < 25, neglecting AlV or AlV I structures) the frequency ω
1 (≡ ω1c) is
fairly constant and has a different value than ω1(≡ ω1m) for the
binary glasses for which all cations are network modifiers ([z] =50). In between, the glasses have both network modifier and charge compensator cations, and the Raman response likely be-comes twofold, i.e. ω1= ω1c+ ω1m. Unfortunately, the
spec-troscopy is unable to separate the two contributions, leading to an apparent up-shift (or down-shift in Mg-based glasses) of the frequency when cation oxide is replaced by aluminum oxide. This
Fig. 6a) Integrated intensity of ω1as a function of the cation content [z]. The data have been scaled to coincide at concentration z = 25 (R = 1).b) and
c) Frequency of the cations modes ω1and ω2as a function of [z], respectively.
is however well correlated with the23Na NMR observed between
sodium silicate and aluminosilicate glasses30where a NMR
chem-ical shift is observed between charge compensator and network modifier cations, and also with XANES results at the Ca K-edge of CaO-SiO2 and 25CaO-25Al2O3-50SiO2 glasses, where a shift in
the XANES pre-edge is observed as a function of the cation site31.
Fig. 7 Frequency of ω1 as a function of p1/mM in the
aluminosili-cate glasses. Red filled circles: binary glasses MOSiO3([z]=0); green
diamonds: paralkaline glasses ([z]=12%); blue squares: peraluminate glasses, ([z]=25%, 20% and 10%, from dark blue to light blue). In the latter the frequency is similar for the three [z] values and the points su-perpose. Lines are guide to the eye.
In an attempt to confirm the above assumption we gather in
Figure 7 the curves ω1(M) as a function of p1/mM for cations
concentrations [z]=10, 20, 25, 38, and 50mol%. The filled cir-cles correspond to the binary silicates, [z]=50 mol%, the empty losanges correspond to aluminosilicates with [z]=38 mol% (per-alkaline domain), and the squares to aluminosilicates with [z]= 25, 20 and 10mol% (peraluminate domain). One observes two distinct behaviors. For a predominance of network modifier cations in the glass (peralkaline domain), cation motion couples with the oxygen atoms nearby leading to the observed bending of the frequency dependence of ω1, as explained in the preceding
section. The situation is very different for glasses in the peralu-minate domain. In that case, there is only one possible site for the cations, i.e. charge compensators, and the three data sets merge in a single straight line meaning that the motion of those cations is now decoupled from the rest of the network. Indeed, the negative charge carried out by the AlO−4 to which the cation is attached is delocalized leading to a loose directional bonding. Keeping in mind that ω1likely results from a dangling motion of
the cations, this and the large mass difference between cations and tetrahedra can produce the observed ”vibrational decoupling effect”. However, although directionally loose, the bonding of the cation to its AlO−4 tetrahedra should remain strong along the radial axis, as indicated by the weaker value of the diffusion co-efficient of charge-compensator cations as compared to network modifiers ones. This result is in line with the IR data of alkaline-earth borate glasses32where the authors also found a linear
be-havior in a plot of ωIR versusp1/mM. For the studied
concen-tration (0.45MO:0.55B2O3) most of the cations compensate BO−4
tetrahedra33which corresponds to a situation similar to the
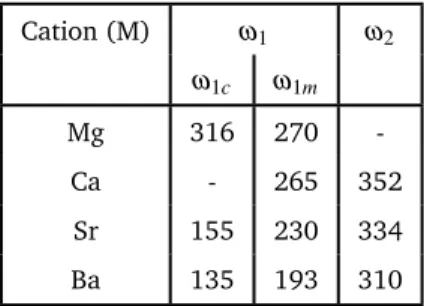
pera-luminate domain in alumino silicates. Finally, Table 2 summarizes the values for these three sets of frequencies, i.e. ω1c, ω1m, and
ω2.
Table 2 Frequency of the two cation modes ω1and ω2in alkaline-earth
aluminosilicates (in cm−1): contribution of charge compensator cations ω1cand network modifier cations ω1mto the low frequency response ω1,
and high frequency response ω2originating solely from modifier cations
and taken at [z]=50. Cation (M) ω1 ω2 ω1c ω1m Mg 316 270 -Ca - 265 352 Sr 155 230 334 Ba 135 193 310
4.2 High frequency cation mode ω2
Let’s now consider the high frequency mode ω2. Its frequency
and integrated intensity are presented as a function of the cation content in Fig. 6c and 8a, respectively. The latter compiles the data obtained in alkaline-earth aluminosilicates, sodo aluminosil-icates, and sodo-silicates glasses. These families define three sets of data highlighted by blue (triangles), pink (filled circles), and yellow (empty circles) background colors. Within the alkaline-earth group (triangles), the intensity of the three glass family has been assigned a multiplication factor and as a consequence, all curves superpose.
As expected, the intensities decrease to zero close to the joint R= 1 in all of the ternary glasses. Considering only foufold-coordinated [Al]IV atoms in the glasses, this value is reached for
z= 12.5in the sodium aluminosilicate, and z = 25 in the alkali earth glasses (arrows in Fig. 8a). By multiplying all the sets by a constant accounting for the cation scattering efficiency, all the curves overlapp into a single one, at least when plotted as a function of [z]mod, the molar fraction of modifier cations (Fig.
8b). Within our structural approximation, each couple of AlO−4 tetrahedra is charge compensated by one alkali earth atom, and the latter reads [z]mod= (z − y)/atm, where atm is the number of
atoms per mole. When [z]modbecomes low, i.e. when the
concen-tration of alumina increases up to the peraluminate region, the intensity of ω2 reaches zero before the joint R = 1 ([z]mod= 0)
in the alkaline-earth glasses, a behavior also visible in Figure 8a. This observation goes along with an increase of [Al]V and [Al]V I
environments. Compensating these structures requires additional cations which hence are lost as network modifiers, leading to a faster decrease of the intensity of the mode as compared to the linear regime extrapolated from high [z]mod values (dashed line
in Figure 8b). However, the effect is rather weak and the experi-mental errorbars prevent for a comparative analysis between Ca, Sr, and Ba.
5
Conclusion
The Raman spectra of alkaline and alkaline-earth aluminosilicates exhibit two spectral responses involving cation motions. The first one at low frequency, typically around 150 cm−1 (ω
1), is likely
twofold though not resolved by our experiment. One compo-nent (ω1c) arises from cations compensating the negative charge
carried by the AlO4 tetrahedra. Those cations vibrate
indepen-dently to the heavy structure to whom they are attached. This decoupling is further amplified by the loose and delocalised elec-trostatic bonding. The second component (ω1m) involves cations
at modifier’s place, that is attached to non-bridging oxygens. In alkaline-earth alumino silicate glasses the cations drag the NBOs nearby in a coupled motion, a situation different than for alkali cations where the vibration is defined solely by the motion of the cation. A likely explanation is the difference of strength fields which are significantly higher for alkali earth cations. The second cation band appears around 330 cm−1(ω
2). In aluminosilicates
the analysis shows that whatever the cation type, only those at modifier’s place contribute to that vibrational response. Overall, these results point-out a clear vibrational contrast between the cations attached to NBOs and those close to AlO4tetrahedra. The
presence or not of ω2 in a Raman spectra also provides a
sim-ple test for qualifying the polymerization state of a glass. Since responses at similar frequencies appear in the Raman spectra of borate and borosilicate glasses these conclusions likely hold also in these systems.
Fig. 8 Integrated intensity of ω2a) as a function of the total cation content [z] and b) as a function of the modifier cation content [z]mod. The arrows
indicate the join R = 1.
Notes and references
1 F.L. Galeener and J.C. Mikkelsen Jr, Vibrational dynamics in
18O-substituted vitreous SiO
2. Phys. Rev. B, 1981, 23,
5527-5530.
2 F.L. Galeener, Planar rings in glasses Solid State Commun., 1982,44, 1037-1040.
3 A. Pasquarello and R. Car, Identification of Raman defect lines as signatures of ring structures in vitreous silica Phys. Rev. Lett., 1998,80, 5145-5147.
4 B. Hehlen, Inter-tetrahedra bond angle of permanently densi-fied silicas extracted from their Raman spectra. J. Phys.: Con-dens. Matter, 2010,22, 025401.
5 P.F. McMillan, Structural studies of silicate glasses and melts-applications and limitations of Raman spectroscopy. Am. Min-eral., 1984,69, 622-644.
6 B.O. Mysen and J.D. Frantz, Structure and properties of al-kali silicate melts at magmatic temperatures. Eur. J. Mineral., 1993,5, 393-407.
7 B.O. Mysen, Experimental, in situ, high-temperature studies of properties and structure of silicate melts relevant to mag-matic processes. Eur. J. Mineral., 1995,7, 745-766.
8 B. Hehlen, D.R. Neuville, D. Kilymis and S. Ispas, Bimodal distribution of Si–O–Si angles in sodo-silicate glasses J. Non-Cryst. Solids, 2017,469, 39-44.
9 F. Angeli, O. Villain, S. Schuller, T. Charpentier, D. De Ligny, L. Bressel and L. Wondraczek, Effect of temperature and thermal history on borosilicate glass structure. Phys. Rev. B, 2012,85,
054110.
10 C.I. Merzbacher and W.B. White, Structure of Na in alumi-nosilicate glasses: A far-infrared reflectances spectroscopics
study. Am. Mineral., 1988,73, 1089.
11 E.I. Kamitsos, A.P. Patsis and G.D. Chryssikos, Infrared re-flectance investigation of alkali diborate glasses. J. Non-Cryst. Solids, 1993,152, 246.
12 E.I. Kamitsos and G.D. Chryssikos, Alkali sites in glass. Solid State Ionics, 1998,105, 75-85.
13 D. De Sousa Meneses, M. Malki and P. Echegut, Optical and structural properties of calcium silicate glasses. J. Non-Cryst. Solids, 2006,352, 5301.
14 D. De Sousa Meneses, M. Eckes, L. Del Campo, C.N. Santos, Y. Vaills and P. Echegut, Investigation of medium range order in silicate glasses by infrared spectroscopy. Vib. Spectrosc., 2013,
65, 50.
15 B. Hehlen and D.R. Neuville, Raman response of network modifier cations in alumino-silicate glasses. J. Phys. Chem. B, 2015,119, 4093-4098.
16 D. Kilymis, S. Ispas, B. Hehlen, S. Peuget and J.-M. Delaye, Vi-brational properties of sodosilicate glasses from first-principle calculations Phys. Rev. B, 2019,99, 054209.
17 OptiGrate Corp.: http://www.optigrate.com.
18 D.R. Neuville, Viscosity, structure and mixing in (Ca, Na) sili-cate melts. Chem. Geol., 2006,229, 28-42.
19 D.R. Neuville, L. Cormier and D. Massiot, Al speciation in calcium aluminosilicate glasses: A NMR and Raman spectro-cospie. Chem Geol., 2006,229, 173-185.
20 D.R. Neuville, L. Cormier, V. Montouillout, P. Florian, F. Mil-lot, J.-C. Rifflet and D. Massiot, Structure of Mg and Mg/Ca aluminosilicate glasses: 27Al NMR and Raman spectroscopy
investigations. Am. Mineral., 2008,93, 1721-1731.
21 A. Novikov, D.R. Neuville, L. Hennet, D. Thiaudière, Y. Gueguen and P. Florian, Al and Sr environment in
tectosili-cate glasses and melts: viscosity, Raman and NMR investiga-tion. Chemical Geology, 2017,461, 115-127.
22 H. Mizuno, H. Shiba and A. Ikeda, Continuum limit of the vibrational properties of amorphous solids, Proc. Natl, Acad. Sci., 2017,114, 055902.
23 Y.M. Beltukov, C. Fusco, D.A. Parshin and A. Tanguy, Boson peak and Ioffe-Regel criterion in amorphous silicon-like ma-terials: effect of bond directionality, Phys. Rev. E, 2016, 93,
023006.
24 C. Weigel, M. Foret, B. Hehlen, M. Kint, S. Clément, A. Po-lian, R. Vacher and B. Rufflé, Polarized raman spectroscopy of v-SiO2under rare-gas compression. Phys. Rev. B, 2016,93,
224303.
25 S. Sen, H. Maekawa and G.N. Papatheodorou, Short-range structure of invert glasses along the pseudo-binary join MgSiO3-Mg2SiO4: results from29Si and25Mg MAS NMR
spec-troscopy. J. Phys. Chem. B, 2009,113, 15243-15248.
26 L. Cormier and G.J. Cuello, Mg coordination in a MgSiO3glass
using neutron diffraction coupled with isotopic substitution. Phys. Rev. B, 2011,83, 224204.
27 C.T. Kirk, Quantitative analysis of the effect of disorder-induced mode coupling on infrared absorption in silica. Phys. Rev. B, 1988,38, 1255.
28 A.H. Dietzel, On the so-called mixed alkali effect. Phys. chem. Glas. Phys. Chem. Glas., 1983,23, 172-180.
29 V. Magnien, D.R. Neuville, L. Cormier, J. Roux, J.-L. Haze-mann, D. de Ligny, S. Pascarelli, I. Vickridge, O. Pinet P. and Richet, Kinetics and mechanisms of iron redox reactions in silicate melts: The eects of temperature and alkali cations. Geochim. Cosmochim. Acta, 2008,72, 2157-2168.
30 C. Le Losq, D.R. Neuville, P. Florian, G.S. Henderson and D. Massiot, The role of Al3+ on rheology and structural
changes in sodium silicate and aluminosilicate glasses and melts. Geochimica et Cosmochimica Acta, 2014,126, 495-517.
31 M.R. Cicconi, D. de Ligny, T.M. Gallo and D.R. Neuville, Ca Neighbors from XANES spectroscopy: a tool to investigate structure, redox and nucleation processes in silicate glasses, melts and crystals. American Mineralogist, 2016, 101,
1232-1236.
32 Y.D. Yiannopoulos, G.D. Chryssikos and E.I. Kamitsos, Struc-ture and properties of alkaline earth borate glasses. Phys. Chem. Glasses, 2001,42, 164-72.
33 W.J. Dell, P.J. Bray and S.Z. Xiao,11B NMR studies and
struc-tural modeling of Na20-B2O3-SiO2 glasses of high soda

![Fig. 6 a) Integrated intensity of ω 1 as a function of the cation content [z]. The data have been scaled to coincide at concentration z = 25 (R = 1)](https://thumb-eu.123doks.com/thumbv2/123doknet/14739196.575723/7.918.72.661.169.441/integrated-intensity-function-cation-content-scaled-coincide-concentration.webp)
![Fig. 8 Integrated intensity of ω 2 a) as a function of the total cation content [z] and b) as a function of the modifier cation content [z] mod](https://thumb-eu.123doks.com/thumbv2/123doknet/14739196.575723/9.918.172.755.154.428/integrated-intensity-function-cation-content-function-modifier-content.webp)
