HAL Id: hal-00706233
https://hal.archives-ouvertes.fr/hal-00706233
Submitted on 16 Jun 2017
HAL is a multi-disciplinary open access
archive for the deposit and dissemination of
sci-entific research documents, whether they are
pub-lished or not. The documents may come from
teaching and research institutions in France or
abroad, or from public or private research centers.
L’archive ouverte pluridisciplinaire HAL, est
destinée au dépôt et à la diffusion de documents
scientifiques de niveau recherche, publiés ou non,
émanant des établissements d’enseignement et de
recherche français ou étrangers, des laboratoires
publics ou privés.
using FTIR data from NDACC
T. Kerzenmacher, B. Dils, N. Kumps, T. Blumenstock, Cathy Clerbaux, P.-F.
Coheur, P. Demoulin, O. García, Maya George, D. W. T. Griffith, et al.
To cite this version:
T. Kerzenmacher, B. Dils, N. Kumps, T. Blumenstock, Cathy Clerbaux, et al.. Validation of IASI
FORLI carbon monoxide retrievals using FTIR data from NDACC. Atmospheric Measurement
Tech-niques, European Geosciences Union, 2012, 5 (11), pp.2751-2761. �10.5194/amt-5-2751-2012�.
�hal-00706233�
doi:10.5194/amt-5-2751-2012
© Author(s) 2012. CC Attribution 3.0 License.
Measurement
Techniques
Validation of IASI FORLI carbon monoxide
retrievals using FTIR data from NDACC
T. Kerzenmacher1, B. Dils1, N. Kumps1, T. Blumenstock2, C. Clerbaux3,4, P.-F. Coheur3, P. Demoulin5, O. Garc´ıa6, M. George4, D. W. T. Griffith7, F. Hase2, J. Hadji-Lazaro4, D. Hurtmans3, N. Jones7, E. Mahieu5, J. Notholt8, C. Paton-Walsh7, U. Raffalski2, T. Ridder8, M. Schneider2, C. Servais5, and M. De Mazi`ere1
1Belgisch Instituut voor Ruimte-A¨eronomie – Institut d’A´eronomie Spatiale de Belgique (IASB–BIRA), Brussels, Belgium 2Institut f¨ur Meteorologie und Klimaforschung – Atmosph¨arische Spurengase und Fernerkundung (IMK–ASF),
Karlsruhe Institute of Technology, Karlsruhe, Germany
3Spectroscopie de l’Atmosph`ere, Chimie Quantique et Photophysique, Universit´e Libre de Bruxelles (ULB),
Brussels, Belgium
4UPMC Universit´e Paris 06, Universit´e Versailles St-Quentin, CNRS/INSU, UMR8190, LATMOS-IPSL, Paris, France 5Institute of Astrophysics and Geophysics, University of Li`ege, Li`ege, Belgium
6Iza˜na Atmospheric Research Centre (IARC), Agencia Estatal de Meteorolog´ıa (AEMET), Iza˜na, Spain 7School of Chemistry, University of Wollongong, Wollongong, Australia
8Institute of Environmental Physics, University of Bremen, Bremen, Germany Correspondence to: T. Kerzenmacher ([email protected])
Received: 6 April 2012 – Published in Atmos. Meas. Tech. Discuss.: 2 June 2012 Revised: 25 October 2012 – Accepted: 29 October 2012 – Published: 16 November 2012
Abstract. Carbon monoxide (CO) is retrieved daily and
globally from space-borne IASI radiance spectra using the Fast Optimal Retrievals on Layers for IASI (FORLI) soft-ware developed at the Universit´e Libre de Bruxelles (ULB). The IASI CO total column product for 2008 from the most recent FORLI retrieval version (20100815) is evaluated us-ing correlative CO profile products retrieved from ground-based solar absorption Fourier transform infrared (FTIR) ob-servations at the following FTIR spectrometer sites from the Network for the Detection of Atmospheric Composition Change (NDACC): Ny- ˚Alesund, Kiruna, Bremen, Jungfrau-joch, Iza˜na and Wollongong. In order to have good statis-tics for the comparisons, we included all IASI data from the same day, within a 100 km radius around the ground-based stations. The individual ground-based data were adjusted to the lowest altitude of the co-located IASI CO profiles. To ac-count for the different vertical resolutions and sensitivities of the ground-based and satellite measurements, the averaging kernels associated with the various retrieved products have been used to properly smooth coincident data products. It has been found that the IASI CO total column products compare
well on average with the co-located ground-based FTIR to-tal columns at the selected NDACC sites and that there is no significant bias for the mean values at all stations.
1 Introduction
The main sources for CO in the atmosphere are incom-plete combustion of biomass and fossil fuel, and oxidation of methane (CH4) and non-methane hydrocarbons.
Vegeta-tion and ocean contribuVegeta-tions are less important. The total production is about 1230–3000 Tg of CO per year. CH4
ox-idation produces 400–800 Tg of CO per year, and oxox-idation of other hydrocarbons in the troposphere contributes a sim-ilar quantity of CO. The main sinks of CO are chemical loss by OH generating carbon dioxide (CO2), uptake by soil
and removal in the stratosphere which amounts to a total of about 1600–3700 Tg CO yr−1(more details can be found in Brasseur and Solomon, 2005). CO has a lifetime of sev-eral weeks in the troposphere and is therefore often used as a tracer for pollution (Turquety et al., 2008).
Space-borne missions currently providing CO abundances from nadir infrared radiance measurements are the follow-ing: Measurements Of Pollution In The Troposphere (MO-PITT) on Terra using a correlation radiometer (Drummond et al., 1995; Deeter et al., 2003; Fortems-Cheiney et al., 2011); Atmospheric Infrared Sounder (AIRS) on Aqua us-ing a spectrometer (Aumann et al., 2003; McMillan et al., 2005, 2011); Tropospheric Emission Spectrometer (TES) on Aura using a Fourier transform spectrometer (FTS) (Beer et al., 2001; Rinsland et al., 2006); and Infrared Atmospheric Sounding Interferometer (IASI) on MetOp-A (Hilton et al., 2012; Clerbaux et al., 2009; George et al., 2009; Maddy et al., 2009). All these instruments measure in a sun-synchronous orbit.
Previous evaluations of IASI FORLI-CO retrievals have been performed using other satellite or aircraft data. George et al. (2009) have provided a first evaluation of IASI FORLI-CO distributions by comparison with MOPITT, AIRS and TES CO retrievals. They found that on a global scale 0.8 to 2.4 independent pieces of information are available in the IASI FORLI-CO retrievals (version 20081030). Com-parisons between the CO columns of the different instru-ments show average discrepancies of about 7 % in the North-ern Hemisphere and the equatorial region and of about 11 % south of 15◦S. In case of strong CO concentrations (e.g. for-est fires), the discrepancies can be as high as 17 % with IASI being larger.
Turquety et al. (2009) evaluate the quality of IASI FORLI-CO retrievals for highly polluted conditions due to wildfires. The coarse vertical resolution of the IASI retrievals does not allow the determination of exact plume heights of forest fires, but the large CO enhancements measured are consistent with respect to transport pathways and plume height, to the maxi-mum aerosol backscatter coefficient measured from space by the CALIPSO lidar (Winkler et al., 2003).
Pommier et al. (2010) described in situ aircraft measure-ments of CO from the POLARCAT campaign in the frame-work of the International Polar Year (IPY) which they com-pared to IASI FORLI-CO. They found that IASI has the capability to detect long-range transport of (CO) plumes and high boundary layer CO signatures from forest fires in Siberia and that IASI CO retrievals are less accurate over sea ice and snow. They also compared IASI CO with aircraft data, completed above the aircraft profile with the CO cli-matology of the Atmospheric Chemistry Experiment Fourier Transform Spectrometer (ACE-FTS), and found good agree-ment (maximum differences of 17 % and 20 % for profiles in spring and in summer, respectively; 1 to 5 % and 12 % for total columns in spring and summer, respectively, with IASI being higher). Total column comparisons of IASI CO with these in situ aircraft measurements show correlations be-tween 0.15 and 0.74 in spring and 0.26 and 0.84 in summer.
In this paper we focus on the comparison of IASI FORLI-CO retrievals with ground-based solar absorption FTIR mea-surements from selected NDACC stations. This is the first
study in which individual IASI CO data are compared to co-located high-quality ground-based data.
In the following Sect. 2 we shortly present the IASI instru-ment and the FORLI-CO retrievals and in Sect. 3 the ground-based FTIR data are described. Section 4 explains the com-parison method, followed by the results of the comcom-parisons in Sect. 5. A description of the error budget for the CO total column differences is given in Sect. 6.
2 The IASI instrument and the FORLI-CO retrievals
IASI was launched on 19 October 2006 on the satellite MetOp-A from the European Organisation for the Exploita-tion of Meteorological Satellites (EUMETSAT). It has a cir-cular field of view (FOV) at nadir of 12 km, and its spectral range is from 645 to 2760 cm−1 (3.62 to 15.5 µm) with an
apodized spectral resolution of 0.5 cm−1 and spectral
sam-pling of 0.25 cm−1 leading to 8461 spectral samples. It has a wide swath width of 2200 km providing global coverage twice a day. For more information about the IASI instrument, refer to Hilton et al. (2012).
The CO IASI data used here were retrieved from the nadir radiance spectra in the spectral range 2143 to 2181.25 cm−1 using the retrieval code FORLI-CO from the Universit´e Li-bre de Bruxelles (ULB) (Hurtmans et al., 2012). It uses pre-calculated lookup tables (LUTs) to make near real-time processing possible by avoiding line-by-line retrievals. The FORLI LUTs are absorption cross sections at various pres-sures (on a logarithmic grid), temperatures (on a linear grid) and humidities. For CO, these cross-sections are calculated in the spectral range 2128–2206 cm−1, larger than the one used
in the retrieval, and with an oversampling of 10. More details are given in Hurtmans et al. (2012). FORLI-CO retrievals give CO profiles reported on 19 altitude levels using the op-timal estimation method described by Rodgers (2000). The 19 altitude levels correspond to the altitude layers 0 to 1 km, 1 to 2 km, 2 to 3 km, ..., 17 to 18 km and 18 km to the top of the atmosphere. The product consists of a CO concentration profile retrieved on these vertical levels at each measurement point, as well as the associated errors and an averaging ker-nel matrix. A single a priori profile (in VMR) is used in the retrieval scheme. The temperature and humidity profiles used in FORLI are those from the the EUMETSAT Level 2 pro-cessor. The cloud fraction disseminated by EUMETSAT is used, and only those pixels in which the cloud fraction is be-low 25 % are processed. Hence, each observation has a dif-ferent and already optimized set of meteorological profiles associated. One should further note that the water amount is systematically adjusted (as a total column), strongly min-imizing the impact of the latter on the total retrieval error. For the emissivity, FORLI uses above continental surfaces the IASI climatology (Zhou et al., 2011) whenever possible (more detail can be found in Hurtmans et al., 2012).
For the comparisons between the IASI FORLI-CO re-trievals and selected NDACC FTIR column measurements in the year 2008, version 20100815 of IASI FORLI-CO data products was used. Comparisons with a previous version (20081030 studied in George et al., 2009) have also been per-formed, but since we find no significant differences between the results of the comparisons with the two FORLI retrieval versions, only the latest version will be presented here. The results are generally also applicable to the older version data. We use here the IASI FORLI-CO products currently pub-licly available, which are the total column and the corre-sponding averaging kernel vector (estimated by adding the averaging kernels matrix rows). These products are avail-able from the Ether website (http://ether.ipsl.jussieu.fr) for the whole IASI measurement period. Quality flags allow for filtering of the data. Therefore we are able to use here the most reliable data. In particular, cloud cover has to be less than 12 % (cloud fraction from the EUMETSAT level 2 pro-cessor is used from a combination of instruments onboard MetOp A, following specific methods, detailed in August et al., 2012) and the averaging kernel vector must not in-clude unrepresentative values (generally too high). This fil-tering reduces the number of data points used in the analysis by between 11 and 23 % depending on the station analysed.
3 Ground-based Fourier transform infrared spectrometers
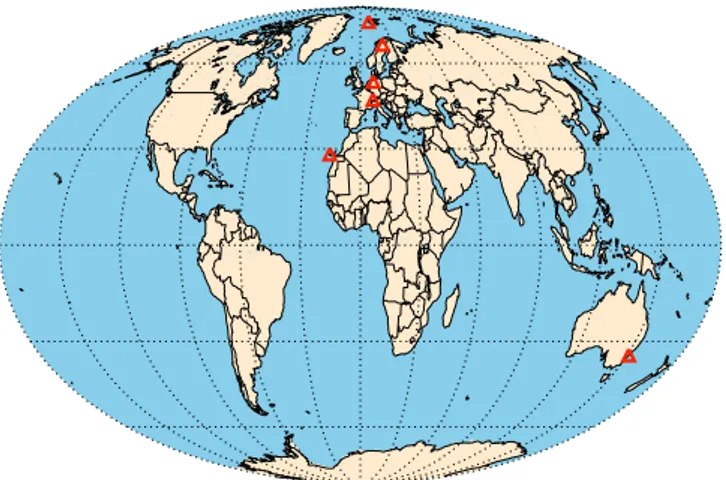
The IASI FORLI-CO data have been compared with total columns retrieved from solar absorption spectra recorded by ground-based FTIR spectrometers from six stations that are part of NDACC (http://www.ndacc.org). A list of the sta-tions with their location is presented in Table 1; Fig. 1 shows the distribution of the FTIR sites. The participating stations cover latitudes from 34.5◦S to 78.9◦N. They provide mea-surements in the Northern Hemisphere from the subtrop-ics (Iza˜na) to the polar regions (Ny- ˚Alesund and Kiruna); Wollongong is the only station in the Southern Hemisphere. These instruments make regular year-round measurements from which the abundances of several tropospheric and stratospheric chemical species, including CO, can be de-rived. The FTIR measurements require clear-sky daylight conditions, which excludes measurements at Ny- ˚Alesund and Kiruna during polar winter.
More information about the instruments, the retrieval methodologies and the measurements performed at each site can be found in the references provided in Table 1. All stations use Bruker FTIR spectrometers (Ny- ˚Alesund and Jungfraujoch: 120HR, Kiruna, Bremen, Iza˜na and Wollongong: 125HR); for these measurements the instru-ments use resolutions, i.e. the inverse of the maximum optical path difference (1/maxOPD), given in Table 1, from 0.004 to 0.006 cm−1. In all cases, the microwin-dows 2057.70–2058.00 cm−1, 2069.56–2069.76 cm−1 and
Fig. 1. Ground-based FTIR spectrometer locations used in the com-parisons. From the north to the south, in red: Ny- ˚Alesund, Kiruna, Bremen, Jungfraujoch, Iza˜na, and Wollongong.
2157.50–2159.15 cm−1 were fitted simultaneously to re-trieve CO using either the SFIT2 code (Pougatchev and Rins-land, 1995; Pougatchev et al., 1995; Rinsland et al., 1998) or PROFFIT96 (Hase et al., 2004). Both algorithms imple-ment the optimal estimation method (Rodgers, 2000) to re-trieve vertical profiles from a statistical weighting between a priori information and information coming from the high-resolution spectral measurements. Spectroscopic line param-eters from HITRAN 2004 were adopted for all ground-based retrievals. Other information required for the retrievals such as a priori profiles and covariances, treatment of instrument lineshape, and atmospheric temperature and pressure is opti-mized for each site as appropriate for the local conditions.
NDACC FTIR CO data have already proven useful in the past for the validation of various satellite data sets, e.g. in Barret et al. (2003, 2005); Sussmann and Buchwitz (2005); Dils et al. (2006); Senten et al. (2008); Clerbaux et al. (2008), and de Laat et al. (2010).
4 Comparison methodology
In the work presented here, we use IASI data from 1 Jan-uary 2008 to 31 December 2008. We perform a careful com-parison between IASI and NDACC total columns adjusting for altitude differences and accounting for the respective ver-tical resolutions of the measurements, within the limits of the co-location criteria and using strict quality control cri-teria for the filtering of the data. We took the same coinci-dence criteria for all the stations to define correlative mea-surements taking into account temporal and spatial variabil-ity, and aiming at a statistically relevant number of compar-isons. A given FTIR measurement was compared to all IASI measurements that occurred on the same calendar day (UTC) and within 100 km of the ground-based station. No distinc-tion was made between IASI measurement footprints over
Table 1. List of the FTIR stations that provided data for the analyses (Sect. 5). The latitude and longitude of each station are provided, together with the altitude above sea level in meters (m a.s.l.). The instrument, the maximum optical path difference (maxOPD) and the retrieval code (+version) used for the CO measurements are indicated for each station in columns 5, 6 and 7. References describing the stations, measurements and analyses are given in column 8.
Station Location Coordinates Alt. Instrument maxOPD Retrieval Code Reference
[m a.s.l.] [cm] (version)
Ny- ˚Alesund Svalbard 78.9◦N, 11.9◦E 20 Bruker 120HR 180 SFIT2 (3.93) Notholt et al. (1993) Kiruna Sweden 67.8◦N, 20.4◦E 419 Bruker 125HR 180 PROFFIT96 Blumenstock et al. (2006) Bremen Germany 53.1◦N, 8.8◦E 27 Bruker 125HR 180 SFIT2 (3.93) Velazco et al. (2007) Jungfraujoch Switzerland 46.5◦N, 8.0◦E 3580 Bruker 120HR 175 SFIT2 (3.91) Mahieu et al. (1997) Iza˜na Canary Islands 28.3◦N, 16.5◦W 2367 Bruker 125HR 180 PROFFIT96 Schneider et al. (2005) Wollongong Australia 34.5◦S, 150.9◦E 30 Bruker 125HR 257 SFIT2 (3.92) Paton-Walsh et al. (2005)
(a) FTIR profile IASI a priori profile Lowest FTIR partial column Ratio for scaling
FTIR base at altitude Scaled column correction (b) IASI
profile FTIR profile
Column Correction (remove) IASI base
at altitude
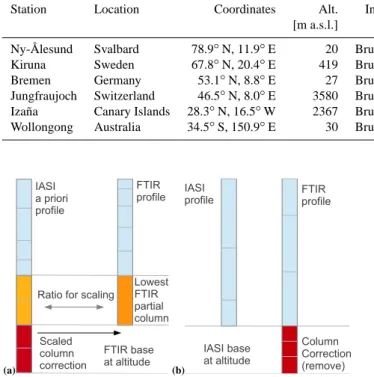
Fig. 2. Altitude adjustment for the cases where the base of the ground-based FTIR spectrometer measurements is at a higher (a) or at a lower altitude (b) than the IASI ground pixel. The adjusting partial column is indicated in red; in (a) it is added to and in (b) sub-tracted from the FTIR column. The partial columns to calculate the scaling factor in (a) are indicated in yellow. The calculations were done using a combination of the FTIR and IASI altitude grids.
sea and land nor for IASI day or night measurements. The IASI location that was used in searching for coincidences was the latitude, longitude and time of the centre of the IASI footprint. In cases where several FTIR measurements from a site were co-located with one IASI measurement, they were all considered.
4.1 Altitude adjustment of the FTIR measurements to the IASI ground level altitude
The IASI measurements are scattered within a 100 km ra-dius around the FTIR instrument sites. They may therefore have a different ground level altitude than the ground-based measurements. Since we must compare IASI and FTIR total columns over the same altitude range, and since we want to smooth the FTIR profiles using the IASI total column aver-aging kernels, we need to adjust the FTIR profile in partial column units such that its total column corresponds to the IASI total columns with different ground level altitudes.
To do this the IASI a priori profiles in partial column units were used to calculate two partial columns (Fig. 2a indicated in red and in yellow): one partial column, the adjusting par-tial column, in the altitude range between the FTIR and the IASI ground level altitudes (Fig. 2a red) and another one in the altitude range of the lowest FTIR partial column (Fig. 2a yellow). The latter was used to calculate the ratio between the a priori partial columns and the FTIR partial column to scale the adjusting partial column. The scaled adjusting par-tial column was then added to the FTIR parpar-tial column profile when the IASI altitude range is larger than the FTIR altitude range. Because the IASI and FTIR data are on different grids, a combined grid has been used to do these calculations.
On the contrary, if the FTIR profile covers a larger alti-tude range than the IASI measurement, the FTIR profile is cut to fit the altitude range of IASI (Fig. 2b). If there are m IASI measurements available for one day, each of the n cor-responding FTIR values was changed m times to correspond to the ground level altitude of the IASI measurements.
The ground level altitude of the IASI measurements is based on the coordinates of the centre of the IASI footprint. Since the 1-km vertical scale of the FORLI-CO profiles is coarser than the one of the FTIR CO profiles, the GLOBE (1999) digital elevation model from the National Geographi-cal Data Center (National Oceanic and Atmospheric Admin-istration – NOAA) is used to improve the vertical resolution for the altitude adjustment. The IASI ground level altitudes are therefore determined using either the GLOBE model or information gained from the averaging kernel values from the FORLI-CO IASI retrievals (IASI averaging kernel val-ues are not defined at altitudes between mean sea level and the terrain altitude where the IASI footprint is situated).
Based on this altitude information, we can determine a minimum altitude for the IASI total column: if the IASI ground altitude, determined from the GLOBE database, is lower than the altitude determined using the minimum alti-tude associated with the IASI averaging kernel altialti-tudes, then the IASI averaging kernel altitude is used; otherwise, we use the altitude from the GLOBE database if the difference is less than 1 km (the thickness of a FORLI retrieval layer). For
0 0.5 1 1.5 2 0 2 4 6 8 10 12 14 16 18 AVK at Izana
CO total column AVK
altitude [km]
Fig. 3. Mean ground-based FTIR averaging kernels (red) compared to the mean IASI averaging kernel (blue) for Iza˜na. The averaging kernels are shown for altitudes above the station (2367 m).
differences of more than 1 km, we use the minimum altitude associated with the averaging kernel altitudes to which 999 m are added to reduce the altitude range of the first layer, but still allowing to determine the IASI ground altitude using the averaging kernel altitudes.
4.2 Smoothing of the FTIR data with the IASI CO averaging kernel
As can be seen in Fig. 3 for the example of Iza˜na, the IASI mean total column averaging kernel from FORLI-CO has a maximum in the upper troposphere that is larger than one (shown in blue), whereas the one for the FTIR retrievals (shown in red) is constant at about one.
After correction for the altitude differences between the IASI and FTIR measurements, the FTIR profiles in partial column units are interpolated on the altitude grid of the IASI retrievals. Then the altitude-corrected FTIR profiles (in par-tial column units) are smoothed with the total column av-eraging kernels of the IASI retrievals according to Eq. (4) of Rodgers and Connor (2003): xs=xa+AIASI(x −xa), where
xs is the smoothed version of x with x being the
altitude-corrected FTIR profile in partial column units, xais the IASI
a priori profile in partial column units and AIASIis the IASI
total column averaging vector.
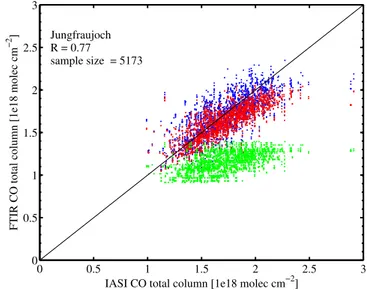
Figure 4 shows the effectiveness of the smoothing and altitude correction: shown are total column values of un-corrected, unsmoothed columns (green), altitude-corrected columns (red) and altitude-corrected, smoothed columns (blue) for Jungfraujoch.
We now have an averaging kernel smoothed, altitude-adjusted FTIR ground-based CO total column, called
0 0.5 1 1.5 2 2.5 3 0 0.5 1 1.5 2 2.5 3
IASI CO total column [1e18 molec cm−2]
FTIR CO total column [1e18 molec cm
−2 ] JungfraujochR = 0.77
sample size = 5173
Fig. 4. FTIR CO total columns against the IASI CO for the un-corrected, unsmoothed columns (green), the altitude-adjusted (red) and altitude-adjusted, smoothed columns (blue) for Jungfraujoch. The correlation coefficient of the comparison between the altitude-adjusted, smoothed FTIR CO and IASI CO (blue) is shown. For clarity, only every second data point is plotted.
as-IASI-FTIR CO total column in the following, correspond-ing to the IASI CO total column. Some of the IASI a priori information, however, has been added to the FTIR column by adjusting for the differences between the base altitudes of the FTIR and IASI measurements. Since the IASI averag-ing kernels are small towards the surface, which implies that the IASI retrieved profile will tend towards the a priori, the inclusion of some IASI a priori information onto the FTIR column has only a minor influence on the FTIR-IASI com-parison. The alternative would be to remove the added IASI information from the FTIR column after smoothing, and like-wise a corresponding section from the IASI column itself. However, given the limited number of pieces of information in the IASI column, removing such a section would induce errors as well.
4.3 Comparisons
We now have, for each of the m daily IASI CO measure-ments, n as-IASI-FTIR ground-based CO total columns to compare with (m and n change for each day).
Comparisons of the total columns are performed for each station, leading to relative differences and standard devia-tions over the entire time series. Since the different compar-ison pairs have their total columns calculated over different altitude ranges, we have to compare relative total column dif-ferences. The relative values are calculated with respect to the validation instrument (FTIR); e.g. the total mean relative difference was calculated as follows:
Table 2. Results of the CO total column comparisons between IASI and the as-IASI-FTIR data. The mean and median differences and the 1-σ standard deviation are indicated in columns 2 to 4, the number of individual comparisons, of unique FTIR values and of unique IASI values in columns 5 to 7, the number of days in column 8, the correlations, R, between the individual column values in column 9 and the maximum temporal coincidence (hours and minutes), max 1t , in column 10.
FTIR Mean Median 1-Std # of # of # of # of R Max station diff. [%] diff. [%] diff. [%] pairs FTIR IASI days 1t
Ny- ˚Alesund −1.5 −3.3 15.3 4514 53 17 14 0.60 9 h 210 Kiruna 1.3 −0.9 19.3 2519 66 34 42 0.60 11 h 430 Bremen 10.8 9.3 13.7 952 40 14 20 0.32 9 h 160 Jungfraujoch 2.3 2.0 12.5 5173 309 257 97 0.77 15 h 430 Iza˜na −2.4 −2.4 9.9 2466 109 81 67 0.73 13 h 390 Wollongong −4.5 −5.3 12.9 13 402 611 244 77 0.77 16 h 270 1rel=100 % × 1 N N X i=1 IASIi−FTIRi FTIRi , (1)
where N is the total number of comparison pairs over all days, IASIi is the IASI total column for the i-th coincident
pair, and FTIRi is the corresponding total column for the
FTIR instrument.
The relative differences and standard deviations can be in-terpreted taking into account the errors on these differences, due to the errors on the individual FTIR and IASI data. This calculation has been performed for one representative station only, as described in Sect. 6. The results of the FTIR total column comparisons are shown in Sect. 5.
5 Results for the ground-based inter-comparisons of CO from FTIR spectrometers
The comparisons of the as-IASI-FTIR columns with the IASI data are presented in Table 2. Shown are mean differences, median differences, the 1-σ standard deviation of the mean, the number of comparison pairs, the number of compari-son days, and the correlation coefficients of the IASI total columns and the corresponding as-IASI-FTIR total columns. It can be seen that the standard deviations are generally larger than the mean or median differences, indicating that the differences are not significant compared to the variability. Bremen has large CO total columns as can be seen from Table 3. It also shows the largest IASI-FTIR differences, the reason of which is not clear to us. We verified that it is not due to the co-location criteria chosen. A reduction of the spatial coincidence criterion to 50 km slightly im-proves the differences for Ny- ˚Alesund, Jungfraujoch and Iza˜na, but the variability increases. The differences remain the same for Kiruna, Bremen and Wollongong. Analyses us-ing tighter temporal coincidences did not show a general reduction of the differences for Ny- ˚Alesund, Bremen and Jungfraujoch. Kiruna, Iza˜na and Wollongong show smaller differences when 6 h are used for the coincidence criterion;
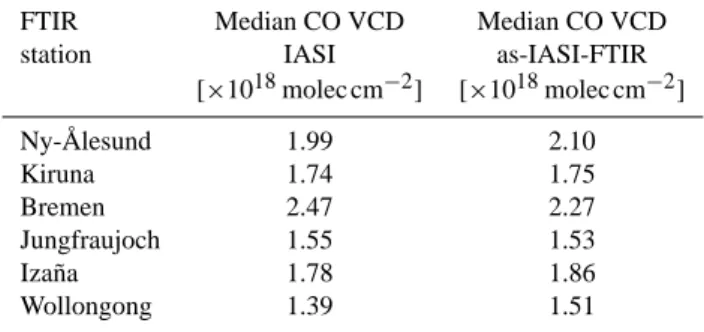
Table 3. Median CO vertical column densities (VCD) for IASI and the as-IASI-FTIR data.
FTIR Median CO VCD Median CO VCD station IASI as-IASI-FTIR
[×1018molec cm−2] [×1018molec cm−2] Ny- ˚Alesund 1.99 2.10 Kiruna 1.74 1.75 Bremen 2.47 2.27 Jungfraujoch 1.55 1.53 Iza˜na 1.78 1.86 Wollongong 1.39 1.51
for even smaller temporal coincidences (3 h), the mean dif-ferences (and the variabilities) become larger. For a 12 h co-incidence criterion, there is no change for any of the stations, because it roughly coincides with our chosen criterion.
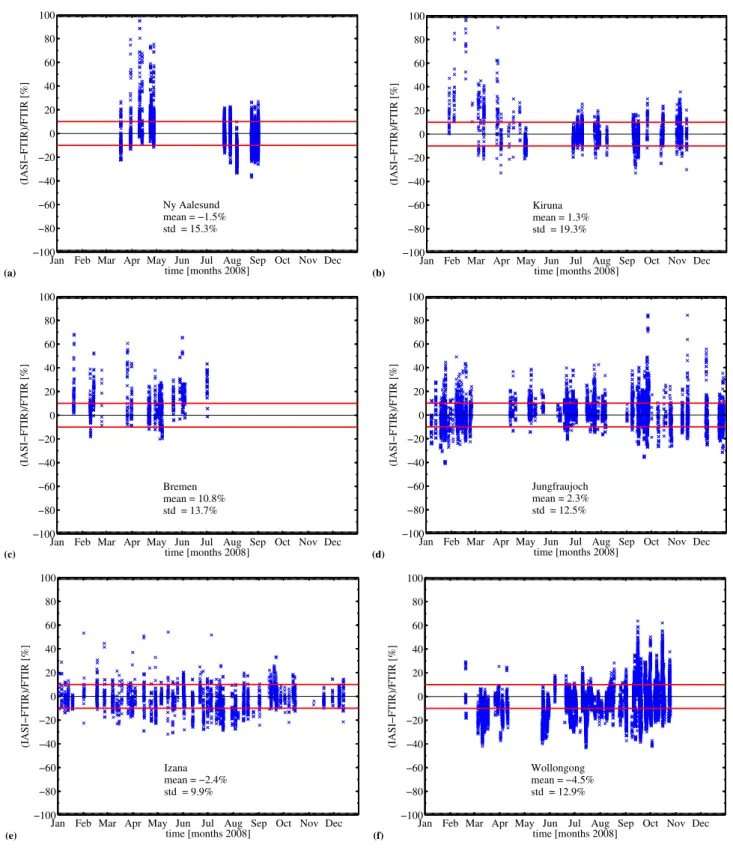
Figure 5 shows the relative differences of the as-IASI-FTIR CO total column and the IASI CO total column for all the comparison pairs for all stations. It can be seen that there is large intra-day variability.
6 Representative error estimates calculated for Kiruna
Error budget calculations for the comparisons are performed following Rodgers and Connor (2003). Assuming that the ground-based averaging kernels are almost ideal (i.e. they are about one at all altitudes), Eq. (27) from Rodgers and Connor (2003) can be reduced to
σ2=σIASI2 +ATIASISpcFTIRAIASI (2)
where SpcFTIR is the FTIR error covariance matrix in partial column units, AIASIis the IASI total column averaging
ker-nel given in partial columns units, σ is the random error of the differences between the IASI total columns and the as-IASI-FTIR total columns, σIASI is the random error on
the IASI total column and ATIASISpcFTIRAIASI=σFTIR2 is the
(a)
Jan Feb Mar Apr May Jun Jul Aug Sep Oct Nov Dec −100 −80 −60 −40 −20 0 20 40 60 80 100 time [months 2008] (IASI−FTIR)/FTIR [%] Ny Aalesund mean = −1.5% std = 15.3% (b)
Jan Feb Mar Apr May Jun Jul Aug Sep Oct Nov Dec −100 −80 −60 −40 −20 0 20 40 60 80 100 time [months 2008] (IASI−FTIR)/FTIR [%] Kiruna mean = 1.3% std = 19.3% (c)
Jan Feb Mar Apr May Jun Jul Aug Sep Oct Nov Dec −100 −80 −60 −40 −20 0 20 40 60 80 100 time [months 2008] (IASI−FTIR)/FTIR [%] Bremen mean = 10.8% std = 13.7% (d)
Jan Feb Mar Apr May Jun Jul Aug Sep Oct Nov Dec −100 −80 −60 −40 −20 0 20 40 60 80 100 time [months 2008] (IASI−FTIR)/FTIR [%] Jungfraujoch mean = 2.3% std = 12.5% (e)
Jan Feb Mar Apr May Jun Jul Aug Sep Oct Nov Dec −100 −80 −60 −40 −20 0 20 40 60 80 100 time [months 2008] (IASI−FTIR)/FTIR [%] Izana mean = −2.4% std = 9.9% (f)
Jan Feb Mar Apr May Jun Jul Aug Sep Oct Nov Dec −100 −80 −60 −40 −20 0 20 40 60 80 100 time [months 2008] (IASI−FTIR)/FTIR [%] Wollongong mean = −4.5% std = 12.9%
Fig. 5. Relative differences of the smoothed and altitude-corrected FTIR CO total column and the IASI CO total column of all the comparison pairs for (a) Ny- ˚Alesund, (b) Kiruna, (c) Bremen, (d) Jungfraujoch, (e) Iza˜na and (f) Wollongong. The red lines indicate ±10 % difference.
time [months 2008]
σ
[1e18 molec cm
−2
]
Jan Feb Mar Apr May Jun Jul Aug Sep Oct Nov Dec 0 0.1 0.2 0.3 0.4 σ of orig. FTIR σ of IASI time [months 2008] σ [1e18 molec cm −2 ]
Jan Feb Mar Apr May Jun Jul Aug Sep Oct Nov Dec 0 0.1 0.2 0.3 0.4 σ of as−IASI−FTIR
σ of diff (IASI − as−IASI−FTIR)
Fig. 6. Carbon monoxide random errors, σ , for the quality-filtered data against time at Kiruna. Shown are the errors for the original FTIR total columns (cyan open circles), the IASI total columns (red dots), the as-IASI-FTIR total columns (green open circles) and the random errors of the differences between IASI and as-IASI-FTIR total columns (blue dots).
It can be seen that the altitude range of the FTIR error covariance matrix, SFTIR, has to be adjusted to the altitude
range of the corresponding IASI averaging kernels, similarly to the altitude correction of the profile itself. So either we have to cut off matrix entries corresponding to the altitude range that was removed, or we have to add entries corre-sponding to the extended altitude range. In the latter case, we added a diagonal matrix element which was determined from the difference between the FTIR partial column at the lowest FTIR layer and the IASI a priori partial column corre-sponding to the FTIR layer. Also, the error covariance ma-trix for the ground-based data, SFTIR, has to be regridded
on the IASI total column averaging kernel grid, AIASI, using
the method described in Calisesi et al. (2005) and Vigouroux et al. (2009). With this information the random errors can be calculated.
Figure 6 shows these random errors for the quality-filtered data. The average random errors of the CO columns are about 0.01 ×10¹⁸molec cm−2 (cyan open circles) and 0.06 ×10¹⁸molec cm−2 (red dots), for the FTIR and IASI data, respectively. The FTIR random error includes the ran-dom contributions from the measurement error, the error of the model parameters and the temperature error. The smoothing error is excluded. The random errors of the FTIR data after altitude adjustment and smoothing using the above formalism are of order 0.05 ×10¹⁸molec cm−2(green open circles), and the random error in the differences is 0.08 ×10¹⁸molec cm−2(blue dots).
These error calculations were performed for the com-parison site Kiruna. The resulting random errors on the
CO differences [1e18 molec cm−2]
random error ∆ CO VCD [1e18 molec cm −2 ] −1 −0.5 0 0.5 1 1.5 2 2.5 3 0 0.05 0.1 0.15 0.2 0.25
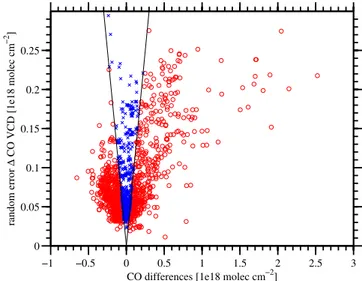
Fig. 7. Carbon monoxide random error of the differences against differences of the IASI-FTIR total column for the quality-filtered data for Kiruna. For the values indicated in blue (red), the absolute values of the differences are smaller (larger) than the random errors (VCD = vertical column density).
differences have been compared to the standard deviations of the differences and to the differences themselves. The mean value of the random errors on the differences for Kiruna is 5.1 % (median 3.5 %). It can be seen also that, on average, this error of the differences is smaller than the standard de-viation of the differences for Kiruna shown in Table 2. So even if there is no significant bias on average between the IASI data and the ground-based data, there are many cases where the differences between individual IASI total columns and the corresponding FTIR columns are significant.
This is further illustrated in Fig. 7, in which we plot in-dividual values of the random error on the differences ver-sus the differences themselves, for the quality-filtered data at Kiruna. The red dots correspond to the cases where the absolute value of the difference between the IASI and FTIR ground-based CO columns is larger than the error associated with it, in other words, where the difference is significant. The blue dots are the cases where the opposite is true, in other words, where the difference is not significant. This evalua-tion indicates that the differences are significant in 69 % of the cases.
One may wonder whether this large number is due to the choice of the co-location criteria. If we impose more strin-gent co-location criteria, e.g. by reducing the co-location dis-tance from 100 km to 50 km, we find that the percentage of cases in which the differences are significant does not change – if instead 1 h is chosen for the temporal coincidence crite-rion, it increases slightly to 71 %.
In conclusion, we can say that there is an important num-ber of cases for which the differences between the IASI and the FTIR ground-based CO columns are significant,
independently of the co-location criteria; the reported IASI error may therefore be underestimated. Nevertheless, these differences are random and there is no bias on average be-tween the IASI and FTIR ground-based data.
For the individual comparisons one should not forget that we are looking at two different sounding geometries (IASI has a large range of viewing geometries; FTIR instruments follow the sun vector for their air mass) and, besides co-location, IASI has large pixel sizes and the two instruments are thus unlikely to probe exactly the same air mass (within a given pixel IASI even sees an average of concentrations). Therefore, the differences of individual comparisons may still be partly attributed to real CO variability.
7 Summary and conclusions
This paper presents first validation results of IASI FORLI-CO total columns using FORLI-CO retrievals from six ground-based FTIR NDACC sites for measurements from January to De-cember 2008. These stations are Ny- ˚Alesund, Kiruna, Bre-men, Jungfraujoch, Iza˜na and Wollongong; they span a lati-tude band from 79◦N to 34◦S.
Compared to the FTIR CO total columns, the IASI total columns generally show an equal distribution of under- and overestimation. The mean differences, which vary between
−4.5 % for Wollongong and 10.8 % for Bremen, have been shown not to be significant since the standard deviations of the differences are greater than the differences themselves. No significant impact of the co-location criteria (50 km to 100 km; 1 h to 24 h) on the differences could be observed.
For Kiruna we have performed a complete error analysis which shows that individual differences between IASI and ground-based FTIR total columns of CO are significant in 69 % of the cases studied. From Eq. (2) the possibility ex-ists that either the errors of the FTIR validation data set or the IASI random errors are underestimated. Assuming that the NDACC FTIR data and associated error budgets are a re-liable reference, and that the co-location criteria have been chosen appropriately, we conclude that on individual IASI retrievals the reported IASI error may be underestimated. It has to be kept in mind that IASI might not probe exactly the same air mass as the FTIR instruments.
On average we find that there is no bias between the IASI data and the ground-based NDACC data for the CO total columns above the 6 stations that have been investigated in this study. Further work, and in particular detailed com-parisons of the FORLI-CO retrieved profiles along with the NDACC profiles, should help to identify the source of dis-crepancies observed on individual measurements, such as for instance specific contaminations due to fire or pollution plumes.
Acknowledgements. IASI has been developed and built under the
responsibility of the Centre National d’ ´Etudes Spatiales (CNES, France). It is flown on board the MetOp satellites as part of the EUMETSAT Polar System. The IASI L1 data are received through the EUMETCast near-real-time data distribution service. IASI L1 and L2 data are stored in the Ether French atmospheric database (http://ether.ipsl.jussieu.fr). The LATMOS team is grate-ful to CNES for scientific collaboration and financial support. The research at ULB was funded by the F.R.S.-FNRS (M.I.S. nF.4511.08) and the Belgian State Federal Office for Scientific, Technical and Cultural Affairs. Financial support by the Actions de Recherche Concert´ees (Communaut´e Franc¸aise de Belgique) is also acknowledged. The University of Li`ege and IASB-BIRA involvement was essentially supported by the successive PRODEX projects SECPEA and A3C funded by the Belgian Federal Science Policy Office, BELSPO, Brussels. The F.R.S.-FNRS and the F´ed´eration Wallonie-Bruxelles are further acknowledged. We thank the International Foundation High Altitude Research Stations Jungfraujoch and Gornergrat (HFSJG, Bern) for supporting the facilities needed to perform the observations. P. F. Coheur and E. Mahieu are Research Associates (Chercheurs Qualifi´es) with F.R.S.-FNRS. The authors would like to thank the Australian Research Council for funding the Wollongong measurements under grants DP110101948 and DP110103118. We also acknowledge the suggestions of the anonymous reviewers.
Edited by: B. Funke
References
August, T., Klaes, D., Schl¨ussel, P., Hultberg, T., Crapeau, M., Arriaga, A., O’Carroll, A., Coppens, D., Munro, R., and Cal-bet, X.: IASI on Metop-A: Operational Level 2 retrievals after five years in orbit, J. Quant. Spectrosc. Ra., 113, 1340–1371, doi:10.1016/j.jqsrt.2012.02.028, 2012.
Aumann, H. H., Chahine, M. T., Gautier, C., Goldberg, M. D., Kalnay, E., McMillin, L. M., Revercomb, H., Rosenkranz, P. W., Smith, W. L., Staelin, D. H., Strow, L. L., and Susskind, J.: AIRS/AMSU/HSB on the AQUA mission: design, science ob-jectives, data products, and processing systems, IEEE T. Geosci. Remote, 41, 253–264, doi:10.1109/TGRS.2002.808356, 2003. Barret, B., De Mazi`ere, M., and Mahieu, E.: Ground-based FTIR
measurements of CO from the Jungfraujoch: characterisation and comparison with in situ surface and MOPITT data, At-mos. Chem. Phys., 3, 2217–2223, doi:10.5194/acp-3-2217-2003, 2003.
Barret, B., Turquety, S., Hurtmans, D., Clerbaux, C., Hadji-Lazaro, J., Bey, I., Auvray, M., and Coheur, P.-F.: Global carbon monoxide vertical distributions from spaceborne high-resolution FTIR nadir measurements, Atmos. Chem. Phys., 5, 2901–2914, doi:10.5194/acp-5-2901-2005, 2005.
Beer, R., Glavich, T. A., and Rider, D. M.: Tropospheric emission spectrometer for the Earth Observing System’s Aura satellite, Appl. Opt., 40, 2356–2367, doi:10.1364/AO.40.002356, 2001. Blumenstock, T., Kopp, G., Hase, F., Hochschild, G., Mikuteit, S.,
Raffalski, U., and Ruhnke, R.: Observation of unusual chlorine activation by ground-based infrared and microwave spectroscopy in the late Arctic winter 2000/01, Atmos. Chem. Phys., 6, 897– 905, doi:10.5194/acp-6-897-2006, 2006.
Brasseur, G. and Solomon, S.: Aeronomy of the Middle Atmo-sphere, 3rd Edn., Vol. 32 of Atmospheric and Oceanographic Sciences Library, Springer, P.O. Box 17, 3300 AA Dordrecht, The Netherlands, 2005.
Calisesi, Y., Soebijanta, V. T., and van Oss, R.: Regrid-ding of remote sounRegrid-dings: formulation and application to ozone profile comparison, J. Geophys. Res., 110, D23306, doi:10.1029/2005JD006122, 2005.
Clerbaux, C., George, M., Turquety, S., Walker, K. A., Barret, B., Bernath, P., Boone, C., Borsdorff, T., Cammas, J. P., Catoire, V., Coffey, M., Coheur, P.-F., Deeter, M., De Mazi`ere, M., Drum-mond, J., Duchatelet, P., Dupuy, E., de Zafra, R., Eddou-nia, F., Edwards, D. P., Emmons, L., Funke, B., Gille, J., Griffith, D. W. T., Hannigan, J., Hase, F., H¨opfner, M., Jones, N., Kagawa, A., Kasai, Y., Kramer, I., Le Flochmo¨en, E., Livesey, N. J., L´opez-Puertas, M., Luo, M., Mahieu, E., Murtagh, D., N´ed´elec, P., Pazmino, A., Pumphrey, H., Ricaud, P., Rinsland, C. P., Robert, C., Schneider, M., Senten, C., Stiller, G., Strandberg, A., Strong, K., Sussmann, R., Thouret, V., Urban, J., and Wiacek, A.: CO measurements from the ACE-FTS satel-lite instrument: data analysis and validation using ground-based, airborne and spaceborne observations, Atmos. Chem. Phys., 8, 2569–2594, doi:10.5194/acp-8-2569-2008, 2008.
Clerbaux, C., Boynard, A., Clarisse, L., George, M., Hadji-Lazaro, J., Herbin, H., Hurtmans, D., Pommier, M., Razavi, A., Turquety, S., Wespes, C., and Coheur, P.-F.: Monitoring of atmospheric composition using the thermal infrared IASI/MetOp sounder, At-mos. Chem. Phys., 9, 6041–6054, doi:10.5194/acp-9-6041-2009, 2009.
Deeter, M. N., Emmons, L. K., Francis, G. L., Edwards, D. P., Gille, J. C., Warner, J. X., Khattatov, B., Ziskin, D., Lamarque, J.-F., Ho, S.-P., Yudin, V., Atti´e, J.-L., Packman, D., Chen, J., Mao, D., and Drummond, J. R.: Operational carbon monoxide retrieval algorithm and selected results for the MOPITT instrument, J. Geophys. Res.-Atmos., 108, 4399, doi:10.1029/2002JD003186, 2003.
de Laat, A. T. J., Gloudemans, A. M. S., Schrijver, H., Aben, I., Na-gahama, Y., Suzuki, K., Mahieu, E., Jones, N. B., Paton-Walsh, C., Deutscher, N. M., Griffith, D. W. T., De Mazi`ere, M., Mitter-meier, R. L., Fast, H., Notholt, J., Palm, M., Hawat, T., Blumen-stock, T., Hase, F., Schneider, M., Rinsland, C., Dzhola, A. V., Grechko, E. I., Poberovskii, A. M., Makarova, M. V., Mellqvist, J., Strandberg, A., Sussmann, R., Borsdorff, T., and Rettinger, M.: Validation of five years (2003–2007) of SCIAMACHY CO total column measurements using ground-based spectrometer ob-servations, Atmos. Meas. Tech., 3, 1457–1471, doi:10.5194/amt-3-1457-2010, 2010.
Dils, B., De Mazi`ere, M., M¨uller, J. F., Blumenstock, T., Buchwitz, M., de Beek, R., Demoulin, P., Duchatelet, P., Fast, H., Franken-berg, C., Gloudemans, A., Griffith, D., Jones, N., Kerzenmacher, T., Kramer, I., Mahieu, E., Mellqvist, J., Mittermeier, R. L., Notholt, J., Rinsland, C. P., Schrijver, H., Smale, D., Strandberg, A., Straume, A. G., Stremme, W., Strong, K., Sussmann, R., Tay-lor, J., van den Broek, M., Velazco, V., Wagner, T., Warneke, T., Wiacek, A., and Wood, S.: Comparisons between SCIAMACHY and ground-based FTIR data for total columns of CO, CH4, CO2
and N2O, Atmos. Chem. Phys., 6, 1953–1976,
doi:10.5194/acp-6-1953-2006, 2006.
Drummond, J. R., Pan, L., Edwards, D. P., Gille, J. C., and Smith, M. W.: Satellite remote sensing of tropospheric CO and CH4:
forward model studies of the MOPITT instrument, Appl. Opt., 34, 6976–6988, 1995.
Fortems-Cheiney, A., Chevallier, F., Pison, I., Bousquet, P., Szopa, S., Deeter, M. N., and Clerbaux, C.: Ten years of CO emis-sions as seen from Measurements of Pollution in the Tro-posphere (MOPITT), J. Geophys. Res.-Atmos., 116, D05304, doi:10.1029/2010JD014416, 2011.
George, M., Clerbaux, C., Hurtmans, D., Turquety, S., Coheur, P.-F., Pommier, M., Hadji-Lazaro, J., Edwards, D. P., Worden, H., Luo, M., Rinsland, C., and McMillan, W.: Carbon monoxide dis-tributions from the IASI/METOP mission: evaluation with other space-borne remote sensors, Atmos. Chem. Phys., 9, 8317–8330, doi:10.5194/acp-9-8317-2009, 2009.
GLOBE task team and others: Hastings, D. A., Dunbar, P. K., El-phingstone, G. M., Bootz, M., Murakami, H., Maruyama, H., Masaharu, H., Holland, P., Payne, J., Bryant, N. A., Logan, T. L., Muller, J.-P., Schreier, G., and MacDonald, J. S. (Eds.): The Global Land One-kilometer Base Elevation (GLOBE) Digital El-evation Model, Version 1.0., National Oceanic and Atmospheric Administration, National Geophysical Data Center, 325 Broad-way, Boulder, Colorado 80305-3328, USA, available at: http: //www.ngdc.noaa.gov/mgg/topo/globe.html (last access: 25 Oc-tober 2012), digital data base on the World Wide Web and CD-ROMs, 1999.
Hase, F., Hannigan, J. W., Coffey, M. T., Goldman, A., H¨opfner, M., Jones, N. B., Rinsland, C. P., and Wood, S. W.: Intercompar-ison of retrieval codes used for the analysis of high-resolution, ground-based FTIR measurements, J. Quant. Spectrosc. Ra, 87, 25–52, 2004.
Hilton, F., Armante, R., August, T., Barnet, C., Bouchard, A., Camy-Peyret, C., Capelle, V., Clarisse, L., Clerbaux, C., Co-heur, P.-F., Collard, A., Crevoisier, C., Dufour, G., Edwards, D., Faijan, F., Fourri´e, N., Gambacorta, A., Goldberg, V., Guidard, V., Hurtmans, D., Illingworth, S., Jacquinet-Husson, N., Kerzen-macher, T., Klaes, D., Lavanant, L., Masiello, G., Matricardi, M., McNally, T., Newman, S., Pavelin, E., Payan, S., P´equignot, E., Peyridieu, S., Phulpin, T., Remedios, J., Schl¨ussel, P., Serio, C., Strow, L., Stubenrauch, C., Taylor, J., Tobin, D., Wolf, W., and Zhou, D.: Hyperspectral Earth Observation from IASI: five years of accomplishments, B. Am. Meteorol. Soc., 93, 347–370, doi:10.1175/BAMS-D-11-00027.1, 2012.
Hurtmans, D., Coheur, P.-F., Wespes, C., Clarisse, L., Scharf, O., Clerbaux, C., Hadji-Lazaro, J., George, M., and Tur-quety, S.: FORLI radiative transfer and retrieval code for IASI, J. Quant. Spectrosc. Ra., 113, 1391–1408, doi:10.1016/j.jqsrt.2012.02.036, 2012.
Maddy, E. S., Barnet, C. D., and Gambacorta, A.: A computation-ally efficient retrieval algorithm for hyperspectral sounders incor-porating priori information, IEEE T. Geosci. Remote Sens. Lett., 6, 802–806, doi:10.1109/LGRS.2009.2025780, 2009.
Mahieu, E., Zander, R., Delbouille, L., Demoulin, P., Roland, G., and Servais, C.: Observed trends in total vertical column abun-dances of atmospheric gases from IR solar spectra recorded at the Jungfraujoch, J. Atmos. Chem., 28, 227–243, 1997.
McMillan, W. W., Barnet, C., Strow, L., Chahine, M. T., Mc-Court, M. L., Warner, J. X., Novelli, P. C., Korontzi, S., Maddy, E. S., and Datta, S.: Daily global maps of carbon monoxide from NASA’s Atmospheric Infrared Sounder, Geophys. Res. Lett., 32, L11801, doi:10.1029/2004GL021821, 2005.
McMillan, W. W., Evans, K., Barnet, C., Maddy, E., Sachse, G., and Diskin, G.: Validating the AIRS Version 5 CO Re-trieval With DACOM In Situ Measurements During INTEX-A and -B INTEX-Authors, IEEE T. Geosci. Remote, 49, 2802–2813, doi:10.1109/TGRS.2011.2106505, 2011.
Notholt, J., Neuber, R., Schrems, O., and von Clarmann, T.: Strato-spheric trace gas concentrations in the Arctic polar night derived by FTIR-spectroscopy with the moon as IR light source, Geo-phys. Res. Lett., 20, 2059–2062, 1993.
Paton-Walsh, C., Jones, N. B., Wilson, S. R., Haverd, V., Meier, A., Griffith, D. W. T., and Rinsland, C. P.: Measurements of trace gas emissions from Australian forest fires and correlations with coincident measurements of aerosol optical depth, J. Geophys. Res., 110, D24305, doi:10.1029/2005JD006202, 2005.
Pommier, M., Law, K. S., Clerbaux, C., Turquety, S., Hurtmans, D., Hadji-Lazaro, J., Coheur, P.-F., Schlager, H., Ancellet, G., Paris, J.-D., N´ed´elec, P., Diskin, G. S., Podolske, J. R., Holloway, J. S., and Bernath, P.: IASI carbon monoxide validation over the Arctic during POLARCAT spring and summer campaigns, Atmos. Chem. Phys., 10, 10655–10678, doi:10.5194/acp-10-10655-2010, 2010.
Pougatchev, N. S. and Rinsland, C. P.: Spectroscopic study of the seasonal variation of carbon monoxide vertical distribution above Kitt Peak, J. Geophys. Res., 100, 1409–1416, 1995.
Pougatchev, N. S., Connor, B. J., and Rinsland, C. P.: Infrared mea-surements of the ozone vertical distribution above Kitt Peak, J. Geophys. Res., 100, 16689–16697, 1995.
Rinsland, C. P., Jones, N. B., Connor, B. J., Logan, J. A., Pougatchev, N. S., Goldman, A., Murcray, F. J., Stephen, T. M., Pine, A. S., Zander, R., Mahieu, E., and Demoulin, P.: Northern and southern hemisphere ground-based infrared spectroscopic measurements of tropospheric carbon monoxide and ethane, J. Geophys. Res., 103, 28197–28218, doi:10.1029/98JD02515, 1998.
Rinsland, C. P., Luo, M., Logan, J. A., Beer, R., Worden, H., Ku-lawik, S. S., Rider, D., Osterman, G., Gunson, M., Eldering, A., Goldman, A., Shephard, M., Clough, S. A., Rodgers, C., Lam-pel, M., and Chiou, L.: Nadir measurements of carbon monox-ide distributions by the Tropospheric Emission Spectrometer in-strument onboard the Aura Spacecraft: overview of analysis ap-proach and examples of initial results, Geophys. Res. Lett., 33, L22806, doi:10.1029/2006GL027000, 2006.
Rodgers, C. D.: Inverse Methods for Atmospheric Sounding – The-ory and Practise, Vol. 2 of Series on Atmospheric, Oceanic and Planetary Physics, World Scientific, Singapore, ISBN-981-02-2740-X, 2000.
Rodgers, C. D. and Connor, B. J.: Intercomparison of re-mote sounding instruments, J. Geophys. Res., 108, 4116, doi:10.1029/2002JD002299, 2003.
Schneider, M., Blumenstock, T., Chipperfield, M. P., Hase, F., Kouker, W., Reddmann, T., Ruhnke, R., Cuevas, E., and Fischer, H.: Subtropical trace gas profiles determined by ground-based FTIR spectroscopy at Iza˜na (28◦N, 16◦W): Five-year record, error analysis, and comparison with 3-D CTMs, Atmos. Chem. Phys., 5, 153–167, doi:10.5194/acp-5-153-2005, 2005.
Senten, C., De Mazi`ere, M., Dils, B., Hermans, C., Kruglanski, M., Neefs, E., Scolas, F., Vandaele, A. C., Vanhaelewyn, G., Vigouroux, C., Carleer, M., Coheur, P. F., Fally, S., Barret, B., Baray, J. L., Delmas, R., Leveau, J., Metzger, J. M., Mahieu, E., Boone, C., Walker, K. A., Bernath, P. F., and Strong, K.: Technical Note: New ground-based FTIR measurements at Ile de La R´eunion: observations, error analysis, and comparisons with independent data, Atmos. Chem. Phys., 8, 3483–3508, doi:10.5194/acp-8-3483-2008, 2008.
Sussmann, R. and Buchwitz, M.: Initial validation of EN-VISAT/SCIAMACHY columnar CO by FTIR profile retrievals at the Ground-Truthing Station Zugspitze, Atmos. Chem. Phys., 5, 1497–1503, doi:10.5194/acp-5-1497-2005, 2005.
Turquety, S., Clerbaux, C., Law, K., Coheur, P.-F., Cozic, A., Szopa, S., Hauglustaine, D. A., Hadji-Lazaro, J., Gloudemans, A. M. S., Schrijver, H., Boone, C. D., Bernath, P. F., and Edwards, D. P.: CO emission and export from Asia: an analysis com-bining complementary satellite measurements (MOPITT, SCIA-MACHY and ACE-FTS) with global modeling, Atmos. Chem. Phys., 8, 5187–5204, doi:10.5194/acp-8-5187-2008, 2008. Turquety, S., Hurtmans, D., Hadji-Lazaro, J., Coheur, P.-F.,
Cler-baux, C., Josset, D., and Tsamalis, C.: Tracking the emission and transport of pollution from wildfires using the IASI CO re-trievals: analysis of the summer 2007 Greek fires, Atmos. Chem. Phys., 9, 4897–4913, doi:10.5194/acp-9-4897-2009, 2009. Velazco, V., Wood, S. W., Sinnhuber, M., Kramer, I., Jones,
N. B., Kasai, Y., Notholt, J., Warneke, T., Blumenstock, T., Hase, F., Murcray, F. J., and Schrems, O.: Annual variation of strato-mesospheric carbon monoxide measured by ground-based Fourier transform infrared spectrometry, Atmos. Chem. Phys., 7, 1305–1312, doi:10.5194/acp-7-1305-2007, 2007.
Vigouroux, C., Hendrick, F., Stavrakou, T., Dils, B., De Smedt, I., Hermans, C., Merlaud, A., Scolas, F., Senten, C., Van-haelewyn, G., Fally, S., Carleer, M., Metzger, J.-M., M¨uller, J.-F., Van Roozendael, M., and De Mazi`ere, M.: Ground-based FTIR and MAX-DOAS observations of formaldehyde at R´eunion Island and comparisons with satellite and model data, Atmos. Chem. Phys., 9, 9523–9544, doi:10.5194/acp-9-9523-2009, 2009.
Winkler, D. M., Pelon, J., and McCormick, M. P.: The CALIPSO mission: Spaceborne lidar for observation of aerosols and clouds, Proc. SPIE, 4893, 1, doi:10.1117/12.466539, 2003.
Zhou, D. K., Larar, A. M., Liu, X., Smith, W. L., Strow, L. L., Yang, P.: Global land surface emissivity retrieved from satellite ultra-spectral IR measurements. IEEE Trans. Geosci. Remote Sens., 49, 1277–1290, doi:10.1109/TGRS.2010.2051036, 2011.