The Effect of Lubricant Derived Ash on the Catalytic Activity of
Diesel Particulate Filters
by
Timothy Quinn Murray
B.S., Mechanical Engineering
McGill University, 2012
MASSACHUSETTS INSTITUTE OF TECMCNLOGYAUG 15 2014
__i-A_ _%iESSubmitted to the Department of Mechanical Engineering in
the Requirements for the Degree of
Partial Fulfillment of
MASTER OF SCIENCE IN MECHANICAL ENGINEERING
AT THE
MASSACHUSETTS INSTITUTE OF TECHNOLOGY
June 2014
2014 Massachusetts Institute of Technology
All rights reserved.
Signature of Author:
Certified by:
Signature
redacted-Deptinient of Mechanical Engineering
May 9, 2014
Signature
redacted
Accepted by:
Victor W. Wong
Principal Research Scientist and Lecturer n Mechanical Engineering
Thesis Supervisor
Signature redacted
The Effect of Lubricant Derived Ash on the Catalytic Activity of
Diesel Particulate Filters
by
Timothy Quinn Murray
Submitted to the Department of Mechanical Engineering on May 9, 2014 in Partial Fulfillment of the Requirements for the Degree of
MASTER OF SCIENCE IN MECHANICAL ENGINEERING
ABSTRACT
A diesel particulate filter (DPF) is an aftertreatment device used to remove hazardous particulate matter (PM) from diesel engine exhaust. Modem emission restrictions have limited the acceptable amount of PM output by diesel engines to the extent that a filtration strategy, such as the use of a DPF, is necessary.
Diesel PM is comprised primarily by black carbon soot. Once trapped in the filter, the soot can be oxidized into CO2 and pass out of the exhaust system during what is referred to as
regeneration. Metallic lubricant additive derived compounds, which make up a small fraction of PM, cannot be oxidized and remain inside the DPF until regular maintenance calls for the removal and cleaning of the filter. The buildup of ash increases the pressure drop across the filter, resulting in a direct fuel penalty to the engine.
The oxidation of soot can be carried out actively at high temperatures or passively at low temperatures with the aid of a catalyst. Active regeneration requires more energy than passive regeneration because the stream of exhaust gas must be heated to a higher temperature. However, catalysts are expensive, and therefore there is a significant additional capital cost associated with catalyzed filters.
The purpose of this research was to investigate the impact of ash accumulation on the catalytic activity of DPFs. The impact was measured experimentally by comparing the ability of two ash loaded DPF samples to promote several chemical reactions (most importantly soot oxidation) to the ability of a previously unused (clean) filter.
It was shown that ash accumulation results in a loss in the catalytic activity of a DPF, as evidenced by a reduced capacity to generate NO2, and promote the catalyzed passive oxidation
of soot. Reduced soot oxidation performance will result in faster accumulation of soot, which increases the pressure drop across the filter and necessitates more frequent regenerations. Both of these results will negatively impact fuel economy.
Thesis Supervisor: Victor W. Wong
ACKNOWLEDGMENTS
My time at MIT has been a challenging and rewarding experience that I will carry with me always. Countless people have helped me along the way, and to all of them I owe a great deal of thanks. I would like to take this opportunity to single out a special few.
My advisor, Dr. Victor Wong, has been a constant source of guidance throughout my degree. I would like to thank him for the opportunity to work on this project, which I believe was both interesting and important. I would also like to thank Dr. Carl Justin Kamp and Dr. Alex Sappok for their direction and advice. Both of them were not only vital technical resources, but also taught me how scientific research should be conducted and strengthened my critical thinking and problem solving skills. I had the privilege of working in a wonderful group; thank you to all of my lab mates: Casey Chiou, Michael Bahr, Yujun Wang, James Jorgenson, Nicholas Custer, and Paul Folino. Additionally, Thane DeWitt and Raymond Phan provided me with a tremendous amount of help setting up and repairing all of the experimental apparatuses used in this study. The research I have conducted would not have been possible without the support of the MIT Consortium to Optimize Lubricant and Diesel Engines for Robust Emission Aftertreatment Systems. Thank you to all current and past members of this organization both for funding my project, as well as all of the invaluable discussions during our meetings.
Finally, and most importantly, I would like to thank my family and friends. To those I've made here in Boston and to those back home, thank you. I could not have done it without you. Thank you to my Mom and Dad, my brothers Andrew and Peter, and my Baba and Grandpa. You got me here. You got me through it. I can't thank you enough.
Table of Contents
A CKN O W LED GM EN TS ... 5
LIST OF FIGU RES ... 9
LIST O F TA BLES... 11
ABBREV IA TION S ... 13
1 IN TRO D U CTION ... 15
1.1 D iesel Engine Fundam entals... 15
1.1.1 D iesel Engine Advantages ... 17
1.1.2 Diesel Engine Applications ... 18
1.1.3 D iesel Engine ... ... 19
1.2 D iesel Em issions Regulations... 21
1.3 Em issions Reductions ... 24
2 D IESEL PA RTICU LA TE FILTERS... 27
2.1 D PF Operation T L...T ... 27
2.2 Regeneration ... 28
2.3 A sh A ccum ulation... 29
2.3.1 A sh Sources ... 30
2.3.2 A sh Transport... 31
2.3.3 Effects of A sh on DPF Pressure D rop ... 32
3 D PF CA TA LY TIC A CTIV ITY ... 35
3.1 CA TA LY ST FUN DAM EN TA LS ... 35
3.2 D PF Catalysts... 37
3.3 Catalyzed Oxidation of Soot ... 38
3.4.2 Catalytic D eactivation through Therm al A ging... 40
3.5 Effects of A sh Accum ulation on DPF Catalysts ... 41
4 EXPERIMENTAL SET-UP AND TECHNIQUES ... 45
4.1 Accelerated Ash Loading System ... 45
4.2 DPF A sh Loaded Sam ples... 47
4.3 DPF Core Sam ple Soot Loading System ... 50
4.4 Catalyst Flow Bench Reactor... 51
4.4.1 Catalyst Flow Bench System Im provem ents ... 54
5 EXPERIM EN TAL TESTIN G AND RESULTS... 57
5.1 Gaseous Conversion in the DPF ... 57
5.1.1 CO + HC + N O Oxidation... 60
5.1.2 CO and H C Conversion... 62
5.1.3 Desorption ... 64
5.1.4 N O Oxidation ... 65
5.1.4.2 Isotherm al N Ox Step Experim ent ... 72
5.2 Soot Oxidation... 75
5.2.1 Tem perature Ram p... 75
5.2.2 Isotherm al Soot Oxidation... 81
6 CON CLU SION S ... 85
6.1 Sum m ation of Results ... 85
6.2 Suggestions for Future Research... 87
7 REFEREN CES ... 89
LIST OF FIGURES
Figure 1.1 Start of Combustion in Gasoline SI vs. Diesel Engine... 16
Figure 1.2 Idealized Otto and Diesel Cycle P-v Diagrams ... 17
Figure 1.3 Diesel Penetration in the EU15 + EFTA (% of new registrations) 1990-2012... 19
Figure 1.4 EPA Heavy Duty Diesel Emissions Regulations ... 22
Figure 1.5 US EPA Tier 3 NMOG + NOx FTP Emissions Standard... 23
Figure 1.6 Diesel Engine Aftertreatment System Configuration... 25
Figure 2.1 Wall-flow and Flow-through Filter Flow Patterns ... 27
Figure 2.2 Depth vs. Cake Filtration Mechanisms17... ... ... . . . 28
Figure 2.3 Percent Oxidation of Carbon vs. Time at Different Temperatures ... 29
Figure 2.4 Ash and Soot Buildup in a DPF ... 30
Figure 2.5 Schematic Representation of Ash Particle Formation and Growth over Repeated DPF 29 Regeneration...31
Figure 2.6 Conceptual Illustration of Ash Distribution in a DPF over Time31... ... ... . . 32
Figure 2.7 Effect of Ash on DPF Pressure Drop ... 33
Figure 2.8 Effect of Soot and Ash on DPF Pressure Drop29...34
Figure 3.1 Effect of Catalyst on Activation Energy ... 36
Figure 3.2 Pictorial Representation of Catalyst Distribution on a DPF Surface ... 37
Figure 3.3 Illustration of Catalyzed Oxidation of Soot... 38
Figure 3.4 SEM Im age of Soot-DPF Interface ... 39
Figure 3.5 Illustration of Catalytic Deactivation via Poisoning/Fouling37 ... ... ... . . 40
Figure 3.6 Illustration of Catalytic Deactivation through Thermal Aging37 . . . .41
Figure 3.7 SEM Image of Ash Coating Catalyst Particles4 2... ... ... ... . 42
Figure 3.8 SEM Images of Stratified DPF-Ash-Soot Layers42... ... .. ... 43
Figure 3.9 Illustration of Ash Layer Impact on Catalytic Reaction 0 ... ... ... . . 43
Figure 3.10 X-Ray CT Image of DPF Core Sample... 43
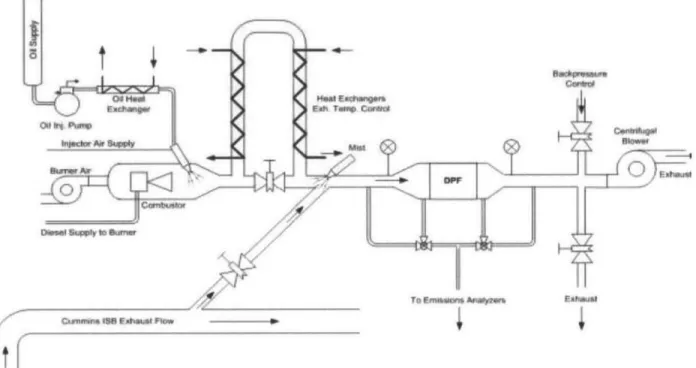
Figure 4.1 Schematic of Accelerated Ash Loading System2... 46
Figure 4.2 Illustration of DPF Core Sample Geometry43 . . . . 49
Figure 4.3 Close-up Image Used to Measure Ash Layer Thickness4 3 . . . 49
Figure 4.6 Schematic of DPF Core Sample Soot Loading Apparatus... 51
Figure 4.7 Schematic of Flow Bench Reactor ... 52
Figure 4.8 DPF Thermal Stability during CO, HC, and NO Oxidation... 53
Figure 4.9 Updated Catalyst Flow Bench Schematic ... 54
Figure 5.1 Simultaneous Conversion of CO, HC, and NO in a DPF... 60
Figure 5.2 NO/NO2 Thermodynamic Equilibrium as Calculated by a Thermodynamic Model4361 Figure 5.3 Ash Effect on CO Oxidation Light-off Temperature ... 62
Figure 5.4 Ash Effect on HC Oxidation Light-off Temperature ... 63
Figure 5.5 Gaseous Emissions from Clean and 12.5 g/L Ash Loaded DPF Desorbed from Surface during Tem perature R am p ... 64
Figure 5.6 NO Oxidation in Clean DPF: Flow Velocity Dependence... 66
Figure 5.7 Ash Effect on NO Oxidation at 20,000 hr-1... 67
Figure 5.8 Ash Effect on NO Oxidation at 40,000 hr-... 67
Figure 5.9 Ash Effect on NO Oxidation at 60,000 hr'... 68
Figure 5.10 Peak NO Destruction for Clean and Ash Loaded Samples at Various Flow Velocities ... . ... ... 6 9 Figure 5.11 X-Ray CT Scans from 42 g/L Ash Loaded DPF Core Sample ... 70
Figure 5.12 X-Ray CT Scan of 12.5 g/L Ash Loaded DPF Core Sample ... 70
Figure 5.13 NO Oxidation at 40,000 hfr1: Velocity Adjusted for Ash Plug Volume ... 71
Figure 5.14 NO Oxidation at 60,000 hr1: Velocity Adjusted for Ash Plug Volume ... 72
Figure 5.15 Clean DPF Isothermal NO Oxidation... ... 73
Figure 5.16 42 g/L Ash Loaded DPF Isothermal NO Oxidation... 73
Figure 5.17 Isothermal NO to NO2 Conversion with increasing NO Concentration...74
Figure 5.18 Direct Measurement of CO2 output from Clean DPF during Regeneration... 76
Figure 5.19 Plot of Formation Rate vs. Temperature for a Clean DPF during Regeneration ... 78
Figure 5.20 Arrhenius Plot: Soot Oxidation Reaction for Clean DPF... 79
Figure 5.21 Arrhenius Plot of Soot Oxidation Reaction: Active Oxygen Mechanism (>525"C) for Clean and 42 g/L Ash Loaded DPFs... 80 Figure 5.22 Arrhenius Plot of Soot Oxidation Reaction: Passive NO2 Mechanism (325-425"C)
Figure 5.23 Isothermal Soot Oxidation Reaction of Clean and 42 g/L Ash Loaded DPFs (10
m in u tes)... 82
Figure 5.24 Isothermal Soot Oxidation Reaction of Clean and 42 g/L Ash Loaded DPFs (1 hour) ... 8 3
LIST OF TABLES
Table 1-1 US EPA Tier 3 PM FTP Emissions Standard 6 ... 23Table 4-1 Accelerated Ash Loading System Parameter Specifications4 3 ... . ... ... . . . 46
Table 4-2 Elemental Analysis of the Test Fuel43 . . . 47
Table 4-3 Elemental Analysis of Test Oil4 3... . . . .. . . 48
Table 4-4 Laboratory-Aged DPF Sample List... 48
Table 4-5 Pramac S5500 Yanmar L100V Generator Specifications ... 50
Table 5-1 Typical Concentrations of Diesel Engine Emissions 8... ... ... . . 58
ABBREVIATIONS
A1203 Alumina (Aluminum Oxide)
ATS Aftertreatment System
C3H6 Propylene (Propene)
Ca Calcium
CARB California Air Research Board
CI Compression ignition
CO Carbon monoxide
CO2 Carbon dioxide
COPD Chronic Obstructive Pulmonary Disease
CT Computed Tomography
DOC Diesel Oxidation Catalyst
DPF Diesel Particulate Filter
DRIFTS Diffuse Reflectance Infrared Fourier Transform Spectroscopy
EGR Exhaust Gas Recirculation
EPA Environmental Protection Agency
FIB Focused Ion Beam
FTIR Fourier Transform Infrared Spectroscopy
HC Hydrocarbon
IC Internal combustion
Mg Magnesium
MIT Massachusetts Institute of Technology
N2 Nitrogen
NO Nitrogen monoxide/nitric oxide
NO2 Nitrogen dioxide
NOx Nitrogen oxides
02 Oxygen
PGM Platinum Group Metal
PM Particulate matter
Pt Platinum
SCR Selective Catalytic Reduction
SEM Scanning Electron Microscopy
SI Spark ignition
SO2 Sulfur Dioxide
SOF Soluble Organic Fraction
TDC Top dead center
TWC Three Way Catalyst
r7fi Indicated Fuel Conversion Efficiency
cp Specific Heat Capacity at Constant Pressure
cV Specific Heat capacity at Constant Volume
rc Compression Ratio
y Heat Capacity Ratio
Ea Activation Energy
AP Pressure Drop (Backpressure)
It Gas Dynamic Viscosity
k Permeability
A Filter Surface Area
Q, t
Volumetric Flow Ratenx Moles of Species 'x'
V Volume
P Pressure
ft Universal Gas Constant
T Temperature
MWc Molecular Weight of Carbon
XC Fraction of Unburnt Carbon
Mei Initial Mass of Carbon
t Arbitrary Time Step
ti Initial Time (Onset of Experiment)
1
INTRODUCTION
The transportation sector comprises roughly 20% of global energy consumption; within the United States of America the figure rises to 28%.1 As the cost of energy continues to increase and the impact of energy usage continues to alter the world's environment it is important to improve the means of reducing the consumption of energy by all available options. The diesel engine is the most energy efficient powerplant among currently available internal combustion (IC) engines, which makes it an attractive option for the transportation sector. In 2012 diesel fuel accounted for 21% of the total fuel used for transportation in the United States of America.' It is the primary fuel in almost all commercial freight operations, and has become a significant portion of the passenger vehicle fleet, particularly in markets, like Europe, which have exceptionally high fuel prices. One major obstacle facing diesel engines is their propensity to output particulate matter (PM) which has been linked to several adverse health effects. Concern for public health has prompted strict emissions regulations limiting the acceptable level of PM output by an engine.
While the operation of a diesel engine can be manipulated to reduce the PM generated, a reduction to zero or near-zero level has not been possible through engine operation strategy alone. Therefore, an aftertreatment device must be employed to remove the particulates from the exhaust stream. The diesel particulate filter (DPF) has emerged as the preeminent filtration technology. DPFs have been employed on virtually every diesel powered engine produced in the United States or Europe since 2007, and have been found to reduce engine-out soot emissions by more than 90%.2 While the existing DPF technology has proven very useful in reducing the output of particulate matter from diesel engines, it has numerous complex effects on engine performance, which has motivated extensive research into the design, operation and durability of the device.This study focuses on the effect of ash on the catalytic activity of diesel particulate filters and the resulting implications for carbonaceous soot oxidation.
1.1 Diesel Engine Fundamentals
The diesel engine was originally conceived and constructed by Rudolf Diesel at the end of the nineteenth century. Since that time there have been significant improvements to its design but the
uses a reciprocating piston within a cylinder coupled to a slider crank mechanism to rotate a shaft. The fundamental difference between a diesel combustion ignition (CI) and a conventional spark ignition (SI) engine is the source of ignition. A diesel relies on the high temperature and pressure of the intake air near the top dead center (TDC) of the compression stroke to auto-ignite the fuel which is injected either directly into the combustion chamber or an adjacent pre-combustion chamber. A gasoline SI engine, on the other hand, initiates pre-combustion with an electrical spark within the air-fuel mixture.
In a gasoline SI engine the flame front will expand quasi-spherically outwards from the spark, combusting the air-fuel mixture which is maintained as nearly stoichiometric. In contrast, the diesel fuel is injected directly into the combustion chamber where it spontaneously combusts due to the high pressure and temperature. Although the overall mixture is lean in a diesel engine, the fuel is atomized during injection into small droplets which locally bum rich as a diffusion flame. As a result soot is formed in the wake of the injected fuel in particularly high concentrations along the spray axis near the injector nozzle.3
I
Iin
g
Figure 1-1 Start of Combustion in Gasoline SI vs. Diesel Engine4
Another major difference between gasoline and diesel engines is the way in which each engine meters its power. An SI engine limits the engine load by throttling the air entering the combustion chamber, whereas a diesel engine restricts the amount of fuel injected. Since there is no fuel in the diesel engine cylinder during compression, there is no risk of inducing early combustion, otherwise known as knock, which is a major limiting factor in the compression ratios of SI engines. As a result, diesel engines are able to operate at compression ratios that are
1.1.1 Diesel Engine Advantages
The primary advantage of the diesel engine as compared to other IC engines is its superior energy efficiency. The operation of both CI and SI engines can be idealized by the Diesel and Otto cycles respectively as depicted by Figure 1-2. It is assumed that the working fluid is an ideal gas with constant cv and cp and that each portion of the cycle occurs at constant pressure, volume, or entropy (isentropic) as shown in Figure 1-2.
Otto Cycle Diesel Cycle
3
4, 2
P 4
2 JSm0' 'C
VV
Figure 1-2 Idealized Otto and Diesel Cycle P-v Diagrams5
Under these idealized conditions the indicated fuel conversion efficiencies of each cycle can be determined, as described by Eq. 1-1 and Eq. 1-2.
Eq. 1-1 1 ?7f,i otto = - _1 Eq. 1-2 7f,i diesel = - r7) [y
1)1
Where: rc - 2 compression ratio V1 Cp Cl, V2For a given compression ratio the SI engine will have the higher efficiency; however, as described in Section 1.1, a diesel engine is able to operate with a higher compression ratio because there is much less risk of knock, and it is therefore able to reach a greater overall efficiency. A typical value for rc of a spark ignition engine is 8-12, while a compression ignition engine can reach values from 12-24.3 Additionally, since a diesel engine always operates lean the value of y is higher than that of an SI engine.3
The heat from combustion is released both earlier and faster in a diesel engine compared to a typical gasoline engine. This has two direct results: first, it generates higher torque at lower speeds, i.e., higher power at low speeds. Since friction is proportional to engine speed there is typically less frictional loss for a diesel engine operating at the same load as a SI engine; second, it demands more robust manufacturing standards, which contribute to higher costs but also greater durability. Often diesel engines are able to operate for over 1 million miles before requiring a total overhaul.6
Diesel engines control their power output by varying the amount of fuel injected into the cylinder as opposed to throttling the incoming air. As a result there is significantly lower pumping loss, which translates to improved efficiency and fuel economy. Overall, diesel engines have been found to exhibit an improvement in fuel economy of 30-35% compared to similar-sized gasoline engines.7
Another advantage of diesel engines is that they produce significantly less pollution as compared to a standard SI engine. Since the combustion mixture is lean, there is ample oxygen available to combust all of the hydrocarbons (HC) and convert any carbon monoxide (CO) to carbon dioxide
(CO2). As a result the concentration of hydrocarbons in diesel exhaust is lower than that of a
standard SI engine by a factor of 5, and the amount of CO emitted is practically negligible.3
1.1.2 Diesel Engine Applications
As a result of its high fuel efficiency and durability the diesel engine has become the powerplant of choice for a wide range of applications. It dominates the transportation of freight by trucks, trains, and boats, accounting for 94% of all goods shipped in the USA.' It is also used in over two-thirds of all agricultural equipment in the USA,' and has been widely used in buses,
While diesel powered personal vehicles have not been widely adopted by American consumers, they constitute a significant and growing portion of the European market. In 2012, 35.9% of all passenger vehicles in use were powered by diesel engines, up 0.6% from 20108 . Figure 1-3
clearly shows the upward trend in diesel car ownership as indicated by the increasing percentage of new vehicle registrations, which has increased from roughly 12% to greater than 50% in the last 20 years.
60
400
211
194* 1491 19WI 19W9 194 19t 1996 199 19 1999 MCI 2001 2002 Z913 2001 b 20( 20M1 21,6 2009 1110 'AA) 2012
Figure 1-3 Diesel Penetration in the EU15 + EFTA (% of new registrations) 1990-20128
1.1.3 Diesel Engine Emissions
The fundamental purpose of an IC engine is to convert the chemical energy stored in fuel to useful mechanical work. This purpose is achieved by harvesting the energy released during a combustion reaction between hydrocarbons and oxygen present in the air. The simplest form of this combustion reaction is shown in Eq. 1-3.
Eq. 1-3
b b
CaHb + c(02 + 3.76N2) -+ aCO2 +-H 20 + c - a -4) 02 + c(3.76)N2
Since the fuel is injected into the air directly before combustion there is little time for mixing, and a homogeneous charge is virtually impossible. As a result, as more fuel is added to the mixture, i.e., approaching stoichiometric conditions, it becomes difficult to utilize all of the available oxygen resulting in incomplete combustion and the production of excessive amounts of soot. To combat this, the mixture is always operated lean so that there is ample oxygen available
to combust all of the fuel. Thus in Eq. 1-3 c > a + b. At full load diesel engines generally
maintain a fuel/air ratio greater than 20% above stoichiometric.3
hydrocarbons (HC), nitrogen oxides (NOx), and particulate matter (PM). Carbon monoxide (CO) is also produced, but as noted in Section 1.1.1, the concentrations are very low.
Hydrocarbons found in diesel exhaust are the result of unburnt or partially decomposed fuel and, to a lesser extent, burnt lubricating oil that has formed a film layer on the cylinder walls.9 As described in Section 1.1.1, HC emissions are generally significantly lower than those of an SI engine. In a CI engine the overall mixture is lean, so there should be sufficient oxygen to fully react the fuel. An SI engine, which oscillates between rich and lean on a cycle to cycle basis, will produce more HC during individual rich combustion events. Additionally, since there is no fuel in the cylinder of a CI engine before injection, fuel does not get trapped in the crevice volumes within the cylinder to be released during the expansion and exhaust stroke; whereas, in an SI engine, fuel trapping does occur and is a major source of HC emissions.
NOx refers to oxides of nitrogen primarily in the form of nitrogen monoxide, i.e., nitric oxide (NO), which accounts for 70-90% of the total NOx in diesel exhaust, and nitrogen dioxide (NO2), which makes up the bulk of the remaining NOx.9 NO forms within the high temperature
burned gas, preferentially in regions where the heterogeneous mixture is near stoichiometric.3 The amount of NOx produced by a diesel CI engine is comparable to that of a gasoline SI engine;3 however, since the exhaust from a diesel engine is lean the NOx cannot be converted to nitrogen and oxygen via a three way catalyst (TWC) or catalytic converter as on a typical
gasoline engine.
Particulate matter comprises all solid materials entrained in the flowing exhaust gas. It primarily consists of agglomerates made up of solid carbon and lubricant derived ash (approximately 54% by mass), soluble organic fraction (SOF) (approximately 32% by mass), and sulfates (approximately 14% by mass).10 Additionally, trace amounts of iron particles resulting from engine wear and even dust or debris from the intake air can be found as PM in the exhaust. Soot, which makes up the vast majority of solid particles that are trapped in diesel particulate filters, is formed in fuel-rich regions of the unburned flame, particularly at the centerline of the injection spray.
emissions; this challenge is typically referred to as the NOx-PM trade-off Many strategies used to reduce NOx emissions, such as retarded ignition timing or reduced combustion temperatures through exhaust gas recirculation (EGR), result in increased PM emissions." Similarly, many techniques used to decrease PM will result in increased NOx. Of course, these emissions reduction strategies are also coupled to engine performance, which increases the complexity of the problem.
1.2 Diesel Emissions Regulations
Diesel emissions have a significant adverse effect on human health. Diesel particulate matter is a known carcinogen; it has been linked to numerous respiratory health issues including asthma, lung cancer, and chronic obstructive pulmonary disease (COPD).12 NO
2 is a powerful toxin that
causes a pulmonary edema - the buildup of fluid in the air sacs of the lungs - in concentrations as low as 5 ppm.13 Nitric oxide (NO) on its own acts as an irritant to the eyes and lungs, but is even more dangerous due to its instability in air which causes it to spontaneously react to form highly toxic NO2. Research reports indicate that 80 ppm NO would form 5 ppm of NO2 in only 3
minutes. 13
In addition to their direct effect on humans, diesel emissions alter the natural environment. NOx reacts with volatile organic compounds to form ground level ozone, otherwise known as smog, and particulate matter contributes to haze in the air and increases the acidity of lakes, streams, and soil in which it settles. '4 Soot will also exhibit a significant greenhouse effect due to its
ability to re-radiate heat.
Concern over the adverse health and environmental effects of diesel engine exhaust has resulted in strict emissions regulations that have been consistently tightened since 1990. These regulations are controlled nationally in the United States by the Environmental Protection Agency (EPA), as well as by each individual state, which is free to implement stricter policies than those enacted on the national level. The state of California has been particularly active in passing legislation tightening emissions restrictions, which are managed by the California Air Research Board (CARB).
of these sectors has seen the acceptable levels of PM, HC, NOx, and CO drop gradually over time allowing for technological innovation to achieve the necessary standards. The acceptable level of sulfur in diesel fuel has also been dramatically reduced to ensure the sulfur does not poison the catalysts in aftertreatment systems (ATS). Between 2006 and 2010 ultra-low sulfur diesel (ULSD), which limits the acceptable level of sulfur content in fuel to 15 ppm, was adopted
as the standard fuel grade for all diesel in the USA.
Currently all engines in the USA must adhere to the EPA's Tier 2 standard that was phased in between 2004-2009. The heavy duty diesel emissions regulations over this period and before have been summarized below in Figure 1-4. The acceptable levels of both particulates by mass and noxious emissions have been reduced by more than an order of magnitude over that period.
Figure 1-4 EPA Heavy Duty Diesel Emissions Regulations1 5
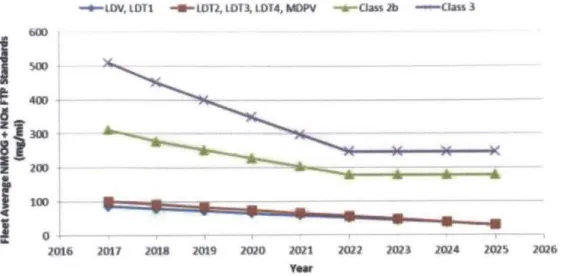
On March 3, 2014 the next stage of emission standards, Tier 3, was signed into law, and is scheduled to be phased in from 2017-2025. It will further reduce acceptable levels of NOx, PM, and HC to levels similar to those imposed by the CARB. The combined non-methane organics (NMOG) and NOx emissions limits are displayed in Figure 1-5.
- o-LDV, L OT -- LOT, LDT3 LDT4, MOPV -O-ctass 2b -CL--ass 3 600 40D 0-M06 20n I 201f 1019 2M2 201 012 1023 IM24 20 2026 YOWr
Figure 1-5 US EPA Tier 3 NMOG + NOx FTP Emissions Standard1
Under the Tier 3 standard, PM is to be limited to 3 mg/mi per vehicle over the FTP -75 testing standard. Unlike NOx emissions, in which a fleet average is computed for each manufacturer, each vehicle must be certified to meet this standard individually. In order to allow for the phase-in period for new technology the percentage of new vehicles sold that must adhere to this standard will be increased from a modest 20% in 2017 to full compliance in 2021. During this phase-in period a less rigorous standard of 6 mg/mi will be considered acceptable, but re-certification would be required by 2022. Full details of the adoption schedule are outlined in Table 1-1.
Table 1-1 US EPA Tier 3 PM FTP Emissions Standard16
Year 2017 2018 2019 2020 2021 2022 % of Sales % 20 20 40 70 100 100 Certification Standard mg/mi 3 3 3 3 3 3
In-use Standard mg/mi 6 6 6 6 6 3
Hydrocarbon and carbon monoxide emissions are also regulated for diesel engines in the same way as they are for SI engines, but since their output is significantly lower there is no difficulty in meeting these standards.
1.3 Emissions Reduction Methods
There are two effective ways to reduce engine emissions: (1) improved design of the engine to reduce in-cylinder production of emissions, and (2) utilization of aftertreatment devices designed to clean up the exhaust before being emitted to the atmosphere. In either case, it is essential to consider not only the effectiveness of the technique in reducing emissions, but also its overall impact on engine performance.
A number of techniques have been employed to reduce in-cylinder production of emissions. For example, engine geometry in the intake port and cylinder has been optimized to increase the degree of turbulence in the intake air and thereby improve the mixing/dispersal of the fuel; these measures result in a reduction of the amount of PM generated. As mentioned in Section 1.1.3, delayed ignition timing and EGR can be used to lower combustion temperatures, reducing the NOx generated during combustion.
Despite major improvements in diesel engine design, it has thus far not been possible to reach modem emissions expectations through this strategy alone, and therefore it has been necessary to develop aftertreatment systems. The purpose of these systems is similar to that of a catalytic converter on an SI engine, but the excess oxygen resulting from lean combustion in a diesel engine makes the operation of the gasoline three way catalyst (TWC) impossible.
A standard diesel aftertreatment system is divided into three separate devices, each designed to accomplish one task. The typical arrangement of these components is depicted in Figure 1-6. First, the exhaust gas passes through a diesel oxidation catalyst (DOC), a flow-through filter that utilizes platinum group metal (PGM) catalysts to oxidize any remaining hydrocarbons, carbon monoxide, and much of the SOF on the PM while also converting a significant portion of the NO to NO2. Next, the flow enters the diesel particulate filter (DPF), the primary function of which is
to remove all particulate matter from the exhaust. DPFs will be discussed extensively in Section
2. Finally, the exhaust passes through a NOx conversion device, the most common of which is
selective catalytic reduction (SCR). SCR utilizes a vanadia and zeolite based catalyst to convert NOx to nitrogen and water through a reaction with ammonia that is introduced upstream of the device in the form of urea.
Ur"a
En9k* out
C EJc
HC NONO
co PM NOX
PM
2 DIESEL PARTICULATE FILTERS
Diesel particulate filters (DPF) have emerged as the preferred aftertreatment device used to remove solid particulate matter from CI engine exhaust. First introduced in 1985 in the Mercedes-Benz 300D 3.0 turbodiesel sold in California, the device was not widely used until the early 2000s. They are now found on every diesel engine produced in the USA since 2007. The success of the DPF is primarily due to its excellent ability to filter solid particulates, reducing engine out soot by over 90%, as well as its excellent thermal and mechanical durability. 2
2.1 DPF Operation
Several DPF designs have been explored since its initial introduction, but the ceramic wall-flow monolith is by far the most widely used technology today. This style of filter consists of a honey-comb structure of small channels that are parallel in the axial direction and alternatively capped on each end to produce a checkerboard pattern. As shown in Figure 2-1, the caps on the wall-flow filter force the wall-flow to pass through the porous walls; this is unlike that of the wall-flow-through filter in which the flow passes straight through. The filter itself typically consists of a cordierite or silicon carbide substrate that is coated with an inert base-metal washcoat layer and which may or may not be loaded with PGM catalyst particles. The pores of the substrate are large enough to allow the exhaust gas to flow through with minimal pressure drop, while they are small enough to physically block and trap particulate matter.
Wall-flow Flow-through
Figure 2-1 Wall-flow and Flow-through Filter Flow Patterns'7
Particulate matter deposits on the wall of the filter via two distinct mechanisms: deep-bed (i.e., depth filtration) and cake filtration. During soot loading the filter will first experience deep bed penetration as PM is deposited inside the surface pores of the filter. Once a sufficient amount of soot builds up, the PM will begin to form a cake layer above the filter surface. This soot layer remains permeable to the flow of exhaust gas as the cake itself is also porous. Deep-bed filtration
is particularly costly to the filter in terms of pressure drop since it is filling and covering pores which reduces or restricts the possible pathways for exhaust flow.
porous barrier
. particle
*4
t
Depth Filtration Cake Filtration (Sieving) Figure 2-2 Depth vs. Cake Filtration Mechanisms17
As the PM builds up in the filter it further obstructs the flow of exhaust, increasing the pressure drop across the filter, and reducing the fuel economy of the engine. The soot can be removed from the filter through oxidation - otherwise known as "regeneration." This can be done either actively by oxidizing the soot at high temperatures using oxygen or passively through catalyzed oxidation of the soot using NO2.
2.2
Regeneration
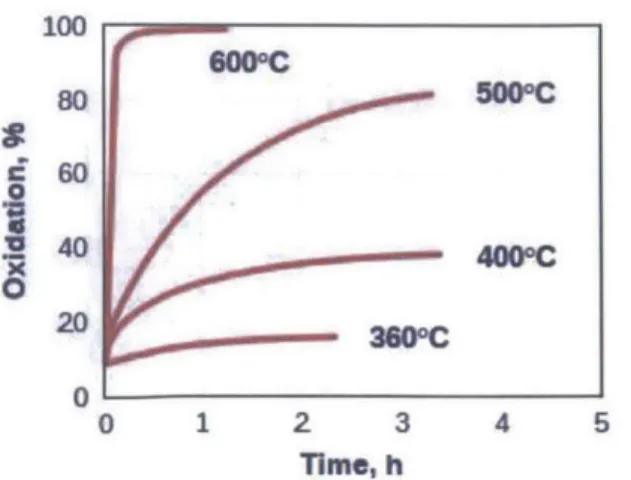
Active soot regeneration, as described by Eq. 2-1, is primarily used in a periodic cycle. Once a certain level of soot loading is reached, regeneration is induced by spiking the temperature of the exhaust gas. Figure 2-3 illustrates the strong dependence of active regeneration on temperature. Light-duty diesel engine exhaust is typically as low as 100-250C,S'l9 but in order to ensure
timely and complete oxidation it is necessary to achieve temperatures as high as 600'C. This can be achieved in a number of ways, the most common of which is to inject extra fuel either directly into the cylinder post-injection or into the exhaust. In either case the excess HC is exothermically oxidized in the DOC upstream of the DPF, causing an increase in the exhaust temperature. Though effective, active regeneration requires a significant amount of energy to increase filter temperature to the required level, and that results in a direct fuel penalty.
Eq. 2-1
100 80 39W% j60 ~40 4000C 20
gg
0 0 1 2 3 4 5 Time, hFigure 2-3 Percent Oxidation of Carbon vs. Time at Different Temperatures2 1
Passive regeneration, as described by Eq. 2-2, is achieved at much lower temperatures through the use of
NO2 instead of 02 to oxidize the PM. It has been found that soot can be converted to CO2 at temperatures
as low as 250*C using the NO2 mechanism. If the exhaust temperatures through the DPF are sufficiently
hot enough during regular operation the soot may be oxidized continuously without the need to periodically spike the temperature. If not, additional fuel must be consumed to increase the temperature, but the penalty will be much lower than that of active regeneration since it requires significantly less energy. The major drawback of passive regeneration is the additional up-front cost associated with adding a catalyst.
Eq. 2-2
C+2N02 *C0 2 +2NO
2.3 Ash Accumulation
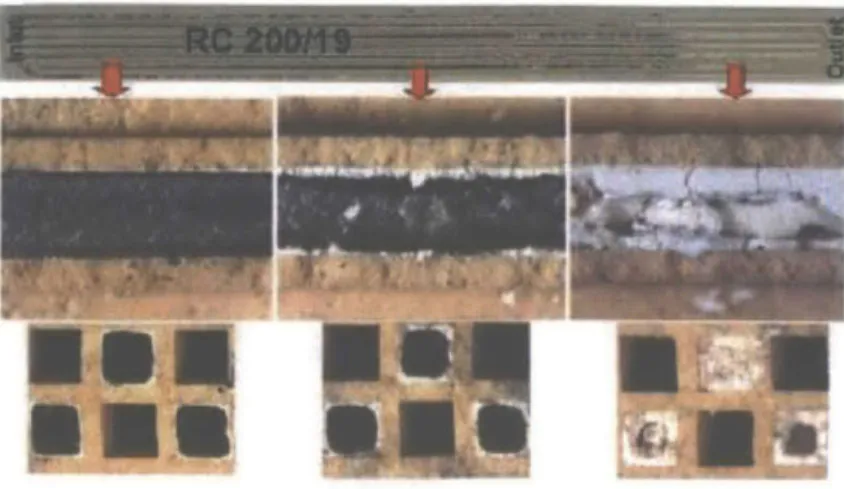
In addition to the carbonaceous soot, PM also contains incombustible ash compounds that cannot be removed from the filter during regeneration. Although the ash accounts for only 1% of the engine-out PM by mass,22 after 150,000 miles of operation the ash can constitute as much as 80% of the matter trapped in the filter.23 As seen in Figure 2-4, ash builds up both along the wall of the filter and as a plug at the outlet. The buildup of ash serves to increase the obstruction of exhaust gas flow thereby increasing the backpressure in the filter causing a reduction in fuel economy. To combat this, the filter must be regularly serviced to remove the ash. The increase in pressure drop is well documented, and continues to be an active area of research; this study, however, will focus on the effect of the ash on the catalytic activity of the filter, which could
Figure 2-4 Ash and Soot Buildup in a DPF2 4
2.3.1 Ash Sources
Almost all of the ash found in a DPF originates from lubricant additives that are necessary to ensure proper operation and durability of the engine. These additives are present in a number of different forms: detergents, dispersants, anti-oxidants, anti-wear additives, and friction modifiers. They are commonly magnesium (Mg), calcium (Ca), and zinc (Zn) based which end up as ash in the form of sulphates, phosphates, or oxides.24 In an effort to minimize the amount of ash that is introduced to the system, limits have been placed on the acceptable level of sulfated ash (1.0%), phosphorous (0.12%), and sulfur (0.4%) content in lubrication oils.25
The most significant mechanism in the transfer of ash compounds from the lubricating oil to the DPF is through the power cylinder. A small layer of oil is swept up past the piston rings into the cylinder where it is oxidized during combustion. In addition to being the major pathway for ash transfer, this is also the major source of oil consumption in the engine. The ash loading rate is proportional to engine oil consumption; however, it is less than would be predicted by the ash content of the oil alone. Ash capture efficiencies have been reported in literature between anywhere from 5 to 65%,24,25,26,27 and are dependent on both the composition of the oil and the engine itself. The variations can be attributed to two major factors: first, the ash containing additive compounds are less volatile than the base oil and are therefore less readily reacted, and second, some of the ash will deposit on the exhaust stream components upstream of the DPF. In addition to the lubricant derived ash, there are several other sources of particulate matter that may end up in the DPF. Iron and other metallic compounds resulting from engine wear or rust
can be entrained in the exhaust flow, as can fragments of the upstream DOC washcoat, substrate, or even its catalyst particles.2 2,2 8
2.3.2 Ash Transport
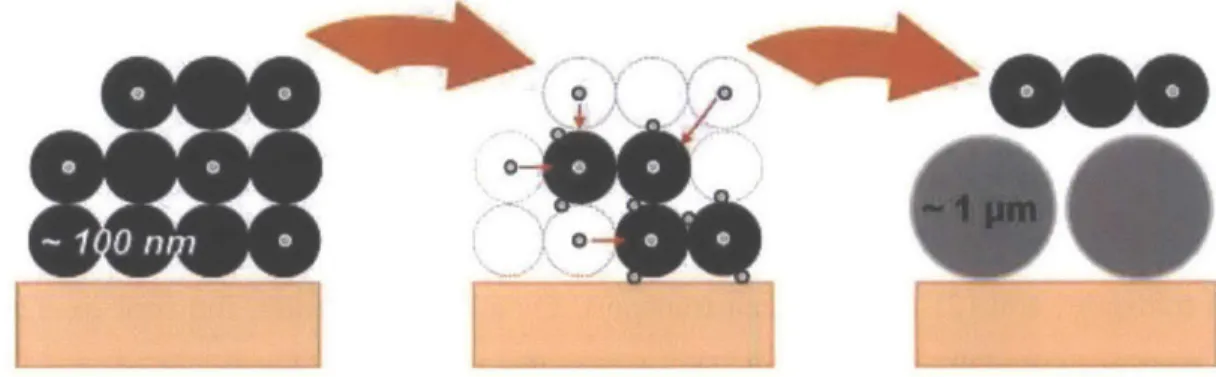
Ash enters the DPF bound to the soot particles as small precursors which have been observed in different size ranges, all significantly smaller than soot. 29,30 Over the course of even a single
regeneration event, the precursors are brought together and combine to form primary particles, which are reported to be an order of magnitude greater in size (0.5-2 pm).2 2 Over time these primary particles continue to agglomerate, resulting in large ash particles as large as 5-50 pim.
0
Figure 2-5 Schematic Representation of Ash Particle Formation and Growth over Repeated DPF Regeneration29
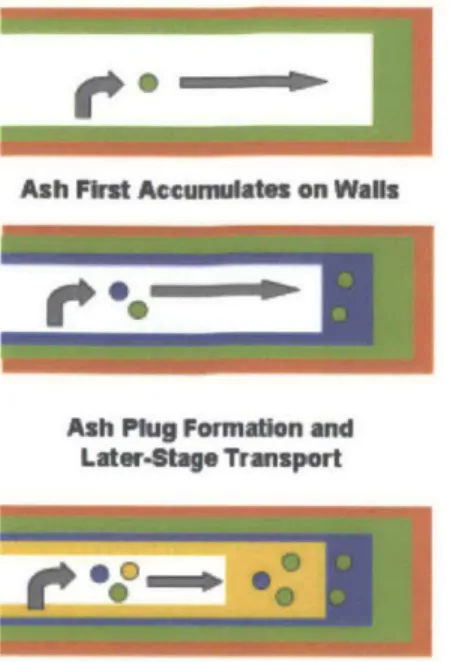
As observed in Figure 2-4, the ash is deposited both as thin layer along the wall of the filter as well as a plug on the outlet side. A 2011 study used additive tracers to show that the buildup of ash, in both the wall layer and plug, is deposited in stratified layers.3' Figure 2-6 illustrates the
distribution of ash in a DPF over time. Initially the wall layer builds up fairly evenly over the entire available surface area of the filter. Once a layer of critical thickness is attained ash is preferentially swept to the rear of the filter where it forms the plug.
Ash FIrst Accunuiatus on Walls
Ash Plug Formation and Latr-4tags Transport
Figure 2-6 Conceptual Illustration of Ash Distribution in a DPF over Time3 1
Two primary factors result in the mobility of ash from the wall layer to plug: (1) regeneration induced transport, and (2) flow induced transport. On a catalyzed filter, the soot oxidizes from the side nearest to the DPF wall inward. This means that the soot that has the greatest contact and adhesive forces with the DPF wall is removed first, leaving behind soot that is less strongly bound to the surface. As these adhesive forces lessen, it becomes easier for the remaining soot to be entrained by the flow and transferred to the rear of the filter. This is the cause of regeneration induced transport. Flow induced transport is the result of elevated exhaust speeds that increase the shear force on the soot particles beyond the forces holding the particles in place. Both of these mechanisms have been observed to result in PM transport from the wall layer to the rear of the filter.32 Recent literature indicates that the thickness of the soot layer at the commencement of regeneration plays a large role in determining the mobility of the soot and ash. If the layer is thin, the PM is more likely to remain adhered to the rough surface of the DPF, and thus it is expected that a larger soot layer during regeneration would result in a larger ash plug.3 2
2.3.3 Effects of Ash on DPF Pressure Drop
The addition of any obstruction to flow in the exhaust stream will result in a backpressure on the engine. In order to overcome that backpressure, the engine must expend usable work which could otherwise be used to produce the desired mechanical work output by the driveshaft. A DPF on its own produces a small backpressure, which hinders engine performance slightly, but the
effect is intensified by the presence of particulate matter. It is estimated that an increase of 10 kPa of backpressure could result in a decrease in fuel economy of 1.5-2.5% for a turbocharged engine and a 3-4.5% decrease in a naturally aspirated engine.33
The pressure drop through a porous medium is governed by Darcy's Law (Eq. 2-3).
Eq. 2-3
AP= Q
kA
Where,
AP = Pressure drop (backpressure)
y = Fluid viscosity
k = Permeability
A = Filter area
Q =
Volumetric flow rateBoth the ash layer and the plug serve to increase the pressure drop across the filter. The ash layer penetrates and blocks pores reducing the permeability (k) of the DPF substrate and therefore increasing the backpressure. It also creates a porous layer through which the flow must pass. The ash plug entirely fills the end of each channel which reduces the effective volume of DPF. Essentially the DPF is made shorter by the length of the plug, reducing the filter area (A) through which the exhaust gas flows.
30 CJ.4 (2) ~25 20 050 00 I I 0 5 10 15 20 25 30 35 40 45
Ciumumie8* Ash Load 1yt.
Equait Hours 5,9- tEs
Figure 2-7 depicts the backpressure response of a DPF to increasing ash load up to a simulated 240,000 miles. Two samples were aged using an accelerated aging apparatus under using periodic active regeneration conditions using standard CJ-4 certified oil.3 4 The initial steep increase in pressure drop is the result of deep-bed penetration of the ash. After roughly 5 g/L of ash has accumulated on the filter there is no longer any penetration of the DPF pores, and the wall layer begins to form. Beyond this point the backpressure slowly increases as both the wall layer thickness and the plug length grow.
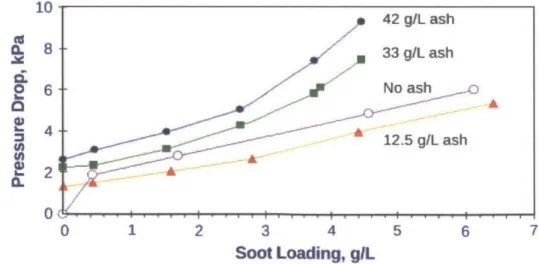
The addition of ash can both increase and decrease the pressure drop across the DPF depending on the extent of the ash load, as seen in Figure 2-8. At a low ash load the pressure drop resulting from soot accumulation is less than that of the clean filter.2 9 This occurs because the ash has already started to form a porous layer which, in itself, acts as a filter. As a result the soot cannot penetrate the pores of the DPF substrate, thereby stopping any deep-bed penetration. Since ash is composed of larger agglomerate particles it has a higher porosity and a lower packing density than the soot. Therefore, filling the surface pores with ash instead of soot translates to a comparative reduction in pressure drop. In contrast, the backpressure experienced at a high ash load resulting from soot is greater than that of the clean filter. This occurs because as the ash layer and plug continue to grow, their effects continue to increase until they are more dominant than the reduction of pressure drop due to the lack of deep-bed penetration.
10 42 gIL ash 8 *33 g/L ash 6 No ash a A 42.5 g/L ash A-2A 0 1 2 3 4 5 6 7 Soot Loading, gl
3 DPF CATALYTIC ACTIVITY
Most modem diesel particulate filters utilize both passive and active regeneration to ensure total oxidation of the trapped carbonaceous soot. In a typical system the exhaust gas temperature is maintained throughout the DPF such that passive oxidation of the soot will occur continuously; however, due to fluctuations in the operating conditions of the system that may result in more soot being generated than can be continuously oxidized, periodic active regeneration is also employed when a sufficiently large pressure drop is measured across the filter, or after a predetermined number of miles driven.
The purpose of this study is to consider the effect of ash on the ability of the catalyst to carry out passive oxidation of soot. If the effectiveness of the catalyst is compromised, it would increase the speed at which PM is built up in the filter, causing the backpressure to increase at a faster rate, and resulting in the need for more frequent active regeneration events. Both of these consequences result in a direct fuel penalty.
3.1 CATALYST FUNDAMENTALS
A chemical reaction can be accurately described by the Arrhenius Equation (Eq. 3-1), which relates the rate of a reaction (k) to the temperature (T). It is also dependent on the pre-exponential factor (A), which is an empirically derived factor having the same units as the rate constant (s-1 for a first order reaction). The pre-exponential factor is related to the frequency with which the molecules undergoing reaction will collide, and the likelihood that during a collision they are in the necessary orientation to react. The activation energy (Ea) is a measure of the required energy that must be overcome in order for a reaction to proceed. This energy threshold is dependent on the total reaction mechanism, i.e., the series of elementary reactions that occur during the global reaction from initial reactants to final products.
Eq. 3-1
k = A e RT
Where:
A = Pre-exponential factor
Ea = Activation energy
? = Universal gas constant
T = Temperature
A catalyst is any material that alters the rate of a chemical reaction without being consumed or produced. Catalysts are said to be homogeneous if they are in the same phase as the reactants and heterogeneous, as in a DPF, if they are in different phase. A positive catalyst will speed up reactions by reducing the activation energy of the reaction mechanism as represented graphically in Figure 3-1. In the presence of a catalyst, the series of intermediate steps undergone during the overall global chemical reaction is altered such that less input energy is required to cause the reaction to proceed. When used in a DPF, this means that less fuel energy needs to be consumed in order to drive the reaction forward. Catalytic activity is used to describe a catalyst's ability to increase the rate of a given reaction; the more a catalyst increases the reaction rate the more active it is said to be.
A
Uncatalysed
---Reaction Activation Energy Uncatalysed Reaction ReactionAcfivation Energy
Catalysed
Reaction Reactants Products Extent of ReactionFigure 3-1 Effect of Catalyst on Activation Energy3 6
A substance's interaction with a heterogeneous catalyst occurs in three intermediate steps: (1) adsorption onto the catalyst surface, (2) chemical reaction, and (3) desorption. Each of these steps requires a different amount of input energy in order to proceed. The step with the highest
reaction. The apparatuses used in this research, which will be described in Section 4, were not equipped to distinguish between these different phenomena, and so the results generated represent only the combined effect of these three steps.
3.2DPF
Catalysts
As described briefly in Section 2.2, DPFs utilize catalysts to reduce the required energy needed to oxidize the soot collected within them. Although fuel-born catalysts in the form of vanadium oxide, ceria or iron oxide have been used in some instances, the vast majority of passive emission control systems employ solid phase catalyst particles that are deposited on the washcoat layer, typically comprised of Alumina (Aluminum Oxide A1203) that coats the filter substrate.
The function of the washcoat is twofold: (1) it controls the porosity of the substrate and (2) it increases the filter surface area, enabling the best dispersion of catalyst particles. The catalyst is dispersed as very fine particles in order to maximize the available active catalyst surface area for a given mass of catalyst used. Small particles are desirable because the ratio of surface area to volume increases as the particle size decreases.
Pt Q AJ203 Substrate
Figure 3-2 Pictorial Representation of Catalyst Distribution on a DPF Surface3 7
DPF catalyst particles are most commonly made of platinum (Pt), which is highly active in the oxidation of soot as well as of CO and HC. Other platinum group metals, such as palladium, rhodium, and ruthenium, have been used as a substitute, but their usage is rare. In addition to their extremely high cost and tendency to sinter, a major drawback of PGM catalysts is their propensity to produce sulfate particulates that can poison the catalyst. This was the major factor that motivated the switch to ultra-low sulfur diesel, which has effectively solved the sulfur poisoning problem. Base metals like Vanadium, iron, and copper have also been employed as
DPF catalysts, particularly before the introduction of ULSD, because they do not produce sulfates; however, they are significantly less active than PGM catalysts in the oxidation of soot.38
3.3 Catalyzed Oxidation of Soot
As described in Section 1.1.3, the two largest components of engine out PM emissions are carbonaceous soot and the SOF. The first catalyzed oxidation of this material occurs upstream of the DPF in the DOC. There, the Pt catalysts are able to convert almost all of the SOF, which is significantly more volatile than the carbonaceous soot. As a result, the particulates that deposit within the DPF are almost entirely elemental carbon.
The primary mechanism for the catalytic oxidation in DPFs is through the use of gaseous NO2.
NOx molecules in the exhaust are converted from NO to NO2 on the Pt catalyst surface and
upstream in the diesel oxidation catalyst (DOC), enabling the oxidation of the carbonaceous soot via the chemical reaction described by Eq. 2-2. As depicted in Figure 3-3, the NO to NO2
conversion occurs on the catalytically active sites and then back diffuses against the direction of bulk flow to reach the soot molecules. Once the NO2 is converted back to NO it may cycle back
to the catalyst to undergo the same reaction again. It is theorized that a single NOx molecule may be recycled in this way many times before eventually passing through the filter. As expected soot oxidized via this mechanism has a significantly lower activation energy (39-60 kJ/mole) than that of uncatalyzed oxidation using oxygen (105-207 kJ/mole).3 9,40,41
"Vcc We soot odade by N 2 Cs y 02 NO +00 M 2ID I 02 Co NO +0 2 y2 NoCO7 NO+02
2NO+02 2N 2 [NO-02f plu"""
Figure 3-3 Illustration of Catalyzed Oxidation of Soot42
Another mechanism for soot oxidation is the oxygen spillover reaction, also depicted in Figure 3-3.19 An oxygen molecule is able to dissociate on the catalyst surface, and then each individual
A recent study has shown that this mechanism requires direct contact between the soot and catalyst particles in order for the reaction to occur.43 In an oxygen rich environment without any NOx carbon failed to oxidize when separated from the catalyst by a thin non-reactive substance.4 3 When the interface between soot and the DPF washcoat is observed, as in Figure 3-4, a clear physical separation is visible. Since the soot and catalysts do not maintain direct contact, the oxygen spillover mechanism will likely contribute very little to soot regeneration.
Soot
DPF
Figure 3-4 SEM Image of Soot-DPF Interface44
3.4 Modes of Catalyst Deactivation
The deactivation modes of a solid particle catalyst can be divided into two primary mechanisms: the covering or masking of active sites through the introduction of outside material and the changing of the catalyst/substrate surface resulting from thermal aging. Both of these modes are prevalent in a DPF, and play an important role in its ability to effectively regenerate over its lifetime.
3.4.1 Catalytic Deactivation through Physical Masking/Poisoning
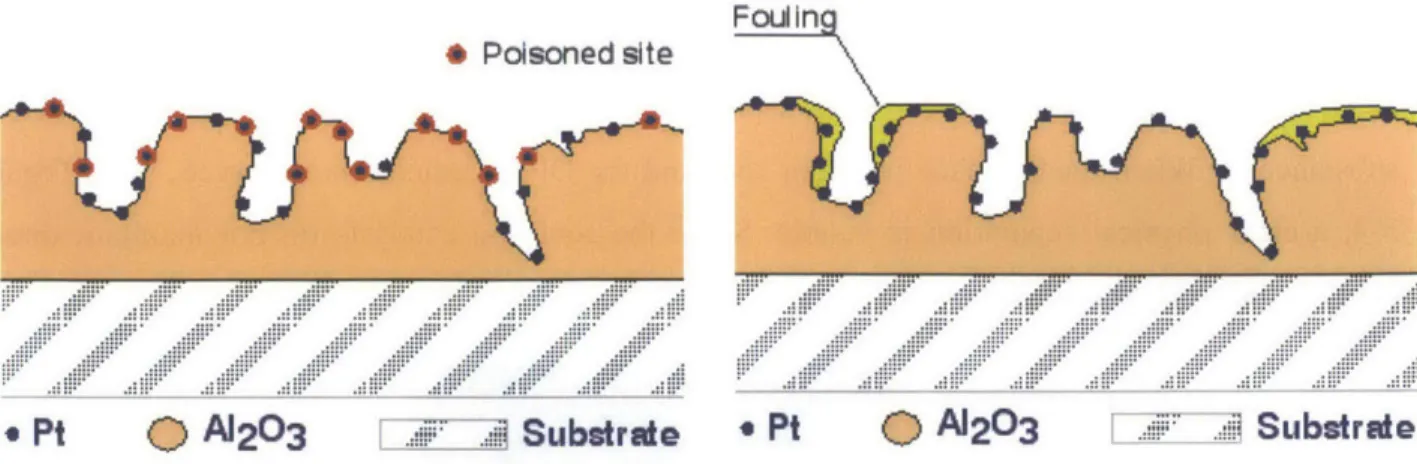
Foreign material that deposits in a DPF can deactivate the catalyst either selectively through chemical poisoning or nonselectively by physically masking (fouling) the catalytically active sites. Each of these modes is depicted in Figure 3-5.
FouLIn
0 Podsoned site
* Pt
0
A12031
Substrate * Pt 0 A203 SubstrateFigure 3-5 Illustration of Catalytic Deactivation via Poisoning/Fouling3 7
Selective deactivation occurs when a chemical reacts directly with the catalyst and inhibits its ability to promote the desired reaction. Some metals, like lead and mercury, will react with platinum to form an alloy that has no beneficial catalytic ability. Once created it is very difficult to reverse the process, so the alloyed platinum will remain inactive throughout the lifetime of the filter. Other compounds, like phosphorus and sulfur dioxide (SO2), can adsorb onto the
catalytically active sites making them inaccessible for further reaction. Poisoning of this sort is reversible; the chemicals can be forced to desorb from the surface through heat treatment or washing.37
Nonselective deactivation is the result of compounds indiscriminately depositing on top of the catalyst. Although the catalyst particles remain chemically active, they are rendered useless if there is a physical barrier preventing the exhaust gas from reaching their surface. Fouling due to the deposition of material can cover the catalyst particles directly and also block the pores causing the platinum within the pores to become inaccessible.
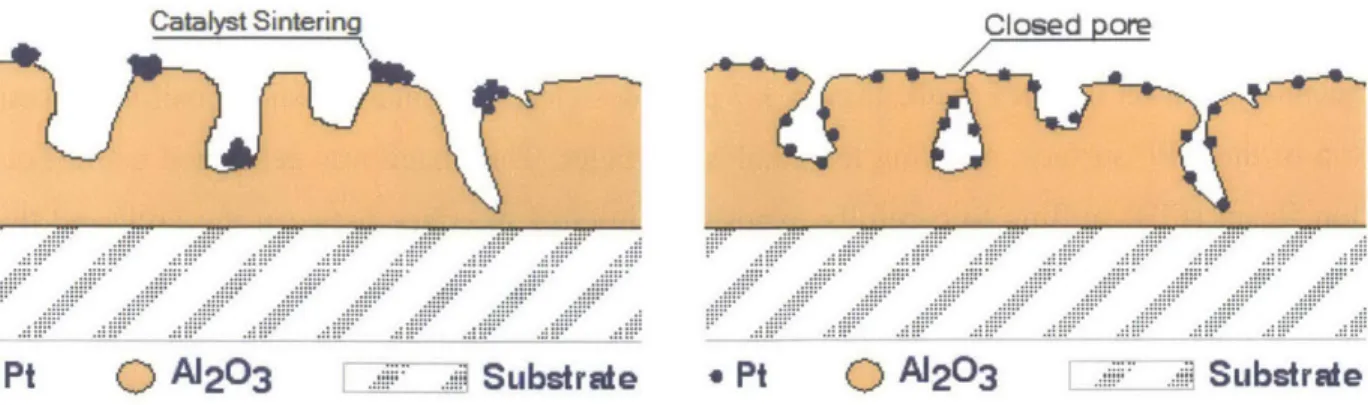
3.4.2 Catalytic Deactivation through Thermal Aging
At high temperatures the structure of both the catalyst particles and the washcoats on which they are deposited can change. This process is referred to as sintering and it can alter the effectiveness of a catalyst. An illustration of the effect is provided in Figure 3-6.
Catalyst Sintering Closed pore
Pt
Q
A1203 Substrate * PtC)
A1203 . SubstradeFigure 3-6 Illustration of Catalytic Deactivation through Thermal Aging3 7
When catalyst particles sinter they tend to agglomerate. As they combine there is a reduction in the total available catalyst surface area. In general, this will result in a loss of catalytic activity since the chemical reactions occur only on the surface of the particles.37 Moreover, thermal aging will also alter the structure of catalyst particles, which in some cases can lead to an increase in the number of available catalytically active sites on the surface. Pt has several stable surface atomic configurations such as (101) and (111) which have different concentrations of Pt atoms per surface area. A switch between these states could lead to a change in catalytic activity without a change in size of the particle. Further investigation is required to fully understand the impact of elevated temperatures on catalytic activity resulting from catalyst sintering.
The alumina washcoat will also undergo thermal aging. Over periods of elevated temperature the washcoat will expand and shift causing its internal pore structure to change. In addition to increasing the restriction to flow of exhaust gas, this can also cause some surface pores to close entirely, isolating any catalyst particles they may contain from the flow. The trapped catalyst particles will be unable to participate in any chemical reactions and are therefore effectively deactivated.
3.5
Effects of Ash Accumulation on DPF Catalysts
The catalysts in a DPF will experience aging resulting from both poisoning and thermal sintering due to the extreme cyclic environments typically experienced by the catalysts/filters. This study primarily considers the effects of the buildup of ash in the filter on the catalyst, neglecting the thermal effects. A study into the effects specifically resulting from thermal aging would
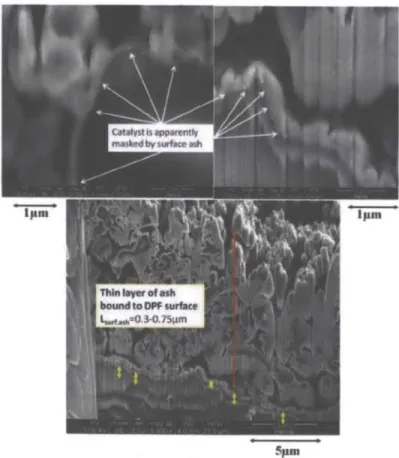
Using scanning electron microscopy (SEM) one can directly observe the modes of ash accumulation on the DPF wall. Figure 3-7 provides clear evidence of ash depositing directly on top of the DPF surface, masking the catalyst particles. The image was generated using Focused Ion Beam (FIB) milling to carefully expose the internal interface between the DPF and the ash without disturbing it.4 3
One can observe both a very thin ash layer that coats the DPF surface, as well as a larger porous layer which constitutes the bulk of the deposited ash.
The ash was found to be comprised primarily of calcium, phosphorus, and sulfuri throughout its entirety. Knowing the chemical composition of the ash and its temperature history, it was assumed that the thin coating was mechanically, not chemically, bound to the surface.44 This
suggests that ash deposits result in noticeable nonselective catalyst poisoning.
51AM
Figure 3-7 SEM Image of Ash Coating Catalyst Particles4 4
In addition to the masking of catalyst particles due to an ash layer coating, the porous wall layer also serves to reduce the ability of the filter to regenerate soot. Figure 3-8, which was similarly