• Aucun résultat trouvé

Cloud simulation

N/A
N/A
Protected

Academic year: 2021

Partager "Cloud simulation"

Copied!
29
0
0

Texte intégral

(1)

HAL Id: hal-02971511

https://hal.archives-ouvertes.fr/hal-02971511

Preprint submitted on 20 Oct 2020

HAL is a multi-disciplinary open access

archive for the deposit and dissemination of

sci-entific research documents, whether they are

pub-lished or not. The documents may come from

L’archive ouverte pluridisciplinaire HAL, est

destinée au dépôt et à la diffusion de documents

scientifiques de niveau recherche, publiés ou non,

émanant des établissements d’enseignement et de

Cloud simulation

Julien Gossa

To cite this version:

(2)

Cloud simulation

Julien Gossa

1

Introduction

The problem of allocating cloud resources in performant, robust and

energy-efficient ways is of paramount importance in today’s usage of computing

in-frastructures. Cloud resources proposed to clients as Infrastructure as a

Ser-vice (IaaS) open a large field of investigation regarding how automatic tools can

help users to better provision the resources and schedule their computation or

storage tasks with regard to the trade-off between rental cost and performance.

Indeed it rapidly becomes very difficult for users to manually handle the

pro-visioning and scheduling decisions when the workloads involve numerous tasks,

which are potentially dependent on others – and such complex workloads are

the focus in this paper. In the last decade a number of research papers have

contributed new allocation techniques to address this issue. A pitfall of research

on IaaS lies in the validation of the models and algorithms proposed, as

vali-dation on actual clouds requires infrastructures that are difficult to set up for

individual researchers. As a consequence, many researchers evaluate their work

through simulation. A number of simulators have been developed for that

pur-pose as reviewed in the related work section hereafter. They are typically based

on discrete-event simulation, using models for each elementary component of

the infrastructure, which are then composed to simulate the whole system and

applications running on it.

However, such an ab initio construction poses a significant problem regarding

the calibration and validation of the composed model against real-world

mea-surements. We show in this paper that a precise modeling of each component

may not be sufficient to yield accurate predictions of the whole system’s

behav-ior. Yet, from the client-side (or equivalently, from the application perspective),

the validaty of the simulation is evaluated against macros-metrics, such as the

makespan and the rental cost of the application executions. It means that the

interactions betweens all components must be taken into account in the

simu-lation, including the lower level components such as the network sharing or the

higher level components such as the scheduler. For instance, a decision which

starts simultaneously a large number of Virtual Machines (VMs) may result in

trashing [13] affecting the expected performance.

This work’s objective is to study how an actual cloud setup behavior can be

predicted through simulation on practical use-cases. To that end, we propose a

simulation framework called SCHiaaS

1

which specializes in IaaS clouds

model-ing. This is an extension to the SimGrid simulation toolkit [4], which provides

in particular the discrete event simulator engine and the operating-system level

operations (e.g messaging, virtual machines management). Using SCHIaaS, we

(3)

focus in this article on the modeling of a cloud-brokering system. This

client-side broker, on behalf on its users, makes scheduling and provisioning decisions,

and automates jobs’ execution on the real infrastructure. We have used this

bro-kering system to experiment the impact of scheduling and provisioning policies

when running two scientific applications using cloud computing resources. The

exact setting for this experiment is described in Section 4. The question that

this article addresses is: can this brokering system be modeled and predicted

ac-curately through simulation? We have collected numerous execution logs traces

when running these scientific applications through the broker, and these provide

us with a valuable basis to validate our candidate simulation model.

The broker, called Schlouder [14], has been developped by our team, and

our effort to build a simulator of it is called SimSchlouder. This co-development

approach makes this study original as allmost all the previous cloud simulation

software proposed have put forward first the design of their software library,

leaving the precise validation to future experiments. By contrast, we have been

able to add all the necessary instrumentation in the broker and in the simulator

to help us understand how accurate were the predictions for indivual simulated

components, especially for higher level components such as the modeling of VM

boot times and the scheduling policies. This continuous analysis has allowed us

to fine tune the simulation software.

This paper’s contributions is therefor twofold. First, we propose a new

sim-ulation tool extending SimGrid with an interface capable of modeling of IaaS

clouds by providing a new interface for that field. This interface is publicly

available as open-source software. Above this interface, we also developed

Sim-Schlouder to demonstrate how a client-side cloud broker can be modeled using

this interface. Secondly, as we advocate that a precise assessment of simulation

should be carried out against real execution figures to better understand the

limits of simulation applicability, we make an in-depth analysis of the factors

that impact the simulation accuracy, and in this regard go further than the

re-lated works. We analyze the sensitivity of several parameters, among which the

impact of the job submission management overheads, the effect of inaccuracies

in the job execution times specified by the user, or the boot time of VMs. The

study is carried out on several use cases which comprise two different types of

applications (workflow and bag-of-tasks), with several size instances for each

of them, and each application operated on two different types of infrastructure

(private and public).

The paper is organized as follows. We first present the related work regarding

simulation in Section 2. Section 3 presents the design of SCHIaaS. Section 4

describes the system we seek to simulate), which includes the cloud management

system Schlouder, the real platforms on which experiments are run, and the

applications that serve as test-cases. The last section presents the simulation.

It first sketches the main design issues for modeling Schlouder. The second part

is a thorough evaluation of the simulation accuracy against real observations on

the applications test-cases presented earlier.

2

Related Work

In the past decade, a number of research works have proposed simulation tools

for clouds. Some of them have a longer history as they build upon the

(4)

experi-ence of researchers in the simulation of computing grids. Most cloud simulators

are based on discrete event simulation (DES). In discrete event simulations

the simulation is a serie of events changing the state of the simulated system.

For instance, events can be the start (or end) of computations or of

commu-nications. The simulator will jump from one event to the next, updating the

times of upcoming events to reflect the state change in the simulation. Such

DES-based simulators require at least a platform specification and an

applica-tion descripapplica-tion. The platform specificaapplica-tion describes both the physical nature

of the cloud, e.g. machines and networks, and the management rules, e.g. VM

placement and availability. Depending on the simulator, the platform

specifica-tion can be done through user code, as in CloudSim [2] for example, or through

platform description files, as is mostly the case in SimGrid [3]. The

applica-tion descripapplica-tion consists in a set of computing and communicating jobs, often

described as an amount of computation or communication to perform. The

simulator computes their duration based on the platform specification, and its

CPU and network models. An alternative approach is to directly input the job

durations extrapolated from actual execution traces.

The available cloud DESs can be divided in two categories. In the first

category are the simulators dedicated to study the clouds from the provider

point-of-view, whose purpose is to help evaluating the design decisions of the

datacenter. Examples of such simulators are MDCSim [12], which offers specific

and precise models for low-level components including network (e.g InfiniBand

or Gigabit ethernet), operating system kernel and disks. It also offers a model for

energy consumption. However, the cloud client activity that can be modeled is

restricted to web-servers, application-servers or data-base applications.

Green-Cloud [10] follows the same purpose with a string focus on energy consumption

of cloud’s network apparatus using a packet-level simulation for network

com-munications (NS2). In the second category are the simulators targeting the

whole cloud ecosystem, including client activity. In this category, CloudSim [2]

(originally stemming from GridSim) is the most broadly used simulator in

aca-demic research. It offers simplified models regarding network communications,

CPU or disks. However, it is easily extensible and serves as the underlying

sim-ulation engine in a number of projects (e.g [1], see section ??). Simgrid [3] is the

other long-standing project, which when used in conjunction with the SchIaaS

cloud interface provides similar functionnalities as CloudSim. Among the other

related projects, are iCanCloud [15] proposed to address scalability issues

en-countered with CloudSim (written in Java) for the simulation of large use-cases.

Most recently, PICS [9] has been proposed to specifically evaluate simulation

of public clouds. The configuration of the simulator uses only parameters that

can be measured by the cloud client, namely inbound and outbound network

bandwidths, average CPU power, VM boot times, and scale-in/scale-out

poli-cies. The data center is therefore seen as a black box, for which no detailed

description of the hardware setting is required. The validation study of PICS

under a variety of use cases has nonetheless shown accurate predictions.

At the core of DES is the solver. The solver considers the states of the

system generated by the platform and previous events to compute the timing

of the future events. In most cases, simulators have a bottom-up approach: the

modeling concerns low-level components (machines, networks, storage devices),

and from their interactions emerge the high-level behaviours. Working on

dis-joint low level components make it easier to tune the precision of the model to

(5)

the wanted accuracy or speed trade-off.

FIXME: next paragraph to be adapted depending on wether

stochas-tic simulation is mentioned. However, when the simulated system is subject

to variability, it is difficult to establish the validity of simulation results formally.

Indeed, given some defined inputs, a DES outputs a single deterministic result,

while a real system will output slightly different results at each repeated

exe-cution. Hence, in practice the simulation is informally regarded as valid if its

results are “close” to one or some of the real observations. Notice however that

in the field of grid or cloud computing, published results in terms of validation

against real settings are scarce relatively to the number of projects.

3

SCHIaaS

3.1

Overview

The first contribution of this paper is the simulation framework called

SCHI-aaS, that we propose as an extension to SimGrid to model IaaS clouds. SimGrid

was originally developped 20 years ago to evaluate scheduling algorithms in

dis-tributed computing environments such as grids. Since then, it has been largely

extended and has become a framework able to tackle new fields of distributed

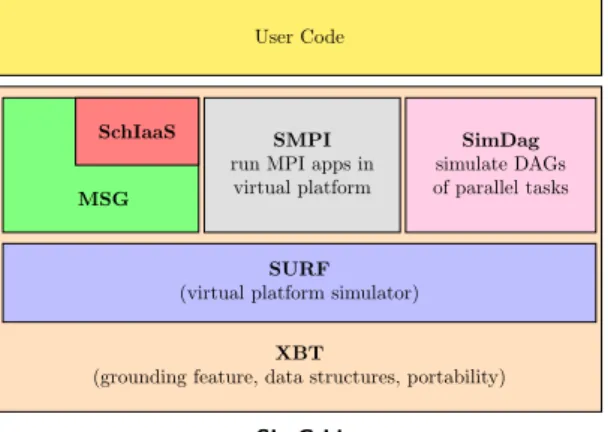
computing. Its layered design, depicted on Figure 1, offers three interfaces to

access the simulation layer (SIMIX on figure) which in turn relies on the

sim-ulation core engine (SURF). Each interface implements a different concurrent

programming model: MSG offers a CSP-like programming model [6], SMPI

enables MPI programs, and SimDag is best suited to represent graphs of

depen-dent tasks. User code may built directly upon one of these interfaces to model

a field of interest, e.g peer-to-peer systems [16] or MapReduce applications [11].

SimGrid

XBT

(grounding feature, data structures, portability)

SURF

(virtual platform simulator)

SMPI

run MPI apps in

virtual platform

SimDag

simulate DAGs

of parallel tasks

SchIaaS

MSG

User Code

Figure 1: The layered architecture of SimGrid, with the additionnal SchIaaS

interface

In this general picture, SCHIaaS is a new interface upon MSG. SCHIaaS

entities use MSG to communicate with the core functions of SimGrid, which

handles the operating system level objects, such as network communications,

running processes, and virtual machines. SCHIaaS entities are mainly instances.

(6)

We use the term instance, as popularized by AWS, to designate the virtual

machine when seen from the client side. Accordingly, the SchIaaS API offers

cloud level functionalities, that is the operations usually provided by public

cloud providers: run, terminate, suspend, resume and describe instances and

operations regarding cloud storage. For sake of modeling a cloud, SchIaaS also

allows the user to describe the available resources, the image and instance types

management, the VM placement policy on the clusters and operating-system

levels parameters such as boot and other VM life-cycle processes. By constrast,

SimGrid implements hypervisor level functionalities such as starting or stoping

a VM.

3.2

SCHIaaS’s design

Developped in Java, SCHIaaS has been designed as a modular and extensible

framework, allowing modelers to plugin their own code in all the key components

which model the cloud or application behavior under study. Figure 2 zooms in

the SCHIaaS box of Figure 1. It shows the components making up SCHIaaS (in

the red box). The boxes with dashed frames indicate that these can be replaced

with user-provided code.

MSG

SCHIaaS Core

Compute Engine

Scheduler

Storage Engine

Load Injector

SimSchlouder

User Made App

: Replaceable modular elements

Figure 2: Zoom on the SCHIaaS framework

SCHIaaS Core

contains all the management code necessary to set up the

data structures corresponding of the cloud described in the configuration file,

and to reflect the effects on the data structures of all the operations triggered

though the Compute and Storage engines.

The Compute Engine

provides an interface for the management of VMs.

It expects an implementation of the way the cloud controller controls the

in-stances, through the definition of start, shutdown, suspend, resume and reboot

commands. It also expects an implementation of the scheduling policies used to

map instances onto physical machines.

(7)

The Storage Engine

offers an interface for the management of block

stor-age, through the definition of put, get, delete, and list operations.

In order to model a system SimGrid requires two configuration files:

• a plaform file describing the available hardware, including hosts

capabil-ities (e.g number of cores, CPU power) and a description of the network

(e.g interconnection topology and network link performances),

• a deployment file which maps the applicative processes to some of the

hosts described in the platform.

SCHIaaS adds to these a third configuration file to describe one or several

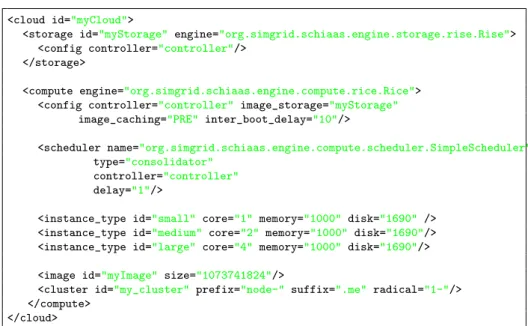
clouds. An example configuration is shown in Figure 3, in which the default

implementations that come with the SCHIaaS distribution are used. The storage

and compute sections correspond to the storage and compute engines listed

above. Each of these component are handled by a controller bound to some

host in the SimGrid platform file. Implementations of the controller’s behavior,

that is the storage and compute engine instanciations, appear line 2 and 6. For

the compute engine, the specific scheduling policy which computes how VMs

are mapped to PMs is implemented in the attached scheduler module line 10.

Note that each request that the controller sends to the cluster nodes, be it a

simple command or a data transfer, generates network communications that are

simulated by SimGrid.

1

<cloud id=

"myCloud"

>

2

<storage id=

"myStorage"

engine=

"org.simgrid.schiaas.engine.storage.rise.Rise"

>

3

<config controller=

"controller"

/>

4

</storage>

5

6

<compute engine=

"org.simgrid.schiaas.engine.compute.rice.Rice"

>

7

<config controller=

"controller"

image_storage=

"myStorage"

8

image_caching=

"PRE"

inter_boot_delay=

"10"

/>

9

10

<scheduler name=

"org.simgrid.schiaas.engine.compute.scheduler.SimpleScheduler"

11

type=

"consolidator"

12

controller=

"controller"

13

delay=

"1"

/>

14

15

<instance_type id=

"small"

core=

"1"

memory=

"1000"

disk=

"1690"

/>

16

<instance_type id=

"medium"

core=

"2"

memory=

"1000"

disk=

"1690"

/>

17

<instance_type id=

"large"

core=

"4"

memory=

"1000"

disk=

"1690"

/>

18

19

<image id=

"myImage"

size=

"1073741824"

/>

20

<cluster id=

"my_cluster"

prefix=

"node-"

suffix=

".me"

radical=

"1-"

/>

21

</compute>

22

</cloud>

Figure 3: An example cloud.xml file describing the environment of a given

cloud, including the custom java classes used to implement the cloud controller

behavior.

(8)

4

Case Study

As mentioned in introduction, handling complex workloads on a distributed

computing infrastructure requires scheduling and provisionning tools. In this

section, we present the following use case: two scientific applications (one is

a bag-of-tasks and the other a workflow) are run on different clouds, and the

executions is controlled by a resource management system in charge of resource

provisionning and scheduling. This section details this experimental setting,

which we have used to collect real execution traces. The paper’s goal is to show

that we can model this experimental setting and produce accurate simulations

of the observed behavior. The way the simulator is build and the evaluation of

the simulation is the object of the next section (Section 5).

4.1

Schlouder

The resource management system used, developed by our team, is called Schlouder

[14]. It is a client-side cloud resource broker which automates the provisioning

of resources needed to execute a workflow, the scheduling of tasks to the

pro-visioned resources and monitors the proper execution of tasks. Schlouder was

chosen because we have a deep knowledge of its internals, and hence the

capa-bility to finely monitor the execution events, which is a key issue when tracking

down the discrepancies between reality and simulation.

Schlouder is actually a frontend which orchestrates the real resource

manage-ment system of the targeted cloud, sometimes referred to as cloud kit, including

OpenStack or Eucalyptus, as depicted on Figure 4. Schlouder can be interfaced

with all cloud kits accepting the EC2 API. While the cloud kit is in charge

of starting or stopping the VMs on the physical machines, tasks execution is

monitored using SLURM [17] which connects to the available VMs, sends the

jobs, and monitors job’s states. To account for the pricing of commercial IaaS,

Schlouder views provisioning in fixed increments of time, referred to as billing

time unit (BTU), machines idle when arriving at the end of a time increment

being automatically shut off. While classical scheduling algorithm have long

mainly considered the makespan minimization as sole objective, Cloud

com-puting adds to the client-side problem statement the economic cost of renting

the resources as another objective. Hence, provisionning and scheduling is a

bi-objective optimization problem. Schlouder makes its decisions based on the

workload submitted and some strategy specified by the user. A strategy is

de-fined by a provisioning (how much instances to start or stop) and scheduling

(when and where assign the tasks) algorithm, and a goal reagarding the cost and

makespan objectives. Schlouder provides a few basic strategies and new ones

can be trivially added. Strategies can affect the workload’s makespan, the VMs

usage rate, and the number of opened BTUs (i.e. the price of the experiment on

a commercial cloud). The experiments in our archive mainly use two strategies,

as soon as possible (ASAP) and as full as possible (AFAP)

ASAP will attempt to execute tasks as early as possible by booting a new VM

unless a VM is already idle or one is predicted to become idle faster than

a VM can boot.

AFAP will favor scheduling tasks on already opened VM unless doing is

pre-dicted extend the VM runtime by an additional BTU, in which case it will

(9)

Schlouder

CloudKit

interface

Strategy

Slurm

Openstack

frontend

VM

VM

Cloud Broker

Cloud

Figure 4: The Schlouder cloud broker and its components relating to an

Open-stack cloud.

boot a new VM.

To compute the schedule, predicted tasks runtimes, as well as tasks

depen-dencies, are user-provided. Scheduling is done dynamically, as soon as tasks

are submitted and all their dependencies have been completed. Once assigned

to a designated VM jobs are not rescheduled. However, if a VM fails to boot

Schlouder will provision a new one to replace it.

4.2

Hardware Setup

Our case study encompasses both a private cloud with no perturbation from

other users and a public cloud which is multi-tenant.

Private Cloud

Our private cloud is based on two local nodes sporting dual

2.64GHz Intel Xeon processors (X5650), for a total of 96 cores. Nodes

oper-ated on Ubuntu 12.04 distributions and virtualisation is achieved using KVM.

Openstack 2012.1.3 was used as a cloud interface. This cloud was build on

perfectly homogeneous nodes and devoid of other users. For data storage these

experiments rely on a Network File-System (NFS). Special attention was taken

to not overbook VMs by caping the number of single core VMs to 25. Due to

the experimental nature of this cloud, two configurations were used overtime.

Table 1 regroups configurations of all cloud versions. We will referrer to this

cloud as openstack-icps.version.

Public Cloud

BonFire [8] is a public multi-cloud distributed all over Europe.

Our experiments were run over three sites of BonFire: de-hlrs based in Stuttgart,

uk-epcc in Edinburgh, and fr-inria in Rennes. BonFIRE clouds were accessed

through an OCCI based API and the clouds were controlled throught software

derived from OpenNebula 3.6. Each site provided different hardware

2

.Resource

quotas limited most experiment 20 VMs, not far from the limits generally

im-posed on public clouds. Centralized storage was provided through a NFS based

on the be-ibbt site in Ghent. Due to network acces restriction the Schlouder

(10)

Cloud

#cores

Hypervisor

Network

version

#VM

Storage

openstack-icps

48

KVM

100mb

1-3

25

NFS

1Gb

4-5

10

NFS

de-hlrs

344

Xen 3.1.2

n/a

v1-3

20

NFS

fr-inria

96

Xen 3.2

n/a

v1-3

20

NFS

uk-epcc

176

Xen 3.0.3

n/a

v1-2

20

NFS

Table 1: Characteristics of our cloud testbeds, version numbers also account for

changes in measured boot times not presented in this table.

server was brought in the BonFIRE WAN through a VPN. Due to the

ex-perimental nature of this cloud configurations have change overtime. Table 1

regroups configurations of all cloud versions. In this article we refer to

experi-ment run on the BonFire clouds by the name of the cloud site followed by the

version number.

4.3

The Applications

Our study is based on the experimentation with two test-case applications that

cover a variety of application profiles in terms of computation intensity, data

load, and task dependency.

4.3.1

OMSSA

The Open Mass-Spectrometry Search Algorithm (OMSSA) [5] comes from the

field of biology, it is used in tandem mass spectrometry analysis (also known

as MS/MS analysis) to identify peptides from the mass and fragment ions

ob-tained by a mass spectrometer. OMSSA matches measurements from the mass

spectrometer, called spectra, to a protein database. The OMSSA workload

features fully independent tasks, making it a Bag of Tasks (BoT), since

ev-ery spectra within a set can be submitted independently to OMSSA. With a

communication-to-computation ratio comprised between 20% and % OMSSA is

considered an CPU-intensive workload. This application was run with 4

differ-ent workload covering 2 differdiffer-ent mass spectrometer resolutions of two differdiffer-ent

protein solutions, denoted brs,hrs,brt and hrt.

4.3.2

Montage

The Montage Astronomical Image Mosaic Engine [7] is designed to gather

as-tronomical images into a mosaic. This application is a workflow designed to

reproject, normalize, and collate source images into a single output image. The

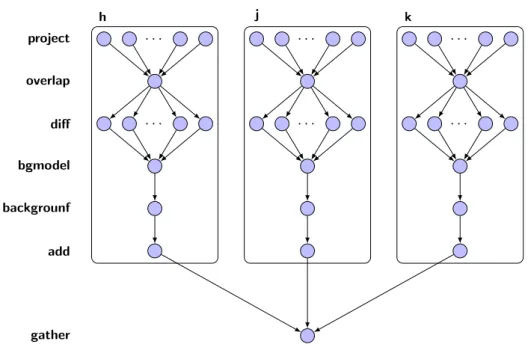
montage workflow is presented figure 5. Working on images Montage is an

extremely data intensive workflow with a communication-to-computation ratio

superior to 90%. This application was run on images of the Pleiade star cluster

at 3 different output sizes, 1X1, 2X2 and 3X3.

(11)

project

overlap

diff

bgmodel

backgrounf

add

gather

. . .

. . .

h

. . .

. . .

j

. . .

. . .

k

Figure 5: Illustration of the Montage workflow. Each node represents a tasks

and each arc represents a data dependency between two tasks. Every task on

a specific row run the Montage command indicated on the left hand side of the

graph.

5

Simulation

5.1

Using SCHIaaS to simulate Schlouder

Ici, raconter comment SimSchlouder a ´

et´

e ´

ecrit.

events

time

state

metrics

provisioning

decision

Future

provisioning

request

Pending

VM

start

Booting

Idle

jobs

assigned

Busy

shut-down

request

Shut-down

Terminated

uptime

boot time

jobs walltimes

Figure 6: Nodes’ states

The actual behavior of a ressource management system in a distributed

environment is much more complex than the description sketched in Section 4.1

and on Figure 4. In a real setting, a number of idle periods appear, which can

be communications between the controler and the nodes or system delays due

to incoming requests processing. Figures 6 and 7 below show the possible states

of nodes and tasks respectively.

For instance regarding the nodes’ state, we can evidence from the

obser-vations a Future state which is the time between the provisioning decision is

computed and the time the controler actually sends the request to the node, this

(12)

last action being managed in a separate execution thread. Another example is

the Pending state, which is the time between the controler request the node to

start a VM and the time the VM actually starts booting on the node. Similarly,

a submitted task goes through several steps until it can actually be run on a

node: once received by the controler it stays Pending until it is Scheduled

on a node, to which is Submitted (involving communication) and evenutally

starts on the compute node.

A key question is then: which of those details can be abstracted from our

modeling, reflected by the simulator we build, while keeping an acceptable

ac-curacy of the simulation?

events

time

state

metrics

task

reception

Pending

node

assigned

Scheduled

task sent

to node

Submited

task starts

on node

Inputting

Running

Outputting

task ends

on node

Finished

Complete

walltime

inputtime

runtime

outputtime

managementtime

Figure 7: Tasks’ states

5.2

Evaluation

Evaluation of simulation is done by comparing simulation logs, against logs

gen-erated by running actual scientific workflows on multiple platforms. During this

study we gathered traces for 274 experimental executions on two significantly

different environments that are described hereafter.

The evaluation of the simulation accuracy of such a system is both a complex

and tedious task. It is complex because the simple comparison of the observed

and predicted walltimes is not sufficient for the experimenter to be aware of

which parts of the execution are correctly or wrongly simulated and how much

each part impacts the whole simulation. During the process of comparison,

the experimenter often has to add extra watch points into the application and

re-run the experiment to eventually obtain the relevant measurements. This

is a tedious back and forward process which generally increases the number of

observed parameters and makes execution log traces heterogeneous over time.

5.2.1

Lab

´

el´

ements concrets pour le lab (c.f Renpar).

Le lab est un ensemble de scripts permettant d’automatiser l’ex´

ecution des

simulations, la collecte des observations, ainsi que leur analyse. Il permet donc

d’ex´

ecuter de bout-en-bout l’´

etude par simulation, de la d´

efinition des diff´

erentes

simulations, `

a la production des graphiques.

Au del`

a de l’aspect pratique et du gain de temps de mise en œuvre de l’´

etude,

le lab a pour vocation de “standardiser” l’´

etude. Cette standardisation assure sa

reproductibilit´

e, ainsi qu’une comparaison ´

equitable entre solutions `

a un mˆ

eme

probl`

eme.

Mais le lab permet ´

egalement une approche syst´

ematique permettant `

a

(13)

un grand lot de simulations, puis d’observer plus finement celles qui pr´

esentent

des particularit´

es. Ce faisant, l’exp´

erimentateur exclu les autres simulation de

ces observations plus pr´

ecises, `

a moins de les refaire enti`

erement. En rendant

plus pratique la d´

efinition des observations directement au niveau du

work-flow de simulations, le lab assure que tous les cas seront observ´

es de la mˆ

eme

mani`

ere, ce qui ´

evite de rater un ph´

enom`

ene, ou de diff´

erencier le traitement

des simulations au risque d’arriver `

a des conclusions abusives.

5.2.2

Procedural Analysis

emarche exp´

erimentale de validation du simulateur.

Process de simulation : choisir l’application, d´

efinir les m´

etriques, executer

Voici la proc´

edure exp´

erimentale que nous avons employ´

e: Sur ce type

d’application nous avons besoin des informations

1. Real executions (xp) to test Schlouder and provisioning/scheduling

strate-gies. Schlouder/SimSchlouder input:

• Nodes: boottime prediction, amount of instances limit, standard

power

• Tasks: walltime prediction

2. Normalization of xp traces (4 versions of schlouder, missing data)

3. Extraction of information about each xp:

• Instance: provisioning date, start date, end date, boottimes, instance

type

• Tasks: submission date, scheduling date, start date, end date,

wall-time, input time and size, runwall-time, output time and size,

manage-ment time

4. Simulation of each xp, injecting different information from real xps

5. Comparison of Schlouder and SimSchlouder outputs (python)

6. Statistical analysis of all traces (R) : distribution de l’erreur

7. Close analysis of each outlier to understand the differences.

5.2.3

life-cycles and observed times

• Execution: e ∈ E

• Node of execution e: n ∈ N

e

• Task of execution e: t ∈ T

e

• Task handled by node n: t ∈ T

n

• The node running the task t is denoted n

t

∈ N

• v

R

denotes the value v in the rality

• v

S

denotes the value v in the simulation

(14)

5.3

Discussion of Results

5.4

Definitions

4 metrics m ∈ M for each execution e ∈ E:

• uptime: amount of rented resources, cost

uptime(e) =

X

n∈N

e

uptime

n

• makespan: duration of the xp from the submission of the first task to the

end of the last task, user experience

makespan(e) = max

t∈T

e

complete

t

• usage: runtime / uptime, efficiency of the provisioning

usage(e) =

P

t∈T

e

walltime

t

P

n∈N

e

uptime

n

• schederror: number of tasks that are not assigned to the same node in the

simulation compared to the reality, accuracy of the scheduling decisions

schederror(e) = |t∀t ∈ T /t

R

n

6= t

S

n

|

Absolute errors are computed for each metric m ∈ M :

m.ae(e) =

|m

S

(e) − m

R

(e)|

m

R

(e)

Results are shown as frequencies and statistics (stat = min, mean, median,

max) of absolute errors occurrences. Frequencies are weighted so that the two

applications weigth the same, and the two platforms weigth alos the same (i.e.

each couple application × platform represents 1/4th of the frequencies).

To compare absolute errors between set of simulations S and S

0

S being the

reference:

• δstat(m.ae(E)) = stat

e∈E

(m.ae

S

0

(e)) − stat

e∈E

(m.ae

S

(e))

• ∆stat(m.ae(E)) = stat

e∈E

(m.ae

S

0

(e) − m.ae

S

(e))

5.5

Simulator accuracy

Best simulation we can do.

Assess the raw simulator accuracy, injecting all real-life hazards that can be

captured : boottimes, walltimes and scheduling dates.

Scheduling dates allow to simulate some internal threaded mechanisms of

Schlouder. Schlouder uses two threads: the node manager and the task

man-ager. At settled intervals, the node manager interrupts the task manager to

start and stop new nodes. This changes the state of nodes, which influence

provisioning and scheduling decisions. However, simulating the exact moment

of this interruption is utterly difficult, leading to differences between simulation

and reality.

(15)

0.00

0.25

0.50

0.75

1.00

0.00

0.25

0.50

0.75

1.00

uptime.ae

ratio of xp

0.00

0.25

0.50

0.75

1.00

0.00

0.25

0.50

0.75

1.00

makespan.ae

ratio of xp

0.00

0.25

0.50

0.75

1.00

0.00

0.25

0.50

0.75

1.00

usage.ae

ratio of xp

0.00

0.25

0.50

0.75

1.00

0.00

0.25

0.50

0.75

1.00

schederror.ae

ratio of xp

uptime.ae

makespan.ae

usage.ae

schederror.ae

min

-1.000

0.000

-25050.707

0.000

mean

0.022

0.030

-101.751

0.130

median

0.001

0.000

0.002

0.000

max

0.840

0.357

0.483

0.935

Figure 8: Frequencies and statistics about absolute error of best simulations

(274 xp)

(16)

• uptime: 86% show less than 0.05 of absolute error, 92% less than 0.10, 2

simulations exceed 0.30, ranging from 0.00 to 0.50, for a mean of 0.025

and a median of 0.001

• makespan: 76% show less than 0.05 of absolute error, 90% less than 0.10,

0 simulations exceed 0.30, ranging from 0.00 to 0.62, for a mean of 0.042

and a median of 0.018

• usage: 59% show less than 0.05 of absolute error, 91% less than 0.10, 2

simulations exceed 0.30, ranging from 0.00 to 0.60, for a mean of 0.043

and a median of 0.002

• schederror: 70% show less than 0.05 of absolute error, 72% less than 0.10,

59 simulations exceed 0.30, ranging from 0.00 to 0.965, for a mean of 0.155

and a median of 0.000

If global metrics are quite accurately assessed by the simulator, the

schedul-ing decisions can be very different between simulation and reality. One part of

the explanation is that scheduling decisions are interdependent: any error leads

to several others.

5.6

Simulator accuracy according to platforms and

appli-cations

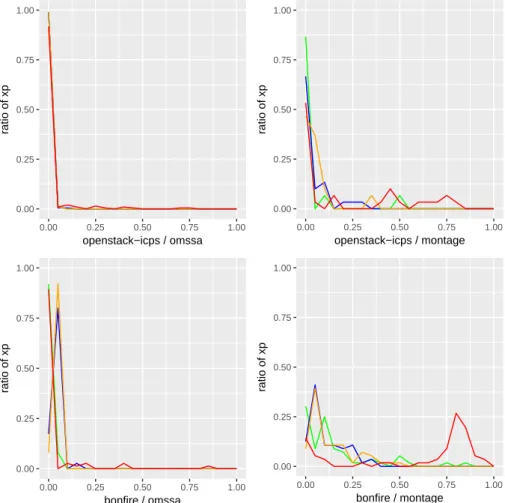
• openstack-icps / omssa (107 xp):

uptime.ae

makespan.ae

usage.ae

schederror.ae

min

-1.000

0.000

-25050.707

0.000

mean

-0.009

0.001

-180.952

0.022

median

0.000

0.000

0.001

0.000

max

0.029

0.079

0.029

0.749

All metrics are almost perfectly assessed (mean AR from 0.001 to 0.002)

except scheduling error (mean 0.04 and max 0.75, 13% of xp show at least

one error), leading to small makespan and usage errors.

We looked at each single case of scheduling error and all those errors comes

from ambiguities in the scheduling algorithms.

This is a first limitation of simulation: Whenever heuristics lead to several

equivalent solutions, the decision is made by the implementation and relies

on data structures (e.g. selection of the first encountered suitable solution)

or clocks (e.g. the solution differs from a second to the next, which depends

on threads activations and timers). While we made sure to use the same

structures and timers, some clocks-related events can not be captured

nor simulated: Processing the nodes and tasks queues for scheduling and

provisioning decisions take time. Consequently, if those decisions rely on

clock, they change during the decision process in reality, as clocks advance

by itself, but not in simulation, as clocks advance only explicitly.

Thus, the simulation is not mistaken, but only different from reality.

Ac-tually, the decisions made by the simulator are exactly those that one

can expect, while the decisions made by the real scheduler are sometimes

difficult to understand.

(17)

0.00

0.25

0.50

0.75

1.00

0.00

0.25

0.50

0.75

1.00

openstack−icps / omssa

ratio of xp

0.00

0.25

0.50

0.75

1.00

0.00

0.25

0.50

0.75

1.00

openstack−icps / montage

ratio of xp

0.00

0.25

0.50

0.75

1.00

0.00

0.25

0.50

0.75

1.00

bonfire / omssa

ratio of xp

0.00

0.25

0.50

0.75

1.00

0.00

0.25

0.50

0.75

1.00

bonfire / montage

ratio of xp

Figure 9: Absolute error frequencies of best simulations according to platforms

and applications

(18)

0.00

0.25

0.50

0.75

1.00

0.00

0.25

0.50

0.75

1.00

uptime.ae

ratio of xp

0.00

0.25

0.50

0.75

1.00

0.00

0.25

0.50

0.75

1.00

makespan.ae

ratio of xp

0.00

0.25

0.50

0.75

1.00

0.00

0.25

0.50

0.75

1.00

usage.ae

ratio of xp

0.00

0.25

0.50

0.75

1.00

0.00

0.25

0.50

0.75

1.00

schederror.ae

ratio of xp

uptime.ae

makespan.ae

usage.ae

schederror.ae

min

-1.000

0.000

-25050.707

0.000

mean

-0.010

0.000

-198.186

0.000

median

0.000

0.000

0.001

0.000

max

0.003

0.058

0.011

0.000

uptime.ae

δ

uptime.ae

mak

espan.ae

δ

mak

espan.ae

usage.ae

δ

usag

e.ae

sc

hederror.ae

δ

scheder

r

or

.ae

min

-1.000

0.000

0.000

0.000

-25050.707

0.000

0.000

0.000

mean

-0.010

−0.001

0.000

−0.000

-198.186

−17.234

0.000

−0.022

median

0.000

+0.000

0.000

+0.000

0.001

+0.000

0.000

0.000

max

0.003

−0.027

0.058

−0.021

0.011

−0.018

0.000

−0.749

Figure 10: Frequencies and statistics about absolute error of best simulations

for openstack-icps / ommssa, without scheduling error cases (91 xps)

(19)

Filtering the xps showing clocks-related issues (16 xps), the results are

perfect: all metrics present a mean ae of at most 0.001.

The less accurate simulation shows a makespan absolute error of 0.010.

Actually, the makespan of the simulation is 94s, whereas it is 95s in reality.

This small difference is due to one lag between two consecutive tasks in

the middle of the simulation. Such lags are not injected in our simulations.

This shows that, providing that one can inject the right information, the

only limitation of our simulator are micro clock-related hazards.

• openstack-icps / montage (36 xps):

uptime.ae

makespan.ae

usage.ae

schederror.ae

min

0.000

0.000

0.000

0.000

mean

0.041

0.045

0.049

0.230

median

0.001

0.003

0.031

0.000

max

0.501

0.283

0.346

0.790

uptime.ae

δ

uptime.ae

mak

espan.ae

δ

mak

espan.ae

usage.ae

δ

usag

e.ae

sc

hederror.ae

δ

scheder

r

or

.ae

min

0.000

+1.000

0.000

+0.000

0.000

+25050.707

0.000

0.000

mean

0.041

+0.050

0.045

+0.044

0.049

+181.001

0.230

+0.208

median

0.001

+0.001

0.003

+0.003

0.031

+0.030

0.000

0.000

max

0.501

+0.472

0.283

+0.204

0.346

+0.317

0.790

+0.041

With a work-flow, scheduling errors are more numerous (ae mean of 0.24

for a max of 0.79), leading to less accurate assessments of uptime, makespan

and usage (mean ae of 0.01, 0.05, and 0.01), that is ten times more than

with a BoT.

First, montage has much more tasks (from 43 to 1672) than omssa (from

33 to 223). Consequently, queues are much longer, which increases the

clock-related issues.

Second, BoT scheduling are actually made offline (i.e. scheduling decisions

are taken before any actual execution), while WF scheduling implies

de-cisions during the execution, every time dependencies are satisfied. Those

decisions rely on the system state (predicted end date of nodes for

in-stance). Consequently, divergences between simulation and reality have

more important impacts with WF than with BoTs.

For instance, the worst case shows a very large amount of scheduling

errors (0.954). A close examination of this case shown that the simulation

behave as expected : After the first dependencies were satisfied, three

newly ready tasks t1, t2, and t3 were scheduled on the node n. However

in reality, scheduling takes time. During this time, the last task scheduled

to node n was completed between the scheduling of t2 and t3, but before

t1 were actually submitted to n. This lead to mistakingly set the state of

node n to idle, impacting the scheduling decision of t3.

Those kind of complex and unforeseeable events are actually frequent when

confronted to reality. However, they are utterly difficult to detect (1672

(20)

jobs were scheduled for the presented case). Comparing real execution

with simulation allow the detection of such case, without having to look

at each scheduling decision.

the last task assigned to node n was completed during the scheduling of

the tasks which dependencies were satisfied first. But those tasks were

intended to This completion lead Schlouder to mistake the state of the

• bonfire / omssa (75 xp):

uptime.ae

makespan.ae

usage.ae

schederror.ae

min

0.000

0.002

0.021

0.000

mean

0.005

0.044

0.049

0.032

median

0.001

0.047

0.050

0.000

max

0.038

0.169

0.063

0.857

uptime.ae

δ

uptime.ae

mak

espan.ae

δ

mak

espan.ae

usage.ae

δ

usag

e.ae

sc

hederror.ae

δ

scheder

r

or

.ae

min

0.000

+1.000

0.002

+0.002

0.021

+25050.727

0.000

0.000

mean

0.005

+0.014

0.044

+0.043

0.049

+181.001

0.032

+0.010

median

0.001

+0.001

0.047

+0.047

0.050

+0.049

0.000

0.000

max

0.038

+0.009

0.169

+0.090

0.063

+0.034

0.857

+0.108

On a public shared heterogeneous cloud, scheduling errors are more

nu-merous (AR mean of 0.03 for a max of 0.86), leading to less accurate

assessments of uptime, makespan and usage (mean AR of 0.005, 0.045,

and 0.053).

More interesting, usage are never perfectly assessed: 16% of xp show less

than 0.05 of AR, while 86% show an AR between 0.05 and 0.10

This show the impacts of public heterogeneous platforms on simulation

accuracy: It is not possible to precisely simulate the vm-to-pm scheduling

algorithm of public cloud, as they are generally not public, and their

decisions impacts performances, as one can not predict the power of the

VM one get.

• bonfire / montage (56 xp):

uptime.ae

makespan.ae

usage.ae

schederror.ae

min

0.000

0.004

0.000

0.000

mean

0.151

0.110

0.134

0.605

median

0.081

0.062

0.076

0.787

(21)

uptime.ae

δ

uptime.ae

mak

espan.ae

δ

mak

espan.ae

usage.ae

δ

usag

e.ae

sc

hederror.ae

δ

scheder

r

or

.ae

min

0.000

+1.000

0.002

+0.002

0.021

+25050.727

0.000

0.000

mean

0.005

+0.014

0.044

+0.043

0.049

+181.001

0.032

+0.010

median

0.001

+0.001

0.047

+0.047

0.050

+0.049

0.000

0.000

max

0.038

+0.009

0.169

+0.090

0.063

+0.034

0.857

+0.108

On a public shared heterogeneous cloud, scheduling errors are even more

numerous (AR mean of 0.48 for a max of 0.96), leading to less accurate

assessments of uptime, makespan and usage (mean AR of 0.10, 0.115, and

0.48).

This is simply explained by the cumulation of inaccuracies from both

platform and applications.

5.7

Boottime impacts

Assessing the impact of efficient boottimes simulation.

Same simulations, without injecting the boottimes observations. Thus,

boot-times are only predictions, based on linear regressions of previously observed

boottimes.

The worst case show a makespan ae of 0.816 (3141s instead of 17076s). This

is due to boottimes on BonFire that were completely of charts: 5 boots were

normal (ranging from 232s to 311s), the 17 others ranged from 3281s to 11084s.

Whereas BonFire were intended to deliver 22 simultaneous VMs, only 5 were

available at the time of the experiment. Instead of refusing the following 17 VMs,

the provisioning system of BonFire put them in pending state, waiting for the

delivered ones to stop. The VMs being provisioned for one hour, following the

5 normal boots, 5 boots took approximatively 1 hour, then 5 other boots took

2 hours, and 5 another more took 3 hours. Finally, 2 boots took 1 hour after

the last dependencies were satsified.

This illustrates that defective clouds can not be efficiently simulated without

proper information capture. However, once captured, this kind of defection is

perfectly simulated by SchIaaS. Consequently, it can be used to assess behavior

and robustness of solutions facing these defections.

Some case are surprisingly improved without the real boot times injection:

For instance, one xp shows a real makespan of 25788s, for 35106s with boot

times injection and 24266s without.

5.7.1

No-threads

Injection of: real boot times and some times due to Schlouder internal threads,

such as lapses after a node become ready and the start of the first job.

Assess the impact of efficient internal threads simulation

5.7.2

Communications

Injection of: real boot times, some times due to Schlouder internal threads,

such as lapses after a node become ready and the start of the first job, and, real

(22)

0.00

0.25

0.50

0.75

1.00

0.00

0.25

0.50

0.75

1.00

uptime.ae

ratio of xp

0.00

0.25

0.50

0.75

1.00

0.00

0.25

0.50

0.75

1.00

makespan.ae

ratio of xp

0.00

0.25

0.50

0.75

1.00

0.00

0.25

0.50

0.75

1.00

usage.ae

ratio of xp

0.00

0.25

0.50

0.75

1.00

0.00

0.25

0.50

0.75

1.00

schederror.ae

ratio of xp

uptime.ae

makespan.ae

usage.ae

schederror.ae

min

-1.000

0.000

-25050.707

0.000

mean

0.026

0.062

-101.743

0.141

median

0.001

0.016

0.003

0.000

max

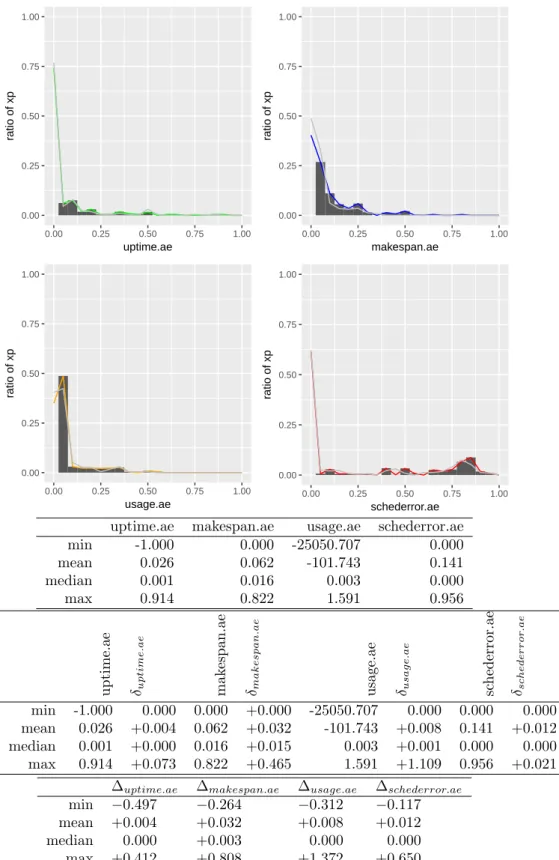
0.914

0.822

1.591

0.956

uptime.ae

δ

uptime.ae

mak

espan.ae

δ

mak

espan.ae

usage.ae

δ

usag

e.ae

sc

hederror.ae

δ

scheder

r

or

.ae

min

-1.000

0.000

0.000

+0.000

-25050.707

0.000

0.000

0.000

mean

0.026

+0.004

0.062

+0.032

-101.743

+0.008

0.141

+0.012

median

0.001

+0.000

0.016

+0.015

0.003

+0.001

0.000

0.000

max

0.914

+0.073

0.822

+0.465

1.591

+1.109

0.956

+0.021

uptime.ae

makespan.ae

usage.ae

schederror.ae

min

−0.497

−0.264

−0.312

−0.117

mean

+0.004

+0.032

+0.008

+0.012

median

0.000

+0.003

0.000

0.000

max

+0.412

+0.808

+1.372

+0.650

(23)

0.00

0.25

0.50

0.75

1.00

0.00

0.25

0.50

0.75

1.00

uptime.ae

ratio of xp

0.00

0.25

0.50

0.75

1.00

0.00

0.25

0.50

0.75

1.00

makespan.ae

ratio of xp

0.00

0.25

0.50

0.75

1.00

0.00

0.25

0.50

0.75

1.00

usage.ae

ratio of xp

0.00

0.25

0.50

0.75

1.00

0.00

0.25

0.50

0.75

1.00

schederror.ae

ratio of xp

uptime.ae

makespan.ae

usage.ae

schederror.ae

min

-1.000

0.000

-26121.668

0.000

mean

0.030

0.046

-104.658

0.261

median

0.001

0.017

0.002

0.092

max

0.913

0.484

0.503

0.966

uptime.ae

δ

uptime.ae

mak

espan.ae

δ

mak

espan.ae

usage.ae

δ

usag

e.ae

sc

hederror.ae

δ

scheder

r

or

.ae

min

-1.000

+0.000

0.000

+0.000

-26121.668

−1070.961

0.000

0.000

mean

0.030

+0.008

0.046

+0.016

-104.658

−2.907

0.261

+0.132

median

0.001

+0.000

0.017

+0.017

0.002

+0.000

0.092

+0.092

max

0.913

+0.072

0.484

+0.127

0.503

+0.020

0.966

+0.031

uptime.ae

makespan.ae

usage.ae

schederror.ae

min

−0.167

−0.226

−1070.961

−0.601

mean

+0.008

+0.016

−2.907

+0.132

median

0.000

+0.003

−0.000

+0.037

max

+0.249

+0.274

+0.251

+0.870

(24)

runtimes and real data size for jobs input and output communications.

Assess the impact of efficient communications

5.7.3

Prediction

Injection of nothing from the real xp, except the xp description as submitted to

schlouder.

Assess the efficiency of using a simulator as a predictor of a cloud.

6

Open-science

git clone https://git.unistra.fr/gossa/schlouder-traces.git

git clone https://scm.gforge.inria.fr/anonscm/git/schiaas/schiaas.git

cd schiaas

cmake .

make

cd lab

./lap.py -p2 setup/simschlouder/validation.cfg

cd setup/simschlouder/validation-results

ls

References

[1] Zhicheng Cai, Qianmu Li, and Xiaoping Li. Elasticsim: A toolkit for

sim-ulating workflows with cloud resource runtime auto-scaling and stochastic

task execution times. J. Grid Comput., 15(2):257–272, 2017.

[2] Rodrigo N Calheiros, Rajiv Ranjan, Anton Beloglazov, C´

esar AF De Rose,

and Rajkumar Buyya. Cloudsim: a toolkit for modeling and simulation

of cloud computing environments and evaluation of resource provisioning

algorithms. Software: Practice and experience, 41(1):23–50, 2011.

[3] Henri Casanova, Arnaud Giersch, Arnaud Legrand, Martin Quinson, and

Fr´

ed´

eric Suter. Versatile, scalable, and accurate simulation of distributed

applications and platforms. J. Parallel Distrib. Comput., 74(10):2899–2917,

2014.

[4] Henri Casanova, Arnaud Legrand, and Martin Quinson. Simgrid: A generic

framework for large-scale distributed experiments. In Proceedings of the

10th EUROS/UKSim International Conference on Computer Modelling

and Simulation, Cambridge University, Emmanuel College, Cambridge,

UK, 1-3 April 2008, pages 126–131. IEEE Computer Society, 2008.

[5] L. Y. Geer, S. P. Markey, J. A. Kowalak, L. Wagner, M. Xuand D. M.

Maynard, X. Yang, W. Shi, and S. H. Bryant. Open mass spectrometry

search algorithm. J Proteome Res., 3(5):958–964, Sep-Oct 2004.

[6] C. A. R. Hoare. Communicating sequential processes. Commun. ACM,

21(8):666–677, 1978.

(25)

0.00

0.25

0.50

0.75

1.00

0.00

0.25

0.50

0.75

1.00

uptime.ae

ratio of xp

0.00

0.25

0.50

0.75

1.00

0.00

0.25

0.50

0.75

1.00

makespan.ae

ratio of xp

0.00

0.25

0.50

0.75

1.00

0.00

0.25

0.50

0.75

1.00

usage.ae

ratio of xp

0.00

0.25

0.50

0.75

1.00

0.00

0.25

0.50

0.75

1.00

schederror.ae

ratio of xp

uptime.ae

makespan.ae

usage.ae

schederror.ae

min

-1.000

0.000

-26175.045

0.000

mean

0.068

0.082

-104.675

0.144

median

0.001

0.025

0.038

0.000

max

2.692

1.163

0.981

0.940

uptime.ae

δ

uptime.ae

mak

espan.ae

δ

mak

espan.ae

usage.ae

δ

usag

e.ae

sc

hederror.ae

δ

scheder

r

or

.ae

min

-1.000

0.000

0.000

+0.000

-26175.045

−1124.339

0.000

0.000

mean

0.068

+0.046

0.082

+0.052

-104.675

−2.924

0.144

+0.014

median

0.001

+0.000

0.025

+0.025

0.038

+0.036

0.000

0.000

max

2.692

+1.852

1.163

+0.805

0.981

+0.499

0.940

+0.005

uptime.ae

makespan.ae

usage.ae

schederror.ae

min

−0.283

−0.331

−1124.339

−0.301

mean

+0.046

+0.052

−2.924

+0.014

median

0.000

+0.002

+0.006

0.000

max

+2.015

+0.879

+23.428

+0.759

Figure

Figure 1: The layered architecture of SimGrid, with the additionnal SchIaaS interface
Figure 2: Zoom on the SCHIaaS framework
Figure 3: An example cloud.xml file describing the environment of a given cloud, including the custom java classes used to implement the cloud controller behavior.
Figure 4: The Schlouder cloud broker and its components relating to an Open- Open-stack cloud.
+7

Références

Documents relatifs

Thèse de Doctorat Unique présentée par : ELEGBEDE MANOU Bernadin pour l’obtention du grade de Docteur de l’Université d’Abomey-Calavi Page 152 Table XVII: Result of

The topic of ecosystem services, ecological services, environmental services (ES) and payments for environmental services (PES) has recently become the main reference for

- Travel characteristics: number of trip undertaken, trip distance, departure time, travel purposes, travel mode, travel day - the day of week that travel was

Moreover, it is interesting to note that there exist only two other experimental data sets allowing such an analysis as the present one. One data set ~comprising about 400 events!

Dans le cancer du sein, au-delà de l’apport du 18 F-FDG comme traceur du métabolisme tumoral dans le diagnostic initial des cas difficiles (seins denses ou

Then, there are two natural ways to define a uniform infinite quadrangulation of the sphere: one as the local limit of uniform finite quadrangulations as their size goes to

The literature on continuous-state and continuous-time control on networks is recent: the first two articles were published in 2012: control problems whose dynamics is constrained to

Nachr. Mertens, Ueber einige asymptotische Gesetze der Zahlentheorie, J. Montgomery, Fluctuations in the mean of Euler’s phi function, Proc. Titchmarsh, The theory of the