Dynamic profiling of the protein
life cycle in response to pathogens
The MIT Faculty has made this article openly available.
Please share
how this access benefits you. Your story matters.
Citation
Jovanovic, M. et al. “Dynamic Profiling of the Protein Life Cycle
in Response to Pathogens.” Science 347.6226 (2015): 1259038–
1259038.
As Published
http://dx.doi.org/10.1126/science.1259038
Publisher
American Association for the Advancement of Science (AAAS)
Version
Author's final manuscript
Citable link
http://hdl.handle.net/1721.1/105732
Terms of Use
Article is made available in accordance with the publisher's
policy and may be subject to US copyright law. Please refer to the
publisher's site for terms of use.
Dynamic profiling of the protein life cycle in response to
pathogens
Marko Jovanovic1,*, Michael S. Rooney1,2,*, Philipp Mertins1, Dariusz Przybylski1, Nicolas
Chevrier1,3, Rahul Satija1,9,10, Edwin H. Rodriguez4, Alexander P. Fields4, Schraga
Schwartz1, Raktima Raychowdhury1, Maxwell R. Mumbach1, Thomas Eisenhaure1,5, Michal
Rabani1,11, Dave Gennert1, Diana Lu1, Toni Delorey1, Jonathan S. Weissman4,6, Steven A.
Carr1, Nir Hacohen1,5,7,#, and Aviv Regev1,6,8,#
1Broad Institute of MIT and Harvard, Cambridge, MA 02142
2Harvard/MIT Division of Health Sciences and Technology, Cambridge, MA 02141 3FAS Center for Systems Biology, Harvard University, Cambridge, MA 02138
4Department of Cellular and Molecular Pharmacology, California Institute for Quantitative Biomedical Research, University of California, San Francisco, San Francisco, CA 94158 5Center for Immunology and Inflammatory Diseases, Massachusetts General Hospital, Boston, MA 02114
6Howard Hughes Medical Institute, Massachusetts Institute of Technology, Cambridge, MA 02140 7Harvard Medical School, Massachusetts Institute of Technology, Cambridge, MA 02140
8Department of Biology, Massachusetts Institute of Technology, Cambridge, MA 02140
Abstract
Protein expression is regulated by production and degradation of mRNAs and proteins, but their specific relationships remain unknown. We combine measurements of protein production and degradation and mRNA dynamics to build a quantitative genomic model of the differential regulation of gene expression in LPS-stimulated mouse dendritic cells. Changes in mRNA abundance play a dominant role in determining most dynamic fold changes in protein levels. Conversely, the preexisting proteome of proteins performing basic cellular functions is remodeled primarily through changes in protein production or degradation, accounting for over half of the absolute change in protein molecules in the cell. Thus, the proteome is regulated by transcriptional
#corresponding authors: Aviv Regev: [email protected]. Nir Hacohen: [email protected].
9Present address: New York Genome Center, New York, NY 10013
10Present address: Center for Genomics and Systems Biology, New York University, New York, NY 10012 11Present address: Department of Molecular and Cellular Biology, Harvard University, Cambridge, MA 02138 *contributed equally
Supplementary Materials Materials and Methods Figs. S1 to S21 Tables S1 to S9
HHS Public Access
Author manuscript
Science. Author manuscript; available in PMC 2016 March 06.
Published in final edited form as:
Science. 2015 March 6; 347(6226): 1259038. doi:10.1126/science.1259038.
Author Manuscript
Author Manuscript
Author Manuscript
induction of novel cellular functions and remodeling of preexisting functions through the protein life cycle.
Introduction
Mammalian gene expression is tightly controlled through the interplay between the RNA and protein life cycles (Fig. 1A). Although studies of individual genes have shown the importance of regulating each of these processes for correct protein expression (1–4), the quantitative contribution of each process to changes in protein expression levels (Fig. 1A) remains largely unknown and much debated (5, 6). Many studies have attempted to address this question in the context of steady state protein levels (5, 7–13) and comparing steady state mRNA and protein abundances has indicated a considerable discrepancy between mRNA and protein levels (5, 7–13). Furthermore, protein expression is more conserved across species than mRNA expression (11, 14, 15), both suggesting a substantial contribution of the protein life cycle. A recent study using metabolic pulse labeling of proteins and mRNA in an asynchronously proliferating mammalian cell line (16) concluded that gene-to-gene differences in protein synthesis rates contributed most to final protein levels (~55%), followed by mRNA abundance (40%), whereas mRNA and protein degradation played only minor roles. However, reanalysis of this data challenged some of these conclusions, arguing that the contribution of mRNA levels could be as high as 84% and that of protein synthesis as low as 8% (6).
In contrast, only a few studies (5, 12, 17–20) have attempted to shed light on how changes in each of these processes determine differential protein expression – either relative (ratios) or absolute (differences) – during dynamic responses and only one recent report (20) has attempted to quantitate each process. However, none of these has comprehensively accounted for experimental measurement errors, nor have they de-convolved interdependencies of the data. Understanding the contributions of each step of gene expression to a dynamic response on a systems scale is essential for both deciphering how cells deploy regulatory processes to accomplish physiological changes, and for discovering key molecular regulators controlling each process.
Results
A pulsed-SILAC strategy to measure protein dynamics
We assessed how protein levels are maintained in the context of the model response of mouse immune bone marrow-derived dendritic cells (DCs) (21) to stimulation with lipopolysaccharide (LPS) (22–26). This is a compelling system, as DCs are mostly post-mitotic, and LPS synchronizes them (27) and causes dramatic regulatory changes from the expression of thousands of transcripts (22, 24, 25) to protein phosphorylation (26). To monitor protein production and degradation during a dynamic response, we used a modified pulsed-SILAC approach (28) (Fig. 1B, (29)) to track newly synthesized and previously labeled proteins over time. We cultured DCs for 9 days in medium-heavy labeled (M) SILAC medium, then substituted the M SILAC medium with heavy-labeled (H) SILAC medium and immediately stimulated them with LPS or medium (MOCK).
Newly-Author Manuscript
Author Manuscript
Author Manuscript
synthesized proteins were thus labeled with heavy (H) amino acids, serving as a proxy for protein synthesis, while proteins with medium-heavy (M) amino acids decayed over time, reflecting cellular half-lives. For normalization, we spiked in a reference sample, extracted from a mix of unstimulated and stimulated DCs grown in light (L) SILAC media. We collected biological replicate samples at 10 time points over 12 hours (0h, 0.5h, 1h, 2h, 3h, 4h, 5h, 6h, 9h, 12h) after LPS or mock stimulation. We quantified 6,079 proteins by LC-MS/MS in at least one sample and 2,288 proteins in all samples (time points, conditions and replicates; Fig. 2A, table S1). We independently measured replicate RNA-Seq profiles under the same conditions (Fig. 2A, table S2, (29)).
A model-based estimation of protein synthesis and degradation rates
We devised a computational strategy to infer per-mRNA translation rates (T(t)) and protein degradation rates (D(t)) at each time point from the temporal transcriptional profiles (R(t)) and H/L and M/L protein ratios (H(t) and M(t), respectively) (Figs. 1B, S1, (29)). We defined a model that describes the relevant processes and associated rates (e.g., translation rate, protein degradation rate), and then fitted the parameters (e.g. rates) in the model with our mRNA and protein data. Specifically, we used an ordinary differential equations model describing, for each gene i, the changes in Mi(t) and Hi(t) (dMi(t)/dt and dHi(t)/dt,
respectively) as a function of (1) a production term, governed by mRNA abundance Ri(t)
and a per-mRNA molecule translation rate constant, Ti(t); and (2) a degradation term,
modeled as an exponential decay function, governed by a protein degradation rate constant,
Di(t). Both terms are also affected by γ(t), the global M SILAC label recycling rate constant
(Figs. 1B, S1, S2, (29)). All rate constants are dynamic, and the mRNA levels, per-mRNA translation rate constant and protein degradation rate constant are also gene-specific. We modeled the change over time in the per-mRNA translation rate constant (Ti(t)) and in the
degradation rate constant (Di(t)) as linear functions. This assumption reduces the number of
free parameters, thus providing robustness while retaining the capacity to detect the effect of sustained changes, even if these changes do not manifest linearly in vivo (as in the case of step functions).
We fitted the different parameters in the model (fig. S1) with the RNA-Seq and mass spectrometry (MS) data (29), using an empirical Bayes strategy (29), which prevents over-fitting of noisy MS data by sharing information across genes. In this approach, our most differential and reliable parameter estimates correspond to the well-quantified genes (29), whereas proteins with less reliable measurements are not associated with reliable changes. This ensures a low rate of false positives (calling a change where none exists), but may result in false negatives, and hence in some underestimation of the contribution of protein synthesis and degradation.
Fitting the parameters for 3,147 genes that passed our filtering criteria (29), separately for each of our replicates (Figs. 2B, S3, table S3), we found good reproducibility of the LPS/ MOCK ratios of key fitted values (Figs. 2B, S4) and of the relative differences in per-mRNA translation rates (e.g., ΔTi(12h) = Ti(12h)LPS/Ti(12h)MOCK, Pearson r = 0.68, fig.
S5A) or degradation rates (e.g., ΔDi(12h) = Di(12h)LPS/Di(12h)MOCK, r = 0.62, fig. S5B).
The robustness of these results was further supported by: (1) the fair correlation of our
Author Manuscript
Author Manuscript
Author Manuscript
translation and protein degradation rate estimates in resting cells (table S3, fig. S6) with previous estimates in mouse fibroblasts (NIH3T3) based on a similar pulsed-SILAC approach (16) (r(Ti(0))= 0.35; r(Di(0)) = 0.58; fig. S7A, S7B) or on estimates of translation
rate efficiency (TE) values based on ribosome profiling in mouse fibroblasts (NIH3T3) (30) (r(Ti(0)) = 0.37; fig. S7C); (2) a good correlation between our per-mRNA translation rates
and our independent measurement of TE values in DCs using ribosome profiling at t=0h (r = 0.5, table S4, fig. S8A), comparable to the correlation between TE values in mouse DCs and mouse fibroblasts (r = 0.54, fig. S8B); (3) the fact that strong early changes are all in immune response proteins (fig. S4A); (4) the global increase upon LPS stimulation in protein production rates (Ti(12h)LPS vs. Ti(12h)MOCK, P < 10−10, Wilcoxon rank-sum Test,
fig. S9A) and protein degradation rates (Di(12h)LPS vs. Di(12h)MOCK, P < 10−10, Wilcoxon
rank-sum Test, fig. S9B), consistent with other reports (31, 32); and (5) the increase in the calculated ‘degradation rate’ – likely reflecting depletion by secretion, or “decreased cellular half life” – of proteins from the recently-characterized secretome of LPS stimulated mouse macrophages (33) (P < 10−10, LPS vs. MOCK; Wilcoxon rank-sum Test, fig. S9C).
mRNA levels contribute the most to protein expression levels before stimulation
To determine the relative contribution of each step to steady state protein levels in unstimulated, post-mitotic DCs, we first estimated absolute protein levels from four
additional MS data sets in resting DCs (0h) that rely on distinct peptides (29): two biological replicate samples, which were each digested in two technical replicates with LysN and AspN, respectively, rather than by trypsin, used for the pulsed SILAC samples (29). Next, we assessed the contribution of each regulatory step to gene-to-gene differences in overall protein levels by comparing (with Spearman-corrected coefficients of determination, (29)) the independently-measured absolute protein levels to steady state protein levels predicted by our model when setting one or more of the three regulatory steps (mRNA level, per-mRNA translation rate constant, or protein degradation rate constant) to its per-gene inferred value (at time 0h) and setting the remaining steps to their pan-genome median value (29). By sequentially adding to the model further per-gene values rather than pan-genome medians (say: mRNA level, translation rate, and finally degradation rate) and assessing the corresponding change in the correlation measure, we can assign additive regulatory contributions to the three steps (29). Because these three steps are not statistically independent from each other and may interact in a nonlinear manner, we explored every possible ordering of consideration.
Considering all 3 variables together, we account for nearly 79% of the variance of the independently measured protein levels (figs. S10, S11A, (29)). Of these 79%, mRNA levels explained 59–68%, per-mRNA translation rates 18–26%, and degradation rates 8–22%. (Figs. 3A, S11A, (29)). We believe the unexplained variance is due to systematic errors in the measurements and modeling that could not be accounted for. In addition, we have separately estimated the variance in translation rates in the same cells under identical conditions using ribosome profiling to measure TE values (above and (29)). Using TE values instead of our pulsed-SILAC derived translation rates, we estimate a comparable contribution of protein synthesis (Figs. 3B, S10). Thus, in postmitotic DCs, mRNA levels
Author Manuscript
Author Manuscript
Author Manuscript
are contributing more to protein-to-protein variation in total protein levels than the protein life cycle (synthesis and degradation rates) combined.
mRNA abundance dynamics dominate protein changes post stimulation
Next, we determined the contribution of each regulatory step to protein fold changes at 12 hours. We used the model fit from a given replicate to predict the protein fold change at 12h, when using either MOCK-estimated parameters or one or more LPS-estimated parameters for mRNA level, translation rate, and degradation rate. We then compared these predictions to the fitted fold changes from the other replicate. Starting with all parameters set to MOCK-estimated rates, we sequentially used LPS-MOCK-estimated parameters for mRNA, translation rate, and degradation rate (in every possible order), and thus assessed the contribution of each step as the increase in the Spearman-corrected coefficients of determination (29). We found that mRNA levels explain ~87–92%, per-mRNA translation rates ~4–7%, and degradation rates ~3–6% of protein fold changes after 12 hours (Figs. 3C, S11B, (29)). mRNA fold changes contributed at least eight times as much as the protein life cycle combined for both induced and repressed proteins (fig. S12, table S5, (29)). However, changes in per-mRNA translation rates contributed more substantially to protein level induction, whereas changes in protein degradation rates mostly contributed to protein level repression (fig. S12, table S5, (29)).
Fold changes in induced immune response proteins (29) were particularly dominated by mRNA level changes (Figs. 2B, 3E, table S6). For example, transient up-regulation of the mRNA encoding the negative immune regulator Trafd1 (34) (Fig. 3F) is the main cause of a strong increase in its protein. In Trafd1 and hundreds of other genes, a transient, strong, spiked change in mRNA, combined with a time-constant protein half life, much longer than the 12h time course, result in a monotonous increase in protein levels, such that global protein fold changes at 12h post LPS correlate best to mRNA changes at 5h (fig. S13). Only a handful of proteins (e.g., Tnfaip2 (26, 35, 36)), show peaked, transient protein expression within our time scale; all have very high basal degradation rates, which typically do not increase further. Finally, a few key regulators of DCs and the LPS response (e.g., Cebpb, a pioneer transcription factor whose mRNA is already very highly expressed pre-stimulation, and Rela, Fig. 3F) are considerably dynamically regulated at the protein level, such that increased protein degradation rates (Rela) and/or increased per-mRNA translation rates (Rela and Cebpb) are main drivers for protein change. These dynamic changes cannot be observed solely from total protein and transcript levels, but the corresponding rate changes are readily apparent (Fig. 3F).
Notably, although our global model incorporates the data of only 3,147 genes, several lines of evidence suggest that this did not bias our global conclusions. First, while the 3,147 modeled genes are somewhat enriched for higher expressed genes (fig. S14), we do model a substantial number of lowly expressed mRNAs (fig. S14). Second, computationally
correcting for this bias by recalculating the contributions of mRNA, per-mRNA translation and protein degradation rates while proportionally up-weighting the impact of under-represented expression bins (29), does not significantly affect our conclusions (fig. S15). Third, the correlation between our protein translation at baseline (t=0h), as estimated by
Author Manuscript
Author Manuscript
Author Manuscript
pulsed-SILAC data or by TE values, is comparable when considering only the lowest expressed 25% (Pearson r~0.52), the highest expressed 25% (r~0.58), or all modeled proteins (r ~ 0.5) (figs. S16A, S16B). Finally, there is no significant difference in the distribution of TE values in the (under-represented) lowly expressed mRNA bins between those proteins we detect (in the 3,147 proteins) versus those we could not include in our model (P=0.069, t-test, figs. S16C); thus, it is unlikely that the lowly expressed genes that we could not model have unique regulatory modes.
Protein life cycle changes primarily affect proteins performing basic cellular functions
While mRNA fold changes contributed most to relative changes in protein expression (ratios of LPS to MOCK-simulated protein levels), protein synthesis and degradation rates do change significantly for 357 proteins (~11% of consistently detected proteins, tables S7, S8, (29)), and in particular for proteins performing essential cellular functions (‘housekeeping proteins’, Figs. 2B, 3E, table S6), including cytoskeletal, metabolic, ribosomal (Fig. 4A) and mitochondrial proteins (Fig. 4B). Since these are among the most abundant in the cell (13, 16, 37, 38), we reasoned that while mRNA changes may dominate the relative (fold) changes in protein levels following LPS stimulation, changes in the protein life cycle could contribute substantially more to differences in absolute cellular protein abundance than to relative changes. For example, consider two genes: gene 1 is induced 10-fold from 10,000 to 100,000 proteins (a substantial change in relative protein abundance), while gene 2 is induced 1.2-fold from 1,000,000 to 1,200,000 proteins (a substantial change in absolute protein abundance). We asked whether relative and absolute changes are associated with different regulatory mechanisms. Indeed, we found that changes in translation and
degradation rates together explain more of absolute protein changes than changes in mRNA levels (mRNA: ~32% to 43% of the fit value; per-mRNA protein production rate: ~22–41%; degradation rates: ~19–36%, Figs. 3D, S11C). Thus, post-transcriptional regulation
contributes substantially more to absolute protein level changes than to relative protein level changes.
An increase in degradation rates of mitochondrial proteins is associated with mitophagy
Upon LPS stimulation, a substantial decrease in the level of mitochondrial proteins is associated with increased degradation rates, although these proteins are among the most stable in unstimulated DCs (Figs. 2B, 3E, 4B, table S6). This increase in protein degradation is accompanied by a significant decrease in mRNA levels (Fig. 3E, table S6, P<10−10,
Wilcoxon rank-sum test) and in per-mRNA translation rates (Fig. 3E, table S6, P<10−7, Wilcoxon rank-sum test), suggesting decreased production of new mitochondrial proteins and increased destruction of old ones. Both structural mitochondrial proteins and enzymes in key mitochondrial metabolic pathways have increased degradation. The increased
degradation of key enzymes, such as SUCLA2, ALDH2 and ACO2, is consistent with a reported shift in LPS-stimulated DCs from oxidative phosphorylation and oxygen consumption to glycolysis, glucose consumption and lactate production (39–42). The increased loss of structural proteins and enzymes in the mitochondria may be due to either a targeted metabolic shift in carbon and energy metabolism through a reduction of a specific subset of the mitochondrial proteome, or a more global loss of entire mitochondria
Author Manuscript
Author Manuscript
Author Manuscript
through mitophagy. To experimentally distinguish between the two hypotheses, we measured the mitochondrial-to-nuclear DNA ratio in unstimulated DCs at 12h and 24h post LPS stimulation (the latter time point was chosen to account for any delay in complete mitochondrial DNA degradation) (Fig. 4C). There was no significant change in the ratio of mitochondrial-to-nuclear DNA at 12h post LPS stimulation, but a significant (~25%;
P=0.016, t-test) reduction at 24h post stimulation (Fig. 4C). Indeed, analyzing pulsed
SILAC data collected at 24h post LPS and mock stimulation, we saw a decrease in the M/L ratios (a proxy for increased degradation) of ~80% of annotated mitochondrial proteins in LPS vs. MOCK samples (Fig. 4D), and in nearly all mitochondrial proteins with a higher mitochondrial localization prediction score (from MitoCarta (43) – over 95% of the 156 proteins with a score > 20 of the 472 measured mitochondrial proteins) (fig. S17). These results suggest that mitophagy is a driver of LPS induced mitochondrial protein degradation in DCs, consistent with previous observations of mitophagy in virus- or bacteria-infected DCs (44) and might also contribute to epitope presentation, as previously proposed (45).
Discussion
We determined the contribution of changes in mRNA levels, protein synthesis and protein degradation rates during a dynamic response and found that changes in mRNA levels dominate relative fold changes. When considering also absolute changes in protein molecules (abundance), our data suggests a model where the cellular proteome is dynamically regulated through two strategies.
In the first strategy, mRNA regulation acts primarily to ensure that specific functions – here, immune response proteins – are only expressed when needed and thus explains most of the fold-change differences in protein levels, contributing to LPS induced protein fold changes at least 8 times as much as the combined protein life cycle within the 12h time scale of our measurements. It is possible that protein life cycle changes are important to turn over key regulatory and signaling proteins at later phases of the response. While our study does not directly address which steps in mRNA regulation account for this, our related work on the RNA life cycle during the first 3 hours in LPS stimulated DCs suggests that transcriptional changes may in turn dominate differential mRNA expression, whereas dynamic changes in RNA processing or degradation affect only a minority of genes, albeit with important functions (46). Furthermore, in contrast to previous reports where degradation rates contributed only marginally (16, 20), but consistent with Li et al. (6), we see that within the protein life cycle, changes in protein degradation rates play an equal role to changes in per-mRNA translation rates. Although some of this is due to turnover from increased secretion of some proteins (figs. S9C, S18), excluding the secretome (33) from our analysis did not strongly alter this global trend (fig. S18). Finally, while mRNA changes dominate changes in protein levels, it may be difficult to discern this relationship in the absence of a model-driven analysis. Thus, while mRNA induction is readily reflected in protein level induction, albeit somewhat dampened, few of the 912 repressed mRNAs (>2 fold), show matching protein changes (fig. S19, table S9). This could be naively interpreted as substantial posttranscriptional control, but pre-existing proteins, the long protein half-life and the delay of protein changes relative to mRNA changes (fig. S13) complicate such an intuitive
Author Manuscript
Author Manuscript
Author Manuscript
interpretation, and our analysis shows that mRNA changes drive protein down-regulation as well (fig. S12, table S5, (29)).
In the second strategy, regulation at the protein level primarily readjusts the pre-existing proteome, especially ‘housekeeping’ proteins, in order to meet the requirements of a new cellular state, such as change in shape, metabolism, etc. Thus, when we consider the contribution of a change in each rate to the change in the number of proteins (rather than the relative fold change), the contribution of changes in the protein life cycle is substantially increased (Fig. 3D). We find similar patterns of contributions when we use the Spearman rank correlation rather than Pearson correlation (fig. S20, (29)), suggesting that our conclusions are robust to outliers with particularly strong changes.
The extent to which this two-part strategy applies in other dynamic settings remains to be determined. Interestingly, recent studies comparing protein and translation rate differences between different states (e.g., differentiated vs. non-differentiated cells or between different yeast strains) suggested that translation rate differences affect differential protein expression only modestly (20, 47–51), but do impact some highly expressed proteins, including ribosomal proteins (49, 50), also translationally regulated in our system.
Our analysis of unstimulated (resting) postmitotic DCs refines and extends previous models of protein level regulation in steady state. In our cells, nearly two thirds of the gene-to-gene variation in total protein levels is explained by regulation of mRNA levels, a higher contribution than previously reported in dividing mammalian cells (16), possibly due to the regulatory mechanisms active in primary post-mitotic, homeostatic resting cells. For example, the increased role we observed for protein degradation, in contrast to prior studies (16, 20), may be needed by postmitotic cells that cannot simply renew their protein pool by division-coupled passive dilution. Furthermore, our analysis corrected for RNA-Seq expression reproducibility, intra-library protein expression reproducibility, and library-dependent protein expression biases ((29), fig. S21), all essential to avoid inadvertent attribution of measurement errors to modeled translation and protein degradation rates. Indeed, whereas from raw data mRNA explains 27% of the gene-to-gene variation in protein levels at baseline (t=0), using modeled expression values it explains 42%, and, once
correcting for data reproducibility (29), it explains 52%. This compares well to a recent study (6) that found that mRNA levels explain at least 56% of the differences in protein abundance (when estimating the variances of errors with control measurements (16)), and possibly as much as ~84% (using TE values to estimate the systematic error in translation rates in (16)). Each of these strategies highlights the importance of determining and correcting for stochastic and systematic errors in the data. Notably, even with our
conservative estimates, the protein life cycle is estimated to contribute, at minimum, about a third of the final steady state protein expression level. Since protein expression levels span around 4 to 5 orders of magnitude (13, 16, 37, 38), differences between genes in the protein life cycle can easily cause a ten to a hundred fold change in protein expression.
Our experimental and analytical design should be broadly applicable to study similar events in diverse dynamical cell systems. Our analytical model distinguishes per-mRNA protein production and protein degradation rates that were confounded in previous, model-free
Author Manuscript
Author Manuscript
Author Manuscript
analyses of raw H/L and M/L ratios from dynamic pulsed-SILAC data (20), due to e.g., the contribution of mRNA and protein degradation to the H/L signal and of recycled labeled amino acids to the M/L signal (29). Our empirical Bayes strategy also handles noise in proteomics data in a principled and conservative way. Nevertheless, we make some simplifying assumptions in our model (e.g., linear changes in per-mRNA translation rates and degradation rates) that may be refined in the future (e.g., with sigmoidal functions (22, 52, 53)), allowing us to estimate additional valuable parameters (e.g., time point of rate change). This would require finer-resolution data, such as from ribosome profiling (49, 54, 55), puromycin-associated nascent chain proteomics (56), or combining pulsed-SILAC labeling with pulse-labeling using the methionine analogue azidohomoalanine (33, 57). Such enhanced methods will provide a framework to study the contributions of the protein life cycle in diverse dynamic systems and help identify new key regulators of these responses.
Supplementary Material
Refer to Web version on PubMed Central for supplementary material.
Acknowledgments
We thank members of the Regev, Hacohen, and Carr groups, as well as G. Brar, N. Slavov and E. Airoldi for constant input and discussions. We thank K. Lage and A. Kashani for help with some of the analyses. This work was supported by NHGRI CEGS P50 HG006193 (A.R, N.H., S.C.) and Broad Institute Funds. A.R. was supported by an NIH Pioneer Award and HHMI. M.J. was supported by fellowships of the Swiss National Science Foundation for advanced researchers (SNF) and the Marie Sklodowska-Curie IOF. M.S.R. was supported by the NIH Training Program in Bioinformatics and Integrative Genomics training grant. S.S. was supported by a Rothschild
Fellowship, a European Molecular Biology Organization (EMBO) fellowship and by Human Frontier Science Program (HFSP) fellowships. E.H.R. was supported by the Howard Hughes Medical Institute Gilliam Fellowship for Advanced Study. Data have been deposited in GEO under accession number GSE59793. The original mass spectra may be downloaded from MassIVE (http://massive.ucsd.edu) using the identifier: MSV000078994. The data are accessible at ftp://MSV000078994:[email protected].
References and Notes
1. Sonenberg N, Hinnebusch AG. Regulation of translation initiation in eukaryotes: mechanisms and biological targets. Cell. 2009; 136:731–745. [PubMed: 19239892]
2. Chapman MA, et al. Initial genome sequencing and analysis of multiple myeloma. Nature. 2011; 471:467–472. [PubMed: 21430775]
3. Castello A, Fischer B, Hentze MW, Preiss T. RNA-binding proteins in Mendelian disease. Trends Genet TIG. 2013; 29:318–327. [PubMed: 23415593]
4. Komili S, Silver PA. Coupling and coordination in gene expression processes: a systems biology view. Nat Rev Genet. 2008; 9:38–48. [PubMed: 18071322]
5. Vogel C, Marcotte EM. Insights into the regulation of protein abundance from proteomic and transcriptomic analyses. Nat Rev Genet. 2012; 13:227–232. [PubMed: 22411467]
6. Li JJ, Bickel PJ, Biggin MD. System wide analyses have underestimated protein abundances and the importance of transcription in mammals. PeerJ. 2014; 2:e270. [PubMed: 24688849]
7. Gygi SP, Rochon Y, Franza BR, Aebersold R. Correlation between protein and mRNA abundance in yeast. Mol Cell Biol. 1999; 19:1720–1730. [PubMed: 10022859]
8. de Sousa Abreu R, Penalva LO, Marcotte EM, Vogel C. Global signatures of protein and mRNA expression levels. Mol Biosyst. 2009; 5:1512–1526. [PubMed: 20023718]
9. Maier T, Güell M, Serrano L. Correlation of mRNA and protein in complex biological samples. FEBS Lett. 2009; 583:3966–3973. [PubMed: 19850042]
10. Vogel C, et al. Sequence signatures and mRNA concentration can explain two-thirds of protein abundance variation in a human cell line. Mol Syst Biol. 2010; 610.1038/msb.2010.59
Author Manuscript
Author Manuscript
Author Manuscript
11. Schrimpf SP, et al. Comparative Functional Analysis of the Caenorhabditis elegans and Drosophila melanogaster Proteomes. PLoS Biol. 2009; 7:e48. [PubMed: 19260763]
12. Marguerat S, et al. Quantitative Analysis of Fission Yeast Transcriptomes and Proteomes in Proliferating and Quiescent Cells. Cell. 2012; 151:671–683. [PubMed: 23101633]
13. Wilhelm M, et al. Mass-spectrometry-based draft of the human proteome. Nature. 2014; 509:582– 587. [PubMed: 24870543]
14. Weiss M, Schrimpf S, Hengartner MO, Lercher MJ, von Mering C. Shotgun proteomics data from multiple organisms reveals remarkable quantitative conservation of the eukaryotic core proteome. Proteomics. 2010; 10:1297–1306. [PubMed: 20077411]
15. Khan Z, et al. Primate Transcript and Protein Expression Levels Evolve Under Compensatory Selection Pressures. Science. 2013; 342:1100–1104. [PubMed: 24136357]
16. Schwanhausser B, et al. Global quantification of mammalian gene expression control. Nature. 2011; 473:337–342. [PubMed: 21593866]
17. Vogel C, Silva GM, Marcotte EM. Protein Expression Regulation under Oxidative Stress. Mol Cell Proteomics. 2011; 1010.1074/mcp.M111.009217
18. Lee MV, et al. A dynamic model of proteome changes reveals new roles for transcript alteration in yeast. Mol Syst Biol. 2011; 710.1038/msb.2011.48
19. Maier T, et al. Quantification of mRNA and protein and integration with protein turnover in a bacterium. Mol Syst Biol. 2011; 7:511. [PubMed: 21772259]
20. Kristensen AR, Gsponer J, Foster LJ. Protein synthesis rate is the predominant regulator of protein expression during differentiation. Mol Syst Biol. 2013; 910.1038/msb.2013.47
21. Steinman RM, Banchereau J. Taking dendritic cells into medicine. Nature. 2007; 449:419–426. [PubMed: 17898760]
22. Rabani M, et al. Metabolic labeling of RNA uncovers principles of RNA production and degradation dynamics in mammalian cells. Nat Biotechnol. 201110.1038/nbt.1861
23. Mellman I, Steinman RM. Dendritic cells: specialized and regulated antigen processing machines. Cell. 2001; 106:255–258. [PubMed: 11509172]
24. Amit I, et al. Unbiased reconstruction of a mammalian transcriptional network mediating pathogen responses. Science. 2009; 326:257–263. [PubMed: 19729616]
25. Garber M, et al. A High-Throughput Chromatin Immunoprecipitation Approach Reveals Principles of Dynamic Gene Regulation in Mammals. Mol Cell. 2012; 47:810–822. [PubMed: 22940246] 26. Chevrier N, et al. Systematic Discovery of TLR Signaling Components Delineates Viral-Sensing
Circuits. Cell. 2011; 147:853–867. [PubMed: 22078882]
27. Shalek AK, et al. Single-cell transcriptomics reveals bimodality in expression and splicing in immune cells. Nature. 2013; 498:236–240. [PubMed: 23685454]
28. Boisvert F-M, et al. A quantitative spatial proteomics analysis of proteome turnover in human cells. Mol Cell Proteomics. 201110.1074/mcp.M111.011429
29. Supplementary Online Material (SOM).
30. Subtelny AO, Eichhorn SW, Chen GR, Sive H, Bartel DP. Poly(A)-tail profiling reveals an embryonic switch in translational control. Nature. 2014; 508:66–71. [PubMed: 24476825] 31. Schmidt EK, Clavarino G, Ceppi M, Pierre P. SUnSET, a nonradioactive method to monitor
protein synthesis. Nat Meth. 2009; 6:275–277.
32. Lelouard H, et al. Regulation of translation is required for dendritic cell function and survival during activation. J Cell Biol. 2007; 179:1427–1439. [PubMed: 18166652]
33. Eichelbaum K, Winter M, Diaz MB, Herzig S, Krijgsveld J. Selective enrichment of newly synthesized proteins for quantitative secretome analysis. Nat Biotechnol. 201210.1038/nbt.2356 34. Sanada T, et al. FLN29 deficiency reveals its negative regulatory role in the Toll-like receptor
(TLR) and retinoic acid-inducible gene I (RIG-I)-like helicase signaling pathway. J Biol Chem. 2008; 283:33858–33864. [PubMed: 18849341]
35. Kuan AP, et al. Genetic control of autoimmune myocarditis mediated by myosin-specific antibodies. Immunogenetics. 1999; 49:79–85. [PubMed: 9887344]
36. Burton PR, et al. Genome-wide association study of 14,000 cases of seven common diseases and 3,000 shared controls. Nature. 2007; 447:661–678. [PubMed: 17554300]
Author Manuscript
Author Manuscript
Author Manuscript
37. Kim MS, et al. A draft map of the human proteome. Nature. 2014; 509:575–581. [PubMed: 24870542]
38. Geiger T, et al. Initial Quantitative Proteomic Map of 28 Mouse Tissues Using the SILAC Mouse. Mol Cell Proteomics. 2013; 12:1709–1722. [PubMed: 23436904]
39. Everts B, et al. Commitment to glycolysis sustains survival of NO-producing inflammatory dendritic cells. Blood. 2012; 120:1422–1431. [PubMed: 22786879]
40. Krawczyk CM, et al. Toll-like receptor–induced changes in glycolytic metabolism regulate dendritic cell activation. Blood. 2010; 115:4742–4749. [PubMed: 20351312]
41. Pearce EL, Pearce EJ. Metabolic Pathways in Immune Cell Activation and Quiescence. Immunity. 2013; 38:633–643. [PubMed: 23601682]
42. Everts B, et al. TLR-driven early glycolytic reprogramming via the kinases TBK1-IKKε supports the anabolic demands of dendritic cell activation. Nat Immunol. 2014; 15:323–332. [PubMed: 24562310]
43. Pagliarini DJ, et al. A mitochondrial protein compendium elucidates complex I disease biology. Cell. 2008; 134:112–123. [PubMed: 18614015]
44. Lupfer C, et al. Receptor interacting protein kinase 2-mediated mitophagy regulates inflammasome activation during virus infection. Nat Immunol. 2013; 14:480–488. [PubMed: 23525089]
45. Bell C, et al. Quantitative proteomics reveals the induction of mitophagy in TNF-α activated macrophages. Mol Cell Proteomics. 201310.1074/mcp.M112.025775
46. Rabani M, et al. High-resolution sequencing and modeling identifies distinct dynamic RNA regulatory strategies. Cell. 2014; 159:1698–1710. [PubMed: 25497548]
47. Baek D, et al. The impact of microRNAs on protein output. Nature. 2008; 455:64–71. [PubMed: 18668037]
48. Selbach M, et al. Widespread changes in protein synthesis induced by microRNAs. Nature. 2008; 455:58–63. [PubMed: 18668040]
49. Ingolia NT, Lareau LF, Weissman JS. Ribosome Profiling of Mouse Embryonic Stem Cells Reveals the Complexity and Dynamics of Mammalian Proteomes. Cell. 2011; 147:789–802. [PubMed: 22056041]
50. Hsieh AC, et al. The translational landscape of mTOR signalling steers cancer initiation and metastasis. Nature. 2012; 485:55–61. [PubMed: 22367541]
51. Albert FW, Muzzey D, Weissman JS, Kruglyak L. Genetic Influences on Translation in Yeast. PLoS Genet. 2014; 10:e1004692. [PubMed: 25340754]
52. Chechik G, et al. Activity motifs reveal principles of timing in transcriptional control of the yeast metabolic network. Nat Biotechnol. 2008; 26:1251–1259. [PubMed: 18953355]
53. Yosef N, Regev A. Impulse Control: Temporal Dynamics in Gene Transcription. Cell. 2011; 144:886–896. [PubMed: 21414481]
54. Ingolia NT, Ghaemmaghami S, Newman JRS, Weissman JS. Genome-wide analysis in vivo of translation with nucleotide resolution using ribosome profiling. Science. 2009; 324:218–23. [PubMed: 19213877]
55. Stern-Ginossar N, et al. Decoding Human Cytomegalovirus. Science. 2012; 338:1088–1093. [PubMed: 23180859]
56. Aviner R, Geiger T, Elroy-Stein O. Novel proteomic approach (PUNCH-P) reveals cell cycle-specific fluctuations in mRNA translation. Genes Dev. 2013; 27:1834–1844. [PubMed: 23934657] 57. Eichelbaum K, Krijgsveld J. Rapid temporal dynamics of transcription, protein synthesis and
secretion during macrophage activation. Mol Cell Proteomics. 2014 mcp.M113.030916. 58. Lutz MB, et al. An advanced culture method for generating large quantities of highly pure
dendritic cells from mouse bone marrow. J Immunol Methods. 1999; 223:77–92. [PubMed: 10037236]
59. Ong SE, Mann M. A practical recipe for stable isotope labeling by amino acids in cell culture (SILAC). Nat Protoc. 2006; 1:2650–2660. [PubMed: 17406521]
60. Engreitz JM, et al. The Xist lncRNA Exploits Three-Dimensional Genome Architecture to Spread Across the X Chromosome. Science. 201310.1126/science.1237973
Author Manuscript
Author Manuscript
Author Manuscript
61. Rappsilber J, Mann M, Ishihama Y. Protocol for micro-purification, enrichment, pre-fractionation and storage of peptides for proteomics using StageTips. Nat Protoc. 2007; 2:1896–1906. [PubMed: 17703201]
62. Mertins P, et al. Integrated proteomic analysis of post-translational modifications by serial enrichment. Nat Methods. 2013; 10:634–637. [PubMed: 23749302]
63. Cox J, Mann M. MaxQuant enables high peptide identification rates, individualized p.p.b.-range mass accuracies and proteome-wide protein quantification. Nat Biotechnol. 2008; 26:1367–72. [PubMed: 19029910]
64. Ahrné E, Molzahn L, Glatter T, Schmidt A. Critical assessment of proteome-wide label-free absolute abundance estimation strategies. PROTEOMICS. 2013; 13:2567–2578. [PubMed: 23794183]
65. Peng M, et al. Protease bias in absolute protein quantitation. Nat Methods. 2012; 9:524–525. [PubMed: 22669647]
66. Pozzi F, Matteo TD, Aste T. Exponential smoothing weighted correlations. Eur Phys J B. 2012; 85:1–21.
67. Ingolia NT, Brar GA, Rouskin S, McGeachy AM, Weissman JS. The ribosome profiling strategy for monitoring translation in vivo by deep sequencing of ribosome-protected mRNA fragments. Nat Protoc. 2012; 7:1534–1550. [PubMed: 22836135]
68. Langmead B, Salzberg SL. Fast gapped-read alignment with Bowtie 2. Nat Methods. 2012; 9:357– 359. [PubMed: 22388286]
69. Kim D, et al. TopHat2: accurate alignment of transcriptomes in the presence of insertions, deletions and gene fusions. Genome Biol. 2013; 14:R36. [PubMed: 23618408]
70. Hahsler, M.; Buchta, C.; Hornik, K. Infrastructure for seriation. 2014. http://CRAN.R-project.org/
71. Hahsler M, Hornik K, Buchta C. Getting Things in Order: An Introduction to the R Package seriation. J Stat Softw. 2008; 25:1–34.
72. Blake JA, Bult CJ, Eppig JT, Kadin JA, Richardson JE. The Mouse Genome Database: integration of and access to knowledge about the laboratory mouse. Nucleic Acids Res. 2014; 42:D810–D817. [PubMed: 24285300]
73. Guo W, Jiang L, Bhasin S, Khan SM, Swerdlow RH. DNA extraction procedures meaningfully influence qPCR-based mtDNA copy number determination. Mitochondrion. 2009; 9:261–265. [PubMed: 19324101]
Author Manuscript
Author Manuscript
Author Manuscript
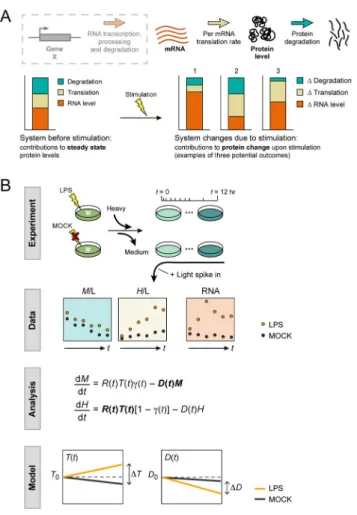
Figure 1. Framework to study the dynamic protein life cycle
(A) The dynamic protein life cycle. Top: RNA transcription, processing and degradation
(dashed grey box) determine mRNA levels (red), which together with per-mRNA translation (tan) and protein degradation/removal (blue) determine final protein levels. Bottom:
Hypothetical contribution of each process (stacked chart) to protein levels at steady-state (left) or to fold changes (right, three hypothetical scenarios). (B) Experimental and analysis workflow. From top to bottom: experimental system (“Experiment”) consistent of DCs grown in medium-heavy SILAC (M) medium until LPS (top) or MOCK (bottom) stimulation, when heavy (H) SILAC is substituted. A “standard”, light (L) SILAC labeled sample is spiked in. The resulting measurements (“Data”) include M/L and H/L ratios (proxies for protein degradation/removal and production, respectively), as well as RNA-Seq data at each time point. These are used to fit the parameters of an ODE model (“Analysis”), where R(t) = modeled mRNA change over time; T(t) and D(t) = per-mRNA translation and protein degradation rate constants over time, respectively; (t) = recycling (‘impurity’) rate; H(t) and M(t) = modeled change in heavy (H/L) and medium (M/L) channels, respectively. The results (“Model”) are the estimated per-mRNA translation and protein degradation rates over time. See text and (29) for details.
Author Manuscript
Author Manuscript
Author Manuscript
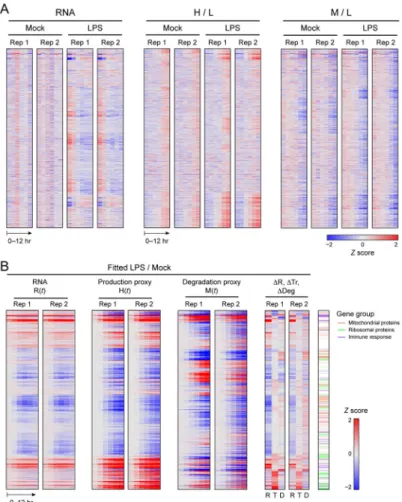
Figure 2. The protein life cycle in LPS stimulated DCs
(A) Shown are (left to right) for all 2,288 genes (rows) that were quantified in all samples,
mRNA expression, H/L protein expression and M/L protein expression in LPS and MOCK stimulated DCs from each replicate (columns). Gene order is the same across all heatmaps, and determined by hierarchical clustering of fitted fold changes in mRNA level, translation rate, and degradation rate. Values are median normalized by row, logged, and robust z-transformed per map (color scale). (B) Fitted differential expression of the same 2,288 genes (rows). Left to right: Robust z-score fitted differential expression ratios (LPS/MOCK; red/ blue color scale) for R(t), H(t) and M(t) in LPS vs. MOCK stimulated DCs from each replicate (columns) with the log2 fold changes between LPS and MOCK stimulated DCs at 12h post stimulation for mRNA (ΔR), per-mRNA translation rate (ΔTr), and protein degradation rate (ΔDeg) (also z-scored). Right most column: immune response (purple), ribosomal (green) and mitochondrial (orange) proteins.
Author Manuscript
Author Manuscript
Author Manuscript
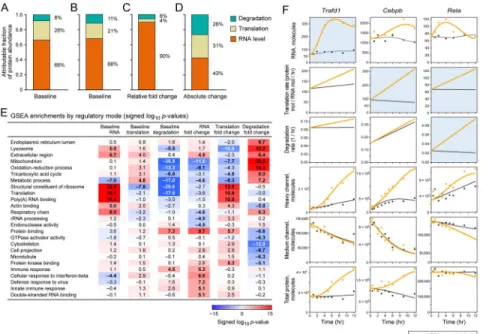
Figure 3. Contributions of mRNA levels and the protein life cycle to steady state and dynamic protein levels
(A–D) Global contributions of mRNA levels (orange); translation rates (tan); and protein degradation rates (blue) to protein levels. Translation rates were either derived from pSILAC data (A, C and D) or from TE values from ribosome profiling data (B). Contributions to steady state protein levels prior to LPS induction (A and B) or to the change in protein abundance between LPS induced and mock treated cells (C and D) are shown. The contributions to the fold change (C) and to the absolute change in protein abundances (D) after LPS stimulation are given. Note that the contributions for steady state presented exclude the percent of the variance in measured protein levels that is not explained by the variance in mRNA, translation or protein degradation (fig. S10). Per-gene parameter values were in the order: 1. mRNA; 2. translation; 3. degradation (29). For all possible orderings see fig. S11. (E) Functional processes controlled by distinct regulatory steps. For each process (rows) and regulatory step (columns) shown are the magnitudes of the log10
(P-values) for the values or differential fold changes (LPS/MOCK at 12h) of mRNA levels, protein synthesis or degradation rates of genes annotated to this process vs. the background of all genes fit by the model. Values are signed according to directionality of the enrichment (Wilcoxon rank-sum test). Shown are the 5 gene sets most enriched for increased or
decreased rates for the three ‘fold change’ columns, along with their scores in all six regulatory modes. Nearly-redundant gene sets were removed (see table S6 for all gene sets). (F) Examples of regulation of expression dynamics. For each of three genes in each of LPS (orange) and MOCK (black) condition shown are the measured values (dots) and fits (curves) for (top to bottom) mRNA levels (in mRNA molecules), per-mRNA translation rates (protein molecules / mRNA molecule / hour (hr)), degradation rates (1/hr), H(t), M(t) and total protein ((M+H)(t)). X-axis: time; Y-axis: intensity or rate. Light blue: key regulatory mode. mRNA and protein molecules are only proxies for transcripts per million (TPM) and IBAQ microshares, respectively, in order to help interpretation (29).
Author Manuscript
Author Manuscript
Author Manuscript
Figure 4. Degradation of mitochondrial proteins following LPS stimulation is associated with mitophagy
(A, B) Increased translation rates of some ribosomal proteins (A) and increased degradation
rates of mitochondrial proteins (B). Shown are the distributions of log2 fold changes of translation rates (ΔTi, A) or degradation rates (ΔDi, B) between LPS and MOCK stimulated
cells of all measured ribosomal proteins (A, red) or mitochondrial proteins (B, red; from Mitocarta annotations (43)), and all measured proteins (grey). (C) Evidence of mitophagy in LPS stimulated DCs. Shown is the mitochondrial to nuclear DNA ratio (Y axis) in DCs at 0h, 12h and 24h post LPS stimulation (X axis). Values are normalized to the average mitochondrial to nuclear DNA ratio at 0h. Asterisk: a significant change relative to 0h (P-value = 0.016, t-test, n=3). (D) Distribution of raw log2 LPS/MOCK M/L ratios (a proxy for
protein decay) for all measured mitochondrial proteins (in Mitocarta (43)) at 12h (black) and 24h (grey) post stimulation.