HAL Id: hal-00318365
https://hal.archives-ouvertes.fr/hal-00318365
Submitted on 29 Aug 2007
HAL is a multi-disciplinary open access
archive for the deposit and dissemination of
sci-entific research documents, whether they are
pub-lished or not. The documents may come from
teaching and research institutions in France or
abroad, or from public or private research centers.
L’archive ouverte pluridisciplinaire HAL, est
destinée au dépôt et à la diffusion de documents
scientifiques de niveau recherche, publiés ou non,
émanant des établissements d’enseignement et de
recherche français ou étrangers, des laboratoires
publics ou privés.
Storm enhanced density: magnetic conjugacy effects
J. C. Foster, W. Rideout
To cite this version:
J. C. Foster, W. Rideout. Storm enhanced density: magnetic conjugacy effects. Annales Geophysicae,
European Geosciences Union, 2007, 25 (8), pp.1791-1799. �hal-00318365�
www.ann-geophys.net/25/1791/2007/ © European Geosciences Union 2007
Annales
Geophysicae
Storm enhanced density: magnetic conjugacy effects
J. C. Foster and W. Rideout
MIT Haystack Observatory, Westford, MA 01886, USA
Received: 17 April 2007 – Accepted: 16 July 2007 – Published: 29 August 2007
Abstract. In the early phases of a geomagnetic storm,
the low and mid-latitude ionosphere are greatly perturbed. Large SAPS electric fields map earthward from the per-turbed ring current overlapping and eroding the outer plas-masphere and mid-latitude ionosphere, drawing out extended plumes of storm enhanced density (SED). We use combined satellite and ground-based observations to investigate the degree of magnetic conjugacy associated with specific fea-tures of the stormtime ionospheric perturbation. We find that many ionospheric disturbance features exhibit degrees of magnetic conjugacy and simultaneity which implicate the workings of electric fields. TEC enhancements on inner-magnetospheric field lines at the base of the SED plumes ex-hibit localized and longitude-dependent features which are not strictly magnetic conjugate. The SED plumes stream-ing away from these source regions closely follow magnetic conjugate paths. SED plumes can be used as a tracer of the location and strength of disturbance electric fields. The SED streams of cold plasma from lower latitudes enter the polar caps near noon, forming conjugate tongues of ionization over the polar regions. SED plumes exhibit close magnetic conju-gacy, confirming that SED is a convection electric field dom-inated effect. Several conclusions are reached:
1) The SED plume occurs in magnetically-conjugate re-gions in both hemispheres.
2) The position of the sharp poleward edge of the SED plume is closely conjugate.
3) The SAPS electric field is observed in magnetically conjugate regions (SAPS channel).
4) The strong TEC enhancement at the base of the SED plume in the north American sector is more extensive than in its magnetic conjugate region.
5) The entry of the SED plume into the polar cap near noon, forming the polar tongue of ionization (TOI), is seen in both hemispheres in magnetically-conjugate regions.
Keywords. Ionosphere (Ionospheric disturbances;
Mid-latitude ionosphere) – Magnetospheric physics (Magnetosphere-ionosphere interactions)
Correspondence to: J. C. Foster
1 Introduction
In the initial hours of a geomagnetic disturbance a positive-phase enhancement of ionospheric density and total electron content (TEC) often occurs at mid and low latitudes (e.g. re-views by Buonsanto, 1999, and Mendillo, 2006). As dis-cussed in detail by Mendillo (2006, and references therein), in this region magnetic field lines extend upward into the plasmasphere and the positive- phase disturbances occur as neutral winds and penetrating electric fields redistribute the low and mid-latitude plasma in latitude, longitude, and alti-tude.
1.1 Storm enhanced density
The overall stormtime enhancement of TEC at low and mid latitudes consists of two parts. First is the increase of TEC seen at and poleward of the crests of the equatorial anoma-lies associated with plasma uplift and redistribution from low to mid latitudes (e.g. Tsurutani et al., 2004; Foster et al., 2005a). In sunlight, ion production at lower altitudes increases TEC as the F-region peak height is raised while electric fields perpendicular to B redistribute the plasma in latitude and longitude. This occurs inside the plasmasphere boundary layer (PBL) (Carpenter and Lemaire, 2004), the boundary between the corotating field lines of the plasmas-phere and the outer magnetosplasmas-phere. This mid-latitude TEC enhancement serves as a source population for the plumes of storm enhanced density (SED) (Foster, 1993) that are eroded by disturbance electric fields in the PBL. Storm enhanced density occurs when low-latitude cold plasma is transported sunward (towards noon) at the inner edge of the convection electric field. The SED terminology was introduced (Foster, 1993) to indicate the spatially-continuous two-dimensional plume of enhanced density and TEC spanning the disturbed ionosphere from its dusk-sector source to the vicinity of the noontime cusp. At sub-auroral latitudes the sunward-convecting SED appears as the ionospheric storm positive-phase dusk effect enhancement discussed in detail in the re-cent review by Mendillo (2006). Early observations of the SED with incoherent scatter radar (ISR, e.g. Evans, 1973) identified the westward/sunward motion of the ionospheric
1792 J. C. Foster and W. Rideout: Storm enhanced density: magnetic conjugacy effects enhancement. Two-dimensional snapshots of the extent of
the SED plume have been derived from ISR azimuth scans (e.g. Foster, 1993), and more emphatically by GPS TEC maps covering a wide spatial region (e.g. Coster et al., 2003). Combining ISR (e.g. Foster et al., 2004) or DMSP (e.g. Fos-ter et al., 2007) ion convection observations with the GPS TEC identification of the SED plumes and their spatial ex-tent has reaffirmed the conclusion that the SED plumes are formed as low or sub-auroral latitude plasma is transported rapidly towards the dayside cusp in the convection electric field.
Plasma convection and redistribution associated with the disturbance electric field are very important in determining SED characteristics. In the plasmasphere boundary layer, the sub- auroral polarization stream electric field (SAPS) (Fos-ter and Burke, 2002) forms as pressure gradients at the inner edge of the magnetospheric ring current drive Region-2 field-aligned currents into the evening-sector ionosphere. Large poleward-directed electric fields at ionospheric heights are set up to drive closure currents across the low-conductivity region equatorward of the auroral electron precipitation. The inward extent of the SAPS overlaps and erodes the outer plasmasphere and mid-latitude ionosphere, drawing out the extended plumes of storm enhanced density which span the dusk sector, transporting plasmaspheric and lower-latitude ionospheric material to the noontime cusp. In the presence of a strong convection electric field (>50 mV/m at iono-spheric heights) ion-neutral collisions and the ion recombi-nation rate are increased (Schunk et al., 1976). As a result, in the presence of a strong electric field, a deep ionospheric trough forms co-located with the center of the SAPS chan-nel. At lower latitudes in regions of lesser electric field, plasma transport within the SED plume enhances TEC, re-sulting is steep latitude gradients in TEC and ionospheric density across the poleward boundary of the SED plume (Vo and Foster, 2001).
Combining ground (GPS TEC) and space-based (IMAGE EUV) cold plasma imaging techniques, Foster et al. (2002) demonstrated that the ionospheric SED plume observed dur-ing the strong 31 March 2003 event mapped into the low-altitude signature of a plasmaspheric erosion plume viewed from space. Goldstein et al. (2005) have modeled the for-mation of the plasmasphere erosion plume and conclude that inclusion of the SAPS electric field is needed to account for the characteristics of the outer boundary of the plume, which maps to the poleward edge of the SED seen at ionospheric heights. Foster et al. (2004) used direct radar observations of the sunward E×B plasma convection to quantify the flux of ions carried by the SED plume to the noontime F-region in the vicinity of the cusp. Foster et al. (2005b) found that this streaming low- latitude plasma (the SED) forms a source for the polar tongues of ionization (TOI) which are seen in disturbed conditions.
A preponderance of the literature describing SED has in-volved observations made over the heavily-instrumented
re-gions of North America, leading to questions concerning the global nature of the phenomena reported. Recent reports have identified SED features over Europe (e.g. Moen et al., 2006) and have intercompared characteristics of SED seen in the european and american sectors (Coster et al., 2007). The strong association of the SED features with electric fields (which map along field lines between hemispheres) suggests that SED occurrence and characteristics should exhibit mag-netic conjugacy effects, but to date this aspect of SED global phenomenology has not been addressed in detail.
1.2 Magnetic conjugacy of the localized TEC enhancement Foster et al. (2005a) and Foster and Coster (2007) discuss observations of a localized enhancement of TEC seen at the base of the erosion plume. Ground based observations with GPS TEC and incoherent scatter radar, and in situ DMSP measurements in the topside ionosphere, suggested that this enhanced TEC results from a poleward redistribution of post-noon sector low latitude ionospheric plasma during the early stages of a strong geomagnetic disturbance. IMAGE FUV observations reveal that such a TEC increase seen from the ground during the 30 May 2003 event was associated with a localized enhancement in the vicinity and poleward of the equatorial anomaly peak (Immel et al., 2005). Once formed, these localized TEC enhancements approximately corotate in place at a fixed longitude. The occurrence and magni-tude of such TEC enhancements appears to be especially pro-nounced over the Americas, and Foster et al. (2005a) sug-gested that this results from a strengthening of the equato-rial ion fountain due to undershielded (penetrating) electric fields in the vicinity of the South Atlantic magnetic anomaly. Vlasov et al. (2003) and Kelley et al. (2004) describe pro-cesses which could be involved in creating such TEC en-hancements near the dusk terminator in the presence of pen-etrating stormtime electric fields. They conclude that in ad-dition to an eastward electric field needed to uplift and desta-bilize the low-latitude ionosphere and to enhance and spread the equatorial anomaly peaks, a poleward electric field com-ponent is needed to account for the significant increase of TEC poleward of the anomaly crests. However, a full char-acterization of this phenomenon and an explanation of the mechanisms involved have yet to be described.
Foster and Coster (2007) address the conjugacy of such TEC enhancements at the base of the SED plume in the American-sector. For the 15 July 2000 event, DMSP F14 passed directly through the magnetically-conjugate N and S Hemisphere GPS TEC enhancements. Ground-based GPS TEC observed a simultaneous factor of 2–5 increase to
>200 TECu in the magnetically conjugate regions. Direct
observations of cross-track plasma drift made with the F14 ion drift meter indicated that the enhanced TEC regions were approximately corotating in place over the positions in which they were formed earlier in the event. Foster et al. (2005a) presented similar observations showing an identical timing
and relationship between TEC over Florida and over its con-jugate point in Brazil for the 30 May 2003 event. These stud-ies have pointed out the repeatability of the localized TEC enhancements at the base of the plume in the American sec-tor and have made the case that such events involve the re-distribution of cold plasma from low and mid latitudes in the vicinity of the SAA to PBL field lines near dusk in the con-jugate hemispheres.
2 Observations
In this paper we examine geomagnetically-conjugate obser-vations of TEC observed with ground-based GPS arrays and with the space-based Jason and TOPEX satellites. Prior studies have combined these ground and space-based data sets with other instruments to investigate the global na-ture of stormtime ionospheric disturbances, revealing sig-nificant perturbations encircling the globe (e.g. Tsurutani et al., 2004). In this study, we compare TEC observations in magnetically- conjugate regions, permitting identification of features and boundaries which are, and are not, closely aligned in the two hemispheres. GPS TEC observations, most of which come from land- based observing sites, are very sparse in the Southern Hemisphere and, in particular, over the south Pacific ocean, at points lying magnetically conjugate to the concentrated observing array over the con-tinental USA. The Jason and TOPEX space-based observa-tions, limited to times when the satellites are flying above the oceans, provide a database of observations magnetically conjugate to TEC observations obtained with the U.S. GPS receiver network.
2.1 GPS total electron content
We use the distributed array of ground-based GPS receivers to derive maps of vertical total electron content (TEC) over the North and South American continents (e.g. Coster et al., 2003). The satellites of the GPS constellation are in 12-h circular orbits (∼20 000-km altitude) with orbital inclina-tion ∼55◦, giving coverage to L∼4 from low-latitude
re-ceiver sites. The vertical TEC presented here is the com-bined contribution of the ionosphere and overlying plas-masphere. We use the MIT MAPGPS software package (Rideout and Coster, 2006) which provides automated pro-cessing of GPS data into global TEC maps. MAPGPS downloads data from all available GPS receivers, deter-mines receiver biases, deterdeter-mines vertical TEC and iono-sphere penetration point (at 350 km altitude), and deter-mines median TEC values independently in bins with the chosen latitude and longitude spacing. GPS TEC data are processed routinely. Global maps and data are available via the MADRIGAL database (http://madrigal.haystack.mit. edu/madrigal/index.html). These GPS analysis and mapping capabilities have been used to support a number of studies of
stormtime and space weather disturbance phenomena (e.g. Foster et al., 2002; Coster et al., 2003; Foster and Rideout, 2005).
2.2 Jason/TOPEX TEC
The NASA/CNES joint satellite project, TOPEX/Poseidon, has provided global ocean coverage at latitudes equatorward of 66 degrees since 1992. Data from a NASA dual-frequency (5.3 and 13.6 GHz) altimeter are used to determine vertical ionospheric TEC below the 1346 km circular orbital altitude (e.g. Jee et al., 2004). TEC measurements are obtained at a rate of one per second for ionosphere heights beneath the satellite as the downward-directed dual-frequency transmis-sions are reflected from the sea surface below. Studies inter-comparing simultaneous GPS and TOPEX TEC observations find a very good comparison (e.g. Vladimer et al., 1997). The Jason satellite carries similar instrumentation. Jason nadir-directed TEC intercompares closely with that measured by TOPEX (Ping et al., 2004). The TOPEX and Jason observa-tions of vertical TEC over the oceans provide complementary data sets to the land-based GPS TEC data. For the intervals of interest in this study, TOPEX and Jason orbits traversing the southern Pacific ocean are used, as such passes sample the ionosphere along tracks whose magnetic conjugate points cross the U.S. mainland.
2.3 Conjugate TEC observations: method
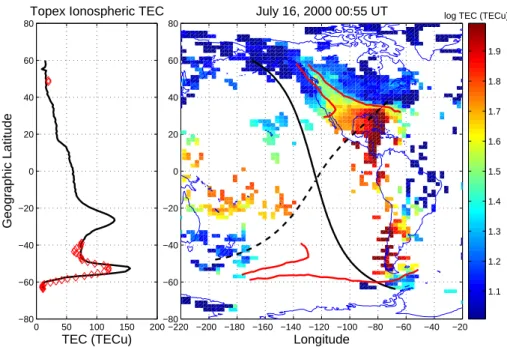
Figure 1 presents the format we will use to intercompare TOPEX/Jason and GPS TEC observations to investigate the magnetic conjugacy of disturbance-induced ionospheric per-turbations. At the right we present a color-coded map of log vertical TEC in TEC units (1 TECu=1016electrons m−2
col-umn density). At the time shown, late in the 15/16 July 2000 Bastille Day storm, a residual TEC plume extends to the NW across the U.S. and Canada from an enhanced TEC source over Florida and the Caribbean (e.g. Foster et al., 2005a). A red line has been drawn at the 40 TECu iso-contour, out-lining the spatial extent of the plume visible in the ground-based GPS TEC data. Assuming a 350-km altitude for the ionospheric TEC observations, this contour has been mapped point by point to the Southern Hemisphere using the IGRF magnetic field model. Although stormtime distortion of the magnetic field is expected, for this inner-magnetosphere re-gion (L<4) this distortion is not expected to be severe. A heavy black line denotes the N to S orbital track of the TOPEX satellite (TOPEX traverses the field of view shown in ∼20 min and 20-min averaging has been used in prepar-ing the GPS TEC map). The magnetic conjugate of the TOPEX orbit has been calculated and is denoted by the heavy dashed black line. The conjugate orbit crosses North Amer-ica, where good GPS TEC coverage is available, intersecting the regions of low-latitude TEC enhancement and the SED plume. To the left, we plot the vertical TEC measured by
1794 J. C. Foster and W. Rideout: Storm enhanced density: magnetic conjugacy effects −220 −200 −180 −160 −140 −120 −100 −80 −60 −40 −20 −80 −60 −40 −20 0 20 40 60 80 Longitude
July 16, 2000 00:55 UT log TEC (TECu)
1.1 1.2 1.3 1.4 1.5 1.6 1.7 1.8 1.9 0 50 100 150 200 −80 −60 −40 −20 0 20 40 60 80
Topex Ionospheric TEC
Geographic Latitude
TEC (TECu)
Fig. 1. Right: A 20-min snapshot of log GPS TEC is shown. The heavy black line denotes the N to S orbital track of the TOPEX satellite and
the heavy dashed line indicates the magnetic conjugate orbit. Red lines outline the boundaries of the SED plume and its conjugate location. Left: TOPEX vertical TEC (heavy black line) is shown as a function of latitude. Values of GPS TEC observed along the conjugate TOPEX orbit are plotted point by point (red diamonds) at their corresponding conjugate latitudes, on top of the direct TOPEX TEC observations.
TOPEX along its direct orbit (heavy black line) as a function of latitude along the orbital track depicted in the right panel. By comparing with the position of the mapped red contours we see that, in the Southern Hemisphere, the TOPEX orbit crosses the region conjugate to the TEC enhancement over central America. The conjugate to the poleward boundary of the SED plume is crossed near −60◦latitude. Wherever the
conjugate TOPEX orbit (dashed curve) intersects a region of the GPS TEC map for which we have data, we determine the underlying value of GPS TEC. These values of GPS TEC are plotted point by point in the left-hand panel (red diamonds) at their corresponding conjugate latitudes, on top of the di-rect TOPEX TEC observations. In these regions, we have a direct comparison of TEC observed by TOPEX with the GPS TEC observed at magnetic conjugate points. In the follow-ing section we present several examples of such conjugate TEC comparisons, and interpret the observations in terms the global character of stormtime ionospheric disturbances and the processes which drive them.
2.4 Magnetic conjugacy of ionospheric perturbations Using the technique described above, we find very good agreement between observations of the SED plume itself in conjugate hemispheres. During the 16 July 2000 event shown in Fig. 1, Topex crossed the SED plume in the Southern Hemisphere at latitude/longitude ∼[54 S, 98 W] at
∼∼01:00 UT (∼20:00 LT). The latitude extent and shape
of the SED plume observed was very similar to that seen
by GPS TEC in the magnetic conjugate region (lat/long
∼[30 N, 86 W], ∼19:00 LT). At the position of the SED
ob-servation, solar zenith angle (SZA) at 350 km altitude was 110◦ (shadow height 395 km) in the south, and SZA ∼91◦
(shadow height 0 km) in the north. Foster and Coster (2007) described the close similarity of the development of TEC at the base of the northern plume, and at its magnetic conju-gate point during this event, noting that the SZA in the south was such that local production at the point of observation could not explain the large TEC increase seen in the South-ern Hemisphere.
TOPEX observations in the South Hemisphere (black line) show that the SED plume was separated by ∼25◦ latitude
from the location of the enhanced crest of the equatorial ionization anomaly (EIA) where TEC exceeded 125 TECu. Peak TEC in the northern EIA region (∼10◦N latitude) was
<60 TECu. Maximum TEC in the SED was ∼155 TECu in
the south and ∼130 TECu (from GPS TEC observations) at the conjugate point in the north at this time.
2.4.1 Conjugacy of the SED plume
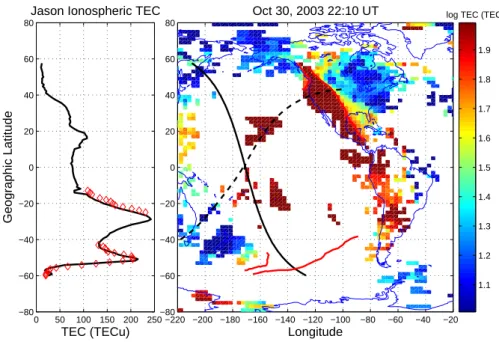
An excellent comparison of SED plume characteristics in the south and the north was found for the magnetic superstorm on 30 October 2003 as shown in Fig. 2 for observations near 22:10 UT. TOPEX crossed the SED plume at ∼52 S lati-tude over the central Pacific ocean (∼140 W longilati-tude) at a point magnetically conjugate to the intense enhancement of TEC observed over the SW USA (cf. Foster and Rideout,
−220 −200 −180 −160 −140 −120 −100 −80 −60 −40 −20 −80 −60 −40 −20 0 20 40 60 80 Longitude Oct 30, 2003 22:10 UT 1.1 1.2 1.3 1.4 1.5 1.6 1.7 1.8 1.9 0 50 100 150 200 250 −80 −60 −40 −20 0 20 40 60 80
Jason Ionospheric TEC
Geographic Latitude
TEC (TECu)
log TEC (TECu)
Fig. 2. Characteristics of the strong SED plume (>200 TECu) seen over the U.S. mainland and at its magnetic conjugate are similar for the 30
October 2003 superstorm indicating the conjugate actions of magnetospheric electric fields mapping along field lines between hemispheres. The closely-similar magnitude of TEC in the two hemispheres suggests a similar source for the TEC enhancements at low and mid latitudes during that event.
2005). Both the latitude variation and the magnitude of the SED enhancement were closely similar along the conjugate tracks. Maximum TEC in the plume exceeded 200 TECu in both hemispheres at this time. Greatly enhanced TEC (>230 TECu) in the EIA was observed in both hemispheres, the separation between the N and S EIA crests was ∼40◦
latitude, and the enhancements of TEC along the equator-ward portions of the EAI peaks also were closely similar in both hemispheres. The separation between the SED peak lat-itude and the EIA crest was ∼23◦over the S Pacific. SZA
was <70◦along both the S Hemisphere TOPEX track and
its magnetic conjugate in the north. The poleward edge of the SED plume in both hemispheres was marked by a steep gradient region across which TEC decreased by ∼200 TECu. 2.4.2 Non-conjugacy of the bulge
Not every inter-hemispheric comparison of SED characteris-tics is as good as those presented in Figs. 1 and 2. We find the position of the steep gradient region at the poleward edge of the SED to be closely aligned in the conjugate hemispheres, whereas the enhancement at the base of the plume, which provides a plasma source for the erosion events (e.g. Foster et al., 2005a), often is significantly non-conjugate. We illustrate these characteristics with observations on 29 October 2003 (20:15 UT) presented in Fig. 3. At that time the North Amer-ican GPS network observed a broad plume of TEC surging poleward into the polar cap across the central U.S. (cf. Foster and Rideout, 2005). Red contours mark the 50 TECu
iso-contour in the north, and these have been mapped to their magnetic conjugate locations in the south. The Jason or-bital track crosses that contour near 60◦S latitude. Direct
Jason TEC observations reveal a narrow SED feature (maxi-mum TEC ∼150 TECu) whose poleward boundary is closely aligned with that seen in the north. Equatorward of this SED plume, TEC drops to ∼90 TECu in the south, but is consider-ably enhanced (>175 TECu) over a wide spatial extent in the north. Coker et al. (unpublished manuscript, 2004) compared the Southern Hemisphere TOPEX passes with global maps of GPS TEC displayed in magnetic latitude coordinates to address the magnetic conjugacy of the 29–30 October 2003 events. They noted the pronounced north/south asymmetry in the magnitude of the mid- latitude TEC enhancement on 29 October. Foster et al. (2005a) and Foster and Coster (2007) have discussed this enhanced bulge of TEC which develops around dusk over the Caribbean and the southeastern USA during major storms. The observations of Fig. 3 (and of other cases, not shown) suggest that the magnitude and spatial ex-tent of the TEC bulge enhancement seen in those regions dur-ing large storms are not magnetically-conjugate characteris-tics.
2.4.3 Conjugacy of the polar tongue of ionization
During disturbed conditions, rapid sunward convection from the postnoon mid-latitude ionosphere carries high-density solar-produced F-region plasma through the dayside cusp and into the polar cap. Knudsen (1974) investigated the
1796 J. C. Foster and W. Rideout: Storm enhanced density: magnetic conjugacy effects −220 −200 −180 −160 −140 −120 −100 −80 −60 −40 −20 −80 −60 −40 −20 0 20 40 60 80 Longitude Oct 29, 2003 20:15 UT 1.1 1.2 1.3 1.4 1.5 1.6 1.7 1.8 1.9 0 50 100 150 200 250 −80 −60 −40 −20 0 20 40 60 80
Jason Ionospheric TEC
Geographic Latitude
TEC (TECu)
log TEC (TECu)
Fig. 3. Whereas the sharp poleward edge of SED, produced by the action of SAPS electric fields, is closely conjugate, the bulge of enhanced
TEC at the base of the plume is much more pronounced in the SE U.S. sector.
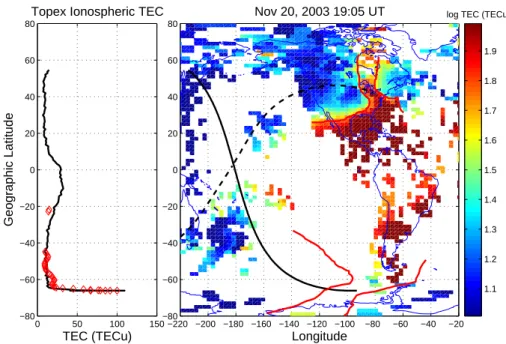
effects of rapid anti-sunward convection on the polar F layer as it is convected through the cusp, over the polar cap, and into nightside auroral latitudes. That study solidified the suggestion of Sato (1959) of the existence of a “tongue” of ionospheric plasma (TOI) extending from the dayside to the nightside ionosphere, driven by cross polar cap electric fields. In the Northern Hemisphere where there are sufficient ground-based TEC observations to provide event coverage to high latitudes, the SED plumes have been observed to ex-tend into the dayside cusp ionosphere and from there back across the polar cap, forming the polar tongue of ionization (e.g. Foster et al., 2004, 2005b). For the large disturbance of 20 November 2003, the cusp and near regions of the day-side polar cap expanded below 40◦latitude over North
Amer-ica, such that the conjugate footprint of the TOPEX orbit at
∼19:00 UT intersected the TOI. Figure 4 presents
observa-tions obtained during that event, in the format of Fig. 1. GPS TEC mapping revealed a broad TOI plume extending to high latitudes (see Foster et al., 2005b, for a description of this event). Red lines marking the boundaries of the plume are projected along the magnetic field to the Southern Hemi-sphere. The direct TOPEX trajectory intersected the con-jugate to the N-Hemisphere TOI near −65◦latitude, where
TEC in excess of 100 TECu was observed. Ground-based TEC observations along the conjugate orbital track showed a nearly identical boundary position. In the north, TEC within the TOI exceeded 150 TECu.
As a second example, Fig. 5 presents paired north and south GPS TEC polar plots for the 30 October 2003 event shown in Fig. 2. In the north a strong TOI extended back across the polar cap to the nightside auroral region. (Noon
is at the top of the figures and geographic coordinates are used.) The 35 TECu iso-contour is marked in red. The con-figuration observed is very similar to that presented by Foster et al. (2005b), who demonstrated that the TOI closely fol-lowed convection streamlines across polar latitudes. In the Southern Hemisphere, GPS coverage is sparse. The red con-tours indicating the SED and TOI in the north are displayed in their magnetic conjugate locations on the south polar map. (IGRF magnetic mapping is not strictly accurate at high lat-itudes where the magnetic field is significantly non-dipolar. The study of Foster et al. (2007), which intercompared fea-tures of SED at ionospheric heights with outer-plasmasphere observations of erosion plumes observed with the IMAGE EUV instrument, employed field-line tracing using the Tsy-ganenko (2002) magnetic field model to compensate for the distortion the disturbed magnetic field at high altitudes. The comparisons made here are done at altitudes near the earth’s surface, where the IGRF field gives a good representation of magnetic conjugacy.) Enhanced TEC is seen over Antarctica in the region conjugate to the northern TOI, indicating that a southern TOI also was formed during the event. The path of the Topex satellite (cf. Fig. 2) is shown in blue. We conclude that conjugate SED plumes carrying cold plasma from lower latitudes enter the polar regions near noon forming conjugate tongues of ionization over the polar caps.
3 Discussion
The conjugacy effects reported above are not surprising since the large and meso-scale electric fields which transport the
−220 −200 −180 −160 −140 −120 −100 −80 −60 −40 −20 −80 −60 −40 −20 0 20 40 60 80 Longitude Nov 20, 2003 19:05 UT 1.1 1.2 1.3 1.4 1.5 1.6 1.7 1.8 1.9 0 50 100 150 −80 −60 −40 −20 0 20 40 60 80
Topex Ionospheric TEC
Geographic Latitude
TEC (TECu)
log TEC (TECu)
Fig. 4. SED streaming into the polar caps created magnetically-conjugate TOI during the 30 November 2003 event. Topex intersected the
southern TOI in the region magnetically conjugate to the GPS TEC SED/TOI observed in the north.
−50 0 50 −80 −60 −40 −20 0 20 40 60 80
Oct 30, 2003 22:00 UT North Polar TOI
0.8 0.9 1 1.1 1.2 1.3 1.4 1.5 1.6 1.7 1.8 −50 0 50 −80 −60 −40 −20 0 20 40 60 80
Oct 30, 2003 22:00 UT South Polar TOI
log TEC (TECu) log TEC (TECu)
0.8 0.9 1 1.1 1.2 1.3 1.4 1.5 1.6 1.7 1.8
Fig. 5. Left: The data of Fig. 2 are displayed in polar coordinates with noon at the top. The strong SED plume extended across the north
polar cap forming a pronounced polar tongue of ionization (TOI). The 35 TECu iso-contour (red) outlines the SED and TOI. This contour has been mapped to its conjugate locations in the Southern Hemisphere (right) where sparse GPS TEC data from Antarctica indicate the formation of a conjugate TOI. The orbital track of the Jason satellite (data shown in Fig. 2) is indicated by the blue trace. Latitude circles are shown at 15 deg intervals.
SED plumes are expected to be magnetically conjugate. The cold plasma of the low or mid-latitude ionosphere, and the plasmaspheric material at greater heights along the magnetic field lines, follow the E×B streamlines of the total convec-tion electric field. At sub-auroral latitudes, in the regions of low overall ionospheric conductivity, convection and cold-plasma erosion are dominated by the SAPS electric field. As the SED plasma is carried towards the cusp, its location maps out the equatorward extent of the SAPS convection channel (Foster et al., 2007), which merges into the equatorward re-gion of the dusk 2-cell convection at local times near noon (Foster and Vo, 2002). We have shown that the SED plumes exhibit close magnetic conjugacy, confirming that SED is a convection electric field dominated effect.
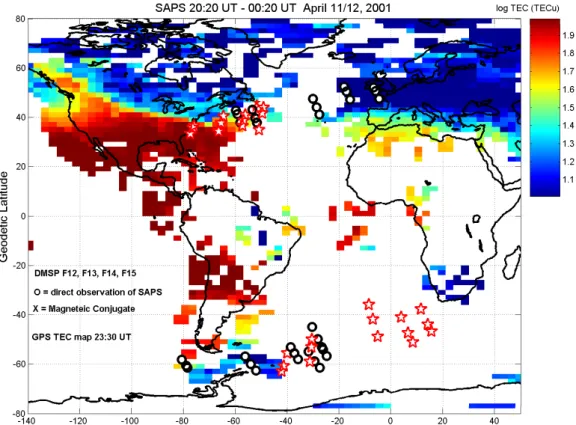
In Fig. 6 we demonstrate the magnetic conjugacy of the SAPS electric field. As a background, a GPS TEC map at 23:30 UT on 11 April 2001 is shown. This reveals a deep TEC trough spanning the evening sector from Europe (local midnight over England) to North America. A SED plume is drawn poleward along the west coast of Canada. (Local time is ∼16:30 at the base of the plume over the western USA). We have determined the positions of the center and the pole-ward and equatorpole-ward extent of the SAPS electric field in each hemisphere from every DMSP pass in the 4-h interval between 20:20 and 00:20 UT. (See Foster and Vo, 2002, for a discussion of SAPS identification and characteristics.) These locations are displayed as black circles overlying the TEC map. The magnetic conjugates of each of these points are
1798 J. C. Foster and W. Rideout: Storm enhanced density: magnetic conjugacy effects
Fig. 6. Direct observations of the position of the SAPS electric field made by the DMSP satellites in both hemispheres over a 4-h interval
are denoted by open circles. The magnetic conjugate locations of those points are indicated by red stars. The SAPS electric field is seen to occur in magnetically-conjugate channels.
plotted in the opposite hemisphere as red stars. The direct and conjugate SAPS observations overlap each other in each hemisphere. A broad, long-lasting, SAPS channel forms in conjugate regions across the dusk and evening sector. Near dusk, SAPS overlaps the mid-latitude enhanced TEC, draw-ing the SED plume sunward (Foster et al., 2007).
SED plumes trace conjugate E×B streamlines. The TEC carried in the plume depends on the characteristics of the source plasma feeding the plume, as well as production and losses as the ionospheric plasma is transported sun-ward. In the Northern Hemisphere North American sector, a significantly-enhanced TEC source population has been noted during large disturbances. In some cases (e.g. the 15 July 2000 event) the temporal growth of this enhancement is very similar in conjugate regions. Long-lasting enhance-ments are found in both hemispheres (Foster and Coster, 2007), but in some cases the spatial extent of the “bulge re-gion” TEC enhancement is significantly different in the two hemispheres. How such cases differ and the exact mecha-nisms involved are topics for continued investigation.
The processes leading to SED plumes produce conjugate cusp-region and polar cap plasma enhancements which may contribute to the outflow of ionospheric species into the mag-netosphere via processes acting on the underlying ionosphere in those regions.
4 Summary
We use combined satellite and ground-based observations to investigate the degree of magnetic conjugacy associated with specific features of the stormtime ionospheric perturbation. Passes of the Jason and TOPEX satellites over the mid Pacific sample regions magnetically conjugate to continental North America, where GPS TEC observations produce 2-D maps of ionospheric disturbances. We reach several conclusions based on such comparisons:
1. The SED plume occurs in magnetically-conjugate re-gions in both hemispheres.
2. The position of the sharp poleward edge of the SED plume is closely conjugate.
3. The SAPS electric field is observed in magnetically conjugate regions extending across the evening-sector (SAPS channel).
4. The strong TEC enhancement at the base of the SED plume in the north American sector is more extensive than in its magnetic conjugate region.
5. The entry of the SED plume into the polar cap near noon, forming the polar TOI, is seen in both hemi-spheres in magnetically-conjugate regions.
6. During major storms, the magnitude of the enhanced TEC in the SED plume can be similar in the conjugate hemispheres.
Acknowledgements. Work at the Millstone Hill Observatory has
been supported by NASA Grant NNX06AB86G to the Mas-sachusetts Institute of Technology. We thank members of the Atmospheric Sciences Group at the MIT Haystack Observatory for helpful comments and discussions.
Topical Editor M. Pinnock thanks D. L. Gallagher and another anonymous referee for their help in evaluating this paper.
References
Buonsanto, M. J.: Ionospheric storms – A review, Space Sci. Rev., 88, 563–601, 1999.
Carpenter, D. L. and Lemaire, J.: The plasmasphere boundary layer, Ann. Geophys., 22, 4291–4298, 2004,
http://www.ann-geophys.net/22/4291/2004/.
Coster, A. J., Colerico, M. J., Foster, J. C., Rideout, W., and Rich, F. J.: Longitude sector comparisons of storm enhanced density, Geophys. Res. Lett., in press, 2007.
Coster, A. J., Foster, J., and Erickson, P.: Monitoring the ionosphere with GPS: Space Weather, GPS World, 14(5), 42–49, 2003. Evans, J. V.: The causes of storm-time increases of the F-layer at
mid-latitudes, J. Atmos. Terr. Phys., 35, 593–616, 1973. Foster, J. C.: Storm-time plasma transport at middle and high
lati-tudes, J. Geophys. Res., 98, 1675–1689, 1993.
Foster, J. C. and Burke, W. J.: SAPS: A New Categorization for Sub-auroral Electric Fields, EOS, 83, 393–394, 2002.
Foster, J. C. and Coster, A. J.: Localized stormtime enhancement of TEC at Low Latitudes in the american sector, J. Atmos. Space Terr. Phys., 69, 1241–1252, doi:10.1016j.jastp.2006.09.012, 2007.
Foster, J. C. and Rideout, W.: Midlatitude TEC enhancements during the October 2003 superstorm, Geophys. Res. Lett., 32, L12S04, doi:10.1029/2004GL021719, 2005.
Foster, J. C. and Vo, H. B.: Average Characteristics and Activity Dependence of the Subauroral Polarization Stream, J. Geophys. Res., 107(A12), 1475, doi:10.1029/2002JA009409, 2002. Foster, J. C., Coster, A. J., Erickson, P. J., Goldstein, J., and Rich, F.
J.: Ionospheric signatures of plasmaspheric tails, Geophys. Res. Lett., 29(13), 1623, doi:10.1029/2002GL015067, 2002. Foster, J. C., Coster, A. J., Erickson, P. J., Rich, F. J., and Sandel,
B. R.: Stormtime observations of the flux of plasmaspheric ions to the dayside cusp/magnetopause, Geophys. Res. Lett., 31, L08809, doi:10.1029/2004GL020082, 2004.
Foster, J. C., Coster, A. J., Erickson, P. J., Rideout, W., Rich, F. J., Immel, T. J., and Sandel, B. R.: Redistribution of the stormtime ionosphere and the formation of the plasmaspheric bulge, in: In-ner Magnetosphere Interactions: New Perspectives from Imag-ing, 2004 Yosemite Conf. Proceedings, AGU Press, Washington D.C., 2005a.
Foster, J. C., Coster, A. J., Erickson, P. J., Holt, J. M., Lind, F. D., Rideout, W., McCready, M., van Eyken, A., Greenwald, R. A., Rich, F. J., Foster, J. C., et al.: Multiradar observations of the polar tongue of ionization, J. Geophys. Res., 110, A09S31, doi:10.1029/2004JA010928, 2005b.
Foster, J. C., Rideout, W., Sandel, B., Forrester, W. T., and Rich, F. J.: On the relationship of SAPS to storm enhanced density, J. Atmos. Terr. Phys., 69, 303–313, 2007.
Goldstein, J., Sandel, B. R., Forrester, W. T., Thomsen, M. F., and Hairston, M. R.: Global plasmasphere evo-lution 22–23 April 2001, J. Geophys. Res. 110, A12218, doi:10.1029/2005JA011282, 2005.
Immel, T. J., Foster, J. C., Coster, A. J., Frey, H. U., and Mende, S. B.: Global stormtime plasma redistribution imaged from the ground and space, Geophys. Res. Lett., 32, L03808, doi:10.1029/2004GL021597, 2005.
Jee, G., Schunk, R. W., and Scherliess, L.: Analysis of TEC data from the TOPEX/Poseidon mission, J. Geophys. Res., 109, A01301, doi:10.1029/2003JA010058, 2004.
Kelley, M. C., Vlassov, M., Foster, J. C., and Coster, A. J.: A quantitative explanation for the phenomenon known as plasmas-pheric tails or storm-enhanced density, Geophys. Res. Lett., 31, L19809, doi:10.1029/2004GL020875, 2004.
Knudsen, W. C.: Magnetospheric convection and the high-latitude F2 ionosphere, J. Geophys. Res., 79, 1046–1055, 1974. Mendillo, M.: Storms in the ionosphere: patterns and
pro-cesses for total electron content, Rev. Geophys., 44, RG4001, doi:10.1029/2005RG000193, 2006.
Moen, J., Carlson, H. C., Oksavik, K., Nielsen, C. P., Pryse, S. E., Middleton, H. R., McCrea, I. W., and Gallop, P.: EISCAT ob-servations of plasma patches at sub-auroral cusp latitudes, Ann. Geophys., 24, 2363–2374, 2006,
http://www.ann-geophys.net/24/2363/2006/.
Ping, J., Matsumoto, K., Heki, K., Saito, A., Callahan, P., Potts, L., and Shym, C. K.: Validation of Jason-1 Nadir Ionosphere TEC Using GEONET, J. Mar. Geodesy, 27(3–4), 741–752, doi:10.1080/01490410490889049, 2004.
Rideout, W. and Coster, A.: Automated GPS processing for global total electron content data, GPS Solut., 10, 219–228, doi:10.1007/s10291-006-0029-5, 2006.
Sato, T.: Morphology of Ionospheric F2 disturbances in the polar regions, Rep. Ionos. Res. Space Res. Jap., 131, 91–101, 1959. Schunk, R. W., Banks, P. M., and Raitt, W. J.: Effects of
elec-tric fields and other processes upon the nighttime high-latitude F layer, J. Geophys. Res., 81, 3271–3282, 1976.
Tsurutani, B. T., Mannucci A., Iijima B., Abdu, M. A., Sobral, J. H. A., Gonzalez, W., Guarnieri, F., Tsuda, T., Saito, A., Yumoto, K., Fejer, B., Fuller-Rowell, T. J., Kozyra, J., Foster, J. C., Coster, A., and Vasyliunas, V. M.: Global dayside ionospheric uplift and en-hancement associated with interplanetary electric fields, J. Geo-phys. Res., 109, A08302, doi:10.1029/2003JA010342, 2004. Tsyganenko, N. A.: A Model of the Near Magnetosphere with a
Dawn-Dusk Asymmetry: 1. Mathematical Structure, J. Geophys. Res., 107(A8), 1176, doi:10.1029/2001JA00219, 2002. Vladimer, J. A., Lee, M. C., Doherty, P. H., Decker, D. T., and
An-derson, D. N.: Comparisons of TOPEX and Global Position Sys-tem total electron content measurements at equatorial anomaly latitudes, Radio Sci., 32(6), 2209–2220, 1997.
Vlasov, M., Kelley, M. C., and Kil, H.: Analysis of satellite and ground-based observations of F-region behavior during the great magnetic storm of July 15, 2000, J. Atmos. Solar-Terr. Phys., 65, 1223–1234, 2003.
Vo, H. B. and Foster, J. C.: A quantitative study of ionospheric density gradients at mid-latitudes, J. Geophys. Res., 106, 21 555– 21 563, 2001.