3rd International Conference on Bio-Based Building Materials June 26th - 28th 2019
Belfast, UK
ID_ SSS143
DEVELOPMENT OF A METHOD FOR ASSESSING RESISTANCE TO
MOLD GROWTH: APPLICATION TO BIO-BASED COMPOSITES
M. Viel1,2*, F. Collet2, Y. Lecieux1, M. François1, V. Colson2 3, C. Lanos2, A. Hussain4 and M.Lawrence4
1 Université de Nantes, Institut de Recherche en Génie Civil et Mécanique, BP 92208, Nantes,
France
2 Université de Rennes, Laboratoire Génie Civil et Génie Mécanique, BP 90422, Rennes, France 3 CAVAC Biomatériaux, Le Fief Chapitre, Sainte Gemme la Plaine, France
4 BRE Centre for Innovative Construction Materials, Department of Architecture and Civil
Engineering, University of Bath, BA2 7AY, United Kingdom *Corresponding author: marie.viel@univ-nantes.fr
Abstract
The production of insulating materials for buildings obtained from the valorization of agro-resources is a promising way both in terms of ecology and hygrothermal performances of these composites. However, the lack of information on their resistance to mold development limits their use. The mold development is indeed likely to cause health problems and to induce damage. There is therefore a need to classify the materials according to their resistance to mold growth and disintegration in order to use them appropriately. The purpose of this paper is to propose a test method that qualifies bio-based composites with respect to their performance. An accelerated aging test was carried out on 5 composites made with two different agro-resources (hemp and rape) with different binders. It consists in exposing the specimens to a temperature of 30°C and a relative humidity of 90 %RH for three months. During the test, the specimens are regularly photographed and weighed. The evolution of two indicators is thus measured over time: the sample mass and the percentage of its external surface contaminated by fungi. At the end of the test, a microscopic view makes it possible to identify the species of the molds which have contaminated the composite.
Keywords:
Construction materials, Decay resistance, Mold growth, Hemp shiv, Rape straw, DIC (Digital Image Correlation)
1 INTRODUCTION
The agricultural waste valuation is one of the current The development of new insulating building materials from agro-resources of local agriculture (hemp shiv, flax shiv, wheat straw, etc.) is currently booming. The main quality of these materials is their hygrothermal performance when compared with traditional building materials. However, before they can be made available in the market, others characteristics need to be evaluated such as mechanical performance and durability. This paper investigates the decay resistance of the newly developed composites. Bio-based materials are assumed to be highly sensitive to the mold growth due to their chemical composition: cellulose, hemicellulose, lignin and proteins. The molds are produced by wide variety of microorganisms, mainly microscopic fungi and yeasts. These play an important role in the decomposition of plant materials. These microorganisms grow and reproduce very quickly, spreading spores and mycelium.
These microorganisms may already be present inside building materials (walls, partitions, ceilings) or may be
directly introduced into homes through ventilation. Their growth depends on various factors, in particular: flood, water leaks (roof or pipework), poorly-ventilated spaces (in kitchen, in bathroom)and building seals [Nevalainen 2005; Nielsen 2004]. In all cases, the fungi will grow when materials contain free water. For wood, the water content at the fiber saturation point ranges from 20 to 30 %. The appearance of fungi induces a mass loss of between 5 and 10 % and the mechanical properties decrease between 20 and 80 % depending on the type of material. The molds collect water, nutritional substances and minerals needed for their synthesis from the surrounding environment and the materials [Nielsen 2004].
Although fungi are present in the atmosphere, higher concentrations may result in adverse health effects. Indeed, many fungal components are likely to cause adverse effects on the health of exposed individuals. Mold prevention and remediation in new and existing housing is thus not solely an aesthetic issue, but also one of public health and hygiene [Nevalainen 2005].
There is therefore a need to classify materials depending on their decay resistance in order to use them
appropriately. To qualify the durability of materials, different methods and standards exist such as: AWPA Standard E24-06 or BSI EN ISO 846 – 1997, assessing the resistance of specimen surface to mold growth after fungi inoculation. For each of these methods, the intensity of specimen’s mold growth is visually rated using a scale during the test period. Thus, this is a somewhat subjective type of assessment.
The aim of this paper is to develop a method to qualify bio-based composites with respect to their resistance to mold development. The composites were exposed over a three months period to unfavorable conditions: 30°C and 90% RH. These conditions are expected to initiate and accelerate mold growth on the surface of bio-based panels. The composite specimens were made with two different agro-resources (hemp and rape) mixed with different binders. They are tested without prior sterilization or inoculation with mold. Specimens are regularly weighed and photographed during the test. The evolution of two indicators is thus measured over time: the sample mass and the percentage of its surface contaminated by fungi. Two ways are used to rate the contaminated area: visual inspection as stated previously and digital image correlation (DIC). The latter method is developed in this work for quick quantification of the contaminated surface of the specimens by molds in an objective manner unlike the visual evaluation. At the end of the test, microscopic views are analyzed in order to identify the mold species which have contaminated the composite.
2 MATERIALS AND METHODS 2.1 Bio-aggregates
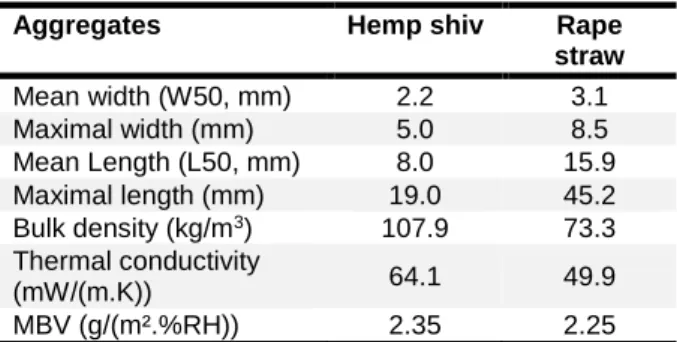
Two types of aggregates are considered in this study: hemp shiv and rape straw. The main characteristics of these aggregates are reported in Table 15. The particle size distribution, bulk density and thermal conductivity were obtained using protocols set by RILEM TC 236-BBM [Amziane 2017]. The moisture buffer value (MBV) is measured for bulk materials according to a method based on the NORDTEST protocol [Rode 2005].
The hemp shiv is a commercial product (Biofibat – CAVAC, France) commonly used to produce hemp concrete. The mean width of particles (W50) is 2.2 mm and the mean length (L50) is 8.0 mm. The maximal width is 5.0 mm and the maximal length is 19.0 mm. The thermal conductivity is 64.1 mW/(m.K) for bulk density around of 110 kg/m3. The MBV is 2.35 g/(m².%RH).
According the classification of the Nordtest project, bulk hemp shiv appears as an excellent hydric regulator (MBV higher than 2 g/(m².%RH)).
The rape straw (supplied by CAVAC, France) is the residual portion of the threshing of rape commonly used for animal bedding, mulching or animal feeding. The mean width of particles is 3.1 mm and the mean length is 15.9 mm. The maximal width is 8.5 mm and the maximal length is 45.2 mm. The thermal conductivity is 49.9 mW/(m.K) for bulk density around of 75 kg/m3. The MBV
is 2.25 g/(m².%RH). According the classification of the Nordtest project, it is an excellent hygric regulator (MBV higher than 2 g/(m².%RH)) [Rode 2005].
2.2 Composite formulations
The composite formulations are developed within ISOBIO project. During this project, several lines of research are studied with the aim of producing, from these
bio-aggregates and a green binder, a rigid insulation panel. The main lines of research are as follows:
Use the adhesive properties of aggregates after treatment,
Use crosslink binders to improve the mechanical properties and water repellence of composites, Use a sol-gel treatment to improve the water
repellence of composites.
Table 15 : Main characteristics of hemp shiv and rape straw
Aggregates Hemp shiv Rape
straw Mean width (W50, mm) 2.2 3.1 Maximal width (mm) 5.0 8.5 Mean Length (L50, mm) 8.0 15.9 Maximal length (mm) 19.0 45.2 Bulk density (kg/m3) 107.9 73.3 Thermal conductivity (mW/(m.K)) 64.1 49.9 MBV (g/(m².%RH)) 2.35 2.25
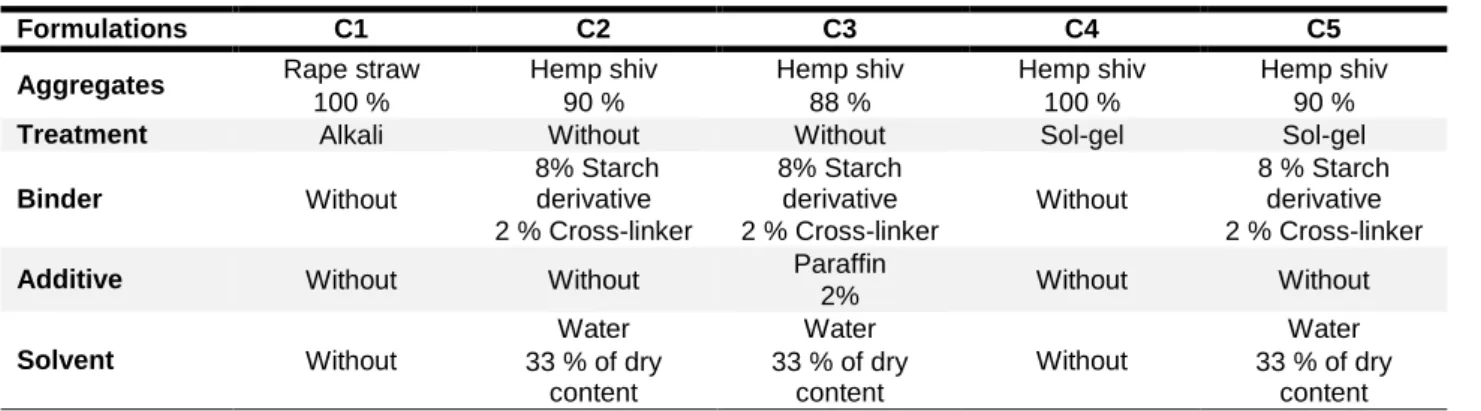
Numerous formulations were investigated and the five best ones are selected to produce specimens for this study. They are made of rape straw or hemp shiv, treated or not, mixed with or without binders and with or without additives. The formulations are summarized in Table 2. C1 composites are made of rape straw after exposure to alkali treatment. Preliminary work showed that after alkaline and thermal treatments on rape straw, the produced composites have good cohesion, which is induced by the polymerization of soluble components. This formulation has an advantage to only use treated rape straw and thus 100 % bio-based insulation panels can be produced in the same line as the hemp-straw composites. C2 composites are made of hemp shiv mixed with a binder formulated using a starch derivative and a cross-linker. The starch and its derivatives have good adhesive properties on the lignocellulosic substrates. However an important issue is the low energy chemical bonds (Van der Waals and hydrogen bonds), which ensure starch cohesion. Moreover, they can be easily hydrolyzed by water, resulting in poor water resistance of the composite. Therefore a cross-linker is added to create, after a thermal activation, covalent bonds between the starch macromolecules chains and thus, to form a three-dimensional network in order to improve the mechanical strength and the water resistance of the composite. C3 composites are made using the same formulation as C2 composites, but 2 % of paraffin is added, to improve its water repellence.
C4 composites are made of hemp shiv coated with a sol-gel treatment to improve their water repellence. For the preparation of the sol-gel, 1 M of TEOS was added to a mixture of 4 M distilled water, 4 M of absolute ethanol and 0.005 M of nitric acid. 0.015 M of HDTMS was added to the above mixture as the hydrophobic agent. The sol was vigorously stirred at 40 °C and atmospheric pressure for nearly 2 hours. The sols were allowed to age for 96 hours in closed container at room temperature before to be mixed with the hemp shiv in order to coat them. In the case of C4 composites, this sol-gel coating also serves as a binder. C5 composites are made of the same coated aggregates as C4 composites and the same binder as C2 composites. Compared to C4 composites, the addition of the binder improves the mechanical properties.
Table 16 : Specimens composition
Formulations C1 C2 C3 C4 C5
Aggregates Rape straw Hemp shiv Hemp shiv Hemp shiv Hemp shiv
100 % 90 % 88 % 100 % 90 %
Treatment Alkali Without Without Sol-gel Sol-gel
Binder Without 8% Starch derivative 2 % Cross-linker 8% Starch derivative 2 % Cross-linker Without 8 % Starch derivative 2 % Cross-linker
Additive Without Without Paraffin
2% Without Without Solvent Without Water Water Without Water 33 % of dry content 33 % of dry content 33 % of dry content
2.3 Composite production process
For preparation of C1, C2, C3 and C5 composites, the bio-aggregates (treated, coated or not) are moistened with the solvent and/or the binder, if any. Three specimens are produced from the same mixture. This batch is divided into three equal parts (A, B and C) and each part is introduced in one of the three cells of a mold. Each part is compacted 5 times at 0.25 MPa in the mold and then placed in an oven at 190 °C for 2 hours. The three specimens of dimensions 100 x 100 x 50 mm3 are
demolded once they cool down to room temperature (Figure 103).
Figure 103 : Flow-chart of composites production (except C4 formulation)
For C4 formulation, mixing of the constituent materials, hemp shiv (75 vol%) and sol (25 vol%), were carried out manually to achieve a uniform mixture. The mass of the materials was pre-calculated to target a final density of 175 kg/m3 for the composites. Hemp shiv were mixed
with the sol and then placed into a phenolic ply mold, tamped down and left for overnight in the oven at 80 °C. The specimens of dimensions 100 x 100 x 50 mm3 were
removed from the molds and transferred to a conditioning room at 19 °C and 50% RH.
Figure 104 shows the produced composites and Table 17 gives their apparent density. The composites based on hemp shiv have very close densities ranging from 173 to 203 kg/m3. The composite based on rape straw (C1)
has the highest density (288 kg/m3) due to much higher
density of the aggregate after alkali-treatment which reduces intra and inter-particle porosity. The C1 composites have the highest pH (10) due to alkali treatment. The composites made with starch derivative based binder and crosslinker (C2, C3 and C5), have an acid pH of 6. The composites which are glued with sol-gel (C4), have the lowest pH (4).
Figure 104 : Developed composites Table 17 : Apparent density and pH surface of
composites N° C1 C2 C3 C4 C5 Density (kg/m3) 287.66 ± 9.49 181.02 ± 2.82 184.21 ± 1.51 173.92 ± 6.11 203.10 ± 4.20 CoV 3.30% 1.56% 0.82% 3.51% 2.07% pH 10 6 6 4 6
2.4 Methods for characterization
Biological aging
The accelerated aging test evaluates the fungal resistance of the composites at given temperature and humidity. After stabilization at 23°C and 50% RH, the biological aging tests are performed in a climate chamber (Vötsch VC0034) under controlled temperature and relative humidity at 30°C and 90% RH for three months. The specimens are tested without prior sterilization or inoculation with mold to closely reproduce a real exposure situation. For each formulation, three specimens are tested. Each specimen (3 specimens per formulation) is placed in a plastic box to prevent contamination between specimens. In order to facilitate image treatment, the specimen is prevented from moving in the box, by making use of the aluminum adhesive block. Furthermore, the experimental bench allows to take pictures of the top surface of the specimens in a consistent manner. Every week day, the specimens are weighed and visually inspected. Pictures are captured with a camera (Coolpix 8700, 8 Megapixels, Nikon). For the analysis, mass variation from the steady state point is related to the exchange surface area (including horizontal top and lateral surfaces of the specimen). The mass loss of each formulation is expressed as the mass ratio between the maximal mass and this of the given time, using Equation (1).
𝑴𝑳 = 𝒎𝒎𝒂𝒙−𝒎
𝒎𝒎𝒂𝒙 𝒙 𝟏𝟎𝟎
Where ML is the mass loss (%); mmax is the maximal
mass of composite (g) and m is the mass of composite at the given time (g).
On the final day of the test, the samples are visually evaluated for mold growth according the rating scale of BSI EN ISO 846 – 1997, which is shown in Table 4. This method is subjective. Thus, the final rating is the average value of the given rating by each author in this publication, making a total of 8 people.
Table 18: Assessment of growth following the BSI EN ISO 846 – 1997
Intensity of
growth Evaluation
0 No growth apparent under the microscope.
1
No growth visible to the naked eye, but clearly visible under the microscope.
2
Growth visible to the naked eye, covering up to 25 % of the test surface.
3
Growth visible to the naked eye, covering up to 50 % of the test surface.
4 Considerable growth, covering more than 50 % of the test surface.
5 Heavy growth, covering more than 75 % of the test surface.
The chosen method has an advantage of being non-intrusive unlike other methods found in the literature:
Use of adhesive to remove fungal spores from the substrate and then scanning of mold imprint [Clausen 2013];
Scanning two sides of the specimen [Garzón-Barrero 2016].
It should be noted that during the entire period of the test the biotope remains undisturbed.
Image analysis
In this study, the chosen contamination indicator is the relative photographed surface contaminated by mold with reference to the total surface. To evaluate the mold growth between two dates t0 and t, two photographs of
the same specimen have been taken. In this study, a very simple experimental device has been chosen to avoid use of sophisticated equipment. However for image analysis, it is necessary to use or to develop specific IT-tools.
The image analysis is performed in two steps:
Firstly, the displacement field between images recorded at t0 and 𝑡 is computed. This displacement may be due
to operator handling or caused by a dilatation of the composite due to swelling induced by moisture change. This step is achieved, thanks to Digital Image Correlation (DIC) analysis, using the code DIGIMCO developed in MATLAB. Similar tools, whether free or commercial software exist and have been used for several years to perform displacement field measurement, or to evaluate mechanical properties.
Secondly, the location of mold is revealed thanks to the error map of correlation between images recorded at time 𝑡0 and 𝑡. It represents the discrepancy between the
two images once correlated in space. A gray level difference reveals the presence of molds.
Image f and the image g designate the images of an object recorded in the initial state (at time t0) and in the
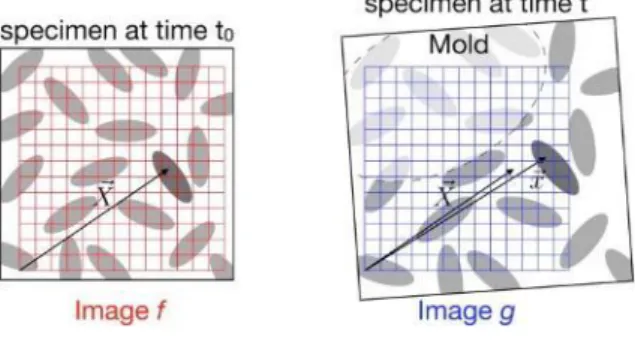
final state (at time t) respectively. The discrete functions 𝑓(𝑿) and 𝑔(𝑿) denote the gray levels associated with pixel of the image f and g respectively, located at position X (the coordinates are in pixels). The location of a given texture point is referred to be as X in image f and x in image g (see Figure 105). Possible transformations between two images are schematized in Figure 105 (i.e. dilatation, translation and rotation). The first step of the analysis is to compute the displacement field u(X) which gives the best fit between images f and g. The texture of the two images is quite similar and is used to determine this fit.
Figure 105: Digital image correlation between initial image f (time 𝑡0) and current image g (time 𝑡)
The displacement u is defined by:
x = X + u (3) Supposing a homogeneous deformation, the mapping of the transformation is a parameterized field as:
x = F. (X + T) (4) where T is a translation vector described by the parameters λ1 and λ2.
λ1= T1 (5)
λ2= T2 (6)
and F is the deformation gradient tensor described by the parameters (λ3, λ4, λ5, λ6) : λ3= n (F11− 1) (7) λ4= n (F12) (8) λ5= n (F21) (9) λ6= n (F22− 1) (10)
where n is a weighting factor. The DIC method [Besnard 2006] is based on an assumption of optical flow conservation between images f and g whose texture does not significantly differ thus f(X) = g(x) = g(X + u) (with a possible error). The experimental conditions are compatible with these assumptions since the brightness of the images and the color of the composites do not significantly evolve during the test. To find the displacement u or the parameters λi, the sum of squared
differences φ of the gray levels have to be minimized over the zone of interest -Zi- which corresponds in this
study to the whole photographed face of the composite is:
φ(λ1, λ2, λ3, λ4, λ5, λ6) = ∑X ∈ Zi(g(x) − f(X))
2
(11) However the computation of the displacement field u is not the objective of this study. It is only necessary to
pixel, at exactly the same location. Here, the presence of mold changes the gray level. The zones affected by mold are supposed to be large with respect to the texture size of the image of the composite. Then, assuming a uniform variation of the gray level b, (due to the presence of mold) the equation 10 becomes:
φ(λ1, λ2, λ3, λ4, λ5, λ6) = ∑X ∈ Zi(g(x) + b − f(X))
2
(12) The result of the minimization (i.e. the computation of parameters λi or the displacement field u) is not modified
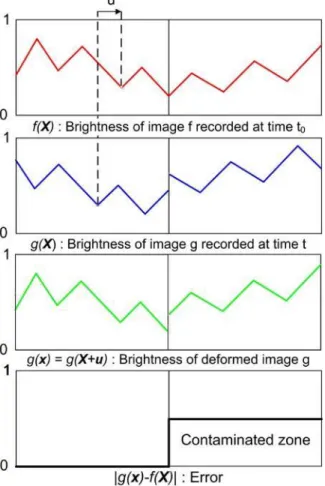
by the presence of b since it does not modify the gradient of φ [Besnard 2006]. Figure 106 illustrates the method. The function f(X) represents a 1D example of gray level in the initial image f (without mold). The function g(X) represents the final grey level of image g in which molds have changed the gray level of some domains. A rigid body motion is visible. Once computed the best correlation (Equation 11) the maximum and minimum shall match between f(X) and g(x). Then, the difference g(x) − f(X) exhibits the location of the colonization.
Figure 106: Relative brightness, of image g and f: an error involves the detection of a new object Pixels which value is below a threshold value are considered to be contaminated. After the thresholding, a morphological operation of opening and closing of the black-and-white image is then performed to filter the isolated and reduce apparent measurement noise. Finally, the number of white pixels and black pixels in the image are counted to get the percentage of surface contaminated by fungi.
Microscope visualizations
After the three-month test period, microscope visualizations are performed in this study to identify the
type of mold which are developed on the contaminated composite surface. The infected shiv are collected with a pair of tweezers and are observed under a microscope LCD (5 Megapixels, Bresser).
3 RESULTS AND DISCUSSIONS 3.1 Macroscopic visualizations
The visual inspection performed during this test shows that, C1 composite does not show any fungal development. The other composites show gradual growth of molds, more or less, quickly. C2 and C3 composites do not have their surface strongly affected unlike the C4 and C5 composites. C5 composite has the most affected surface. First fungi mainly appear between the shiv on C2, C3, C4 and C5 composites between the fourth and the seventh day. The multiple colors of molds (grey, white and yellow) would suggest at least two types of fungi have contaminated the composite surfaces. Figure 107 gives the average ratings of the visual evaluation given by the authors with the rating scale of BSI EN ISO 846 – 1997 at the end of test. C1 composite does not have visible fungi. C3 composite has less than 25 % of its surface contaminated. C2 and C4 composites have between 25 and 50 % of their surface contaminated, with C4 being probably the more contaminated of the two. Finally, C5 composite has more than 75 % of its surface contaminated.
Figure 107: Average rating of mold growth on specimens with the rating scale of BSI EN ISO 846 – 1997 (British Standards Institute, 1997) after 12 weeks
at 30°C and 90% RH 3.2 Mass loss
Figure 108 gives the mass variation at 30°C and 90% RH from the steady state point (23°C and 50% RH), related to the exchange surface area (including top and lateral surfaces of specimens). During the first week of exposure, all specimens show an increase in mass due to water vapor adsorption resulting in a water content of about 20 % in specimens. From the eighth day, C5 composite slightly decreases in mass. From the ninth day, C2, C3 and C4 composites slightly decrease in mass too. The mass loss is due to the fungi development. C5 composite has the highest mass loss and C3 composite has the lowest mass loss.
Figure 108: Variation of mass (at 30°C, 90% RH) from the steady state point at (23°C, 50% RH), related to the exchange surface area
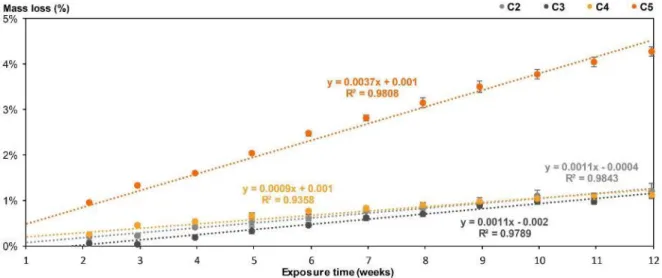
Figure 109: Mass loss for the tested composites during the ageing test
The two others composites have similar mass loss.in contrast, from the eighteenth day, C1 formulation slowly increases in mass before stabilizing and reaching water content of about 54 % at the end of the test.
Figure 109 gives the mass loss for C2, C3, C4 and C5 composites during the test. The kinetics of mass loss increases linearly for the four formulations after the first week. The first week certainly corresponds to the time needed to reach a water content threshold in the specimens in order to trigger mold growth. The correlation coefficients of the fitting curves are good as they are higher than 0.93. C5 composite has the highest mass loss. C3 composite has the lowest mass loss. This is probably due to the addition of paraffin which increases the water repellence. Moreover, the amount of adsorbed water by the C3 composite is lower than other composites. C2 and C4 composites have almost similar mass loss, thus the sol-gel coating does not have an impact on the kinetics of water vapor absorption. At the end of the test, these three formulations have a mass loss about 1.15 % whereas the C5 composite has the highest mass loss (4.28 %).
3.3 Image analysis
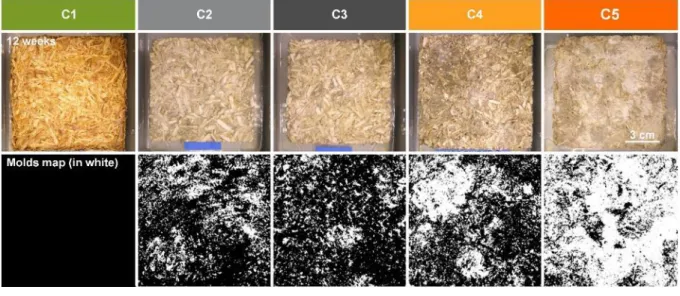
Figure 110 shows some pictures taken at the end of the test which are used to get the percentage of surface contaminated by the fungi. The image analysis leads to the estimation of the surface ratio contaminated by the fungal growth during the test period at 30 °C and 90% RH (Figure 111). The different mold growth rates between formulations are observed. Overall, C5 specimens have greater fungal growth with a higher standard deviation between the three specimens. C3 specimens have the slowest rate of growth over the 12 week test period. For all specimens, there is a substantial increase in growth during the second week which corresponds to the exponential phase of the fungal growth. During this period, the nutriments are in excess. Thus, the first week corresponds to the time required by the growth conditions to become favorable. The water content of specimens is around 10 % at the beginning of the test. 1 week is required to double this value. This phase is called the lag phase. During the third week, the intensity of growth decreases. It corresponds to the slowdown phase. This is due to a depletion of the culture medium (composites) and an accumulation of waste. This phase goes on two weeks in the case of C5
contaminated surface reaches a plateau until the end of the test. This means that the growth becomes zero and therefore the molds that grow multiply and replace those who die. This corresponds to the stationary maximum phase. At the end of test, the mean contaminated surface is 21.87 % for C3 specimens, 28.36 % for C2 specimens, 34.69 % for C4 specimens and 77.50 % for C5 specimens. Growth kinetics observed here are consistent with what is described in the biology literature [Leveau 2001]. These results suggest that the image
analysis method provides consistent and exploitable results for this study. Table 19 compares the results obtained with the visual evaluation and the image analysis of the contaminated surface of specimens at the end of the test. The average ratings from visual evaluation and from image analysis are close. However, the visual evaluation shows high discrepancy (up to 0.83 %) due to subjective effect. The image analysis leads to representative values as it is not subject to subjective effect. It seems to be more accurate.
Figure 110 : Pictures before and after DIC treatment at the end of the test
Figure 111: Image analysis: rating of the contaminated surface of C2, C3, C4 and C5 composites exposed to 30°C and 90% RH during the test period correlated to the fungal growth phases with I: Lag phase, II: Exponential phase, III:
Decelerating phase and IV: Stationary phase
N°
C1
C2
C3
C4
C5
Visual evaluation
0.50 ± 0.76 3.13 ± 0.83 2.88 ± 0.64 3.38 ± 0.74 5.00 ± 0.00
Image analysis
0.00
3.13
2.93
3.43
5.00
Rating scale
No fungi
> 50 %
> 25 %
> 50 %
> 75 %
Table 19: Average rating from visual evaluation compared to average rating from image analysis of mold growth on specimens after 12 weeks at 30°C and 90% RH
3.4 Microscopic visualizations
After the test period, a sampling of mold is collected in order to identify the type of fungi, which is responsible for the sample damage. Three species of mold are
identified: Aspergillus ruber, Eurotium rubrum (ER), the sexual form of Aspergillus ruber , Phoma sp and Penicillium brevicompactum. All contaminated composites (from C2 to C5) are infected by these four
species of mold. The fungi are divided in three types of colonizers which need a minimum of available water for fungal growth on the composites surfaces. The available water in the composites is defined by the water activity (aw) which corresponds to the equilibrium relative
humidity (ERH) in percent in the materials. Three colonizers are: primary (aw ≤ 0.80), secondary (0.80 < aw
≤ 0.90) and tertiary (0.80 < aw). Penicillium
brevicompactum , Eurotium rubrum and Aspergillus ruber are primary colonizers whereas Leptosphaeria maculans (LM) is secondary colonizer and may gradually become the dominant fungi. This means that the fungi belonging to the primary colonizers have appeared as soon as the water activity in the specimens made it possible. The secondary colonizer has appeared later, certainly towards the end of the test as these colonizers needs higher water activity than the primary colonizers. However, they may create more damage than the primary colonizers because they prefer more complex sugars as cellulose for example. Finally, all these molds are potentially allergens. Indeed, these molds are associated with allergic reactions such as allergic rhinitis or asthma symptoms.
4 CONCLUSIONS
A protocol for evaluating the resistance to mold contamination of bio-based composites is proposed in this paper. It could be used to assess decay resistance of composites before making them available on the market. Accelerated aging test involves placing the composites in a favorable environment to mold growth for 3 months. Resistance to colonization of composites is then evaluated over time using three tests:
Monitoring of external surface percentage contaminated by mold;
Mass monitoring; Microscopic analysis.
Mass monitoring overlaps the effect of water absorption and decay. It provides information on long-term degradation of composites. For C2, C3, C4 and C5 composites, the kinetics of mass loss increase linearly after the first week. This week certainly corresponds to the needed time to obtain sufficient water content in the specimens in order to trigger mold growth.
The percentage of the external surface contaminated by the composites is monitored by analyzing images of the composites recorded during the test. The proposed method is based on an adaptation of a DIC algorithm. Growth kinetics observed during the test is consistent with what is described in the biology literature and suggests that the proposed method provides consistent and exploitable results.
The microscopic analysis makes it possible to identify the species present on the composite. All identified molds are potential allergens. These are mainly molds from primary colonizers. The observation of a few individuals from secondary colonizers suggests that the degradation process of the composites is still ongoing after 3 months of testing. Indeed, these colonizers would gradually become the dominant fungi if nutrients are still available on the substrate. Moreover, they may create more damage than the primary colonizers because they prefer more complex sugars. Continuous mass monitoring could have been interesting in order to verify this hypothesis.
This test also makes it possible to establish a link
their resistance to fungal colonization. The results suggest that the pH of given building material is an important predictor of fungal susceptibility. Indeed, C1 formulation is the most resistant to fungal development. This is due to having a surface pH of 10. The other formulations have a surface pH less than or equal to 6 and have a more or less significant fungal development. Another important predictor is the chemical composition of specimens. However, C3 formulation contains paraffin to increase the water repellence. Thus, the water content in the C3 specimens is lower than other specimens leading to lower kinetics of mold growth on its exposed surface.
5 ACKNOWLEDGEMENTS
This project has received funding from the European Union’s Horizon 2020 research and innovation program under grant agreement No. 636835 – The authors would like to thank them. The authors also thank the AUGC association (Association Universitaire de Génie Civil) for its financial support. Thanks are due to Tony Hautecoeur for his participation in the completion of this work.
6 REFERENCES
[Amziane 2017] Amziane, S.; Collet, F.; Lawrence, M.; Sonebi, M.; Recommendation of the RILEM TC 236-BBM: characterisation testing of hemp shiv to determine the initial water content, water absorption, dry density, particle size distribution and thermal conductivity, Materials and Structures, 2017 , 50, 3, 167, ISSN 1359-5997, 1871-6873.
[Besnard 2006] Besnard, G ; Hild, F.; Roux, S ; “Finite-Element” Displacement Fields Analysis from Digital Images: Application to Portevin–Le Châtelier Bands, Experimental Mechanics, 2006 , 46, 6, 789–803, ISSN 0014-4851, 1741-2765.
[Clausen 2013] Clausen, C.A.; Yang, V.W.; Image analysis for mould and sapstain detection on wood., 16.06.2013, Place: Stockholm (Sweden), ISBN 2000-8953.
[Garzón-Barrero 2016] Garzón-Barrero, N.M.; Shirakawa, M.A.; Brazolin, S.; Savastano, H.; Evaluation of mold growth on sugarcane bagasse particleboards in natural exposure and in accelerated test, International Biodeterioration & Biodegradation, 2016 , 115, 266–276, ISSN 0964-8305.
[Leveau 2001] Leveau, J.-Y.; Larpent, J.-P.; Bouix, M.; Sécurité microbiologique des procédés alimentaires, Techniques de l’ingénieur. Bioprocédés, 2001, F1120. [Nevalainen 2005] Nevalainen, A.; Seuri, M.; Of microbes and men, Indoor Air, 2005 , 15 Suppl 9, 58–64, ISSN 0905-6947.
[Nielsen 2004] Nielsen, P.A.; Holm, G.; Uttrup, L.P; Mould growth on building materials under low water activities. Influence of humidity and temperature on fungal growth and secondary metabolism, International Biodeterioration & Biodegradation, 2004 , 54, 4, 325– 336, ISSN 09648305.
[Rode 2005] Rode, C.; Peuhkuri, R.H.; Mortensen, L.H.; others Moisture buffering of building materials, Technical University of Denmark, Department of Civil Engineering, 2005.