HAL Id: hal-00318047
https://hal.archives-ouvertes.fr/hal-00318047
Submitted on 3 Jul 2006
HAL is a multi-disciplinary open access
archive for the deposit and dissemination of
sci-entific research documents, whether they are
pub-lished or not. The documents may come from
teaching and research institutions in France or
abroad, or from public or private research centers.
L’archive ouverte pluridisciplinaire HAL, est
destinée au dépôt et à la diffusion de documents
scientifiques de niveau recherche, publiés ou non,
émanant des établissements d’enseignement et de
recherche français ou étrangers, des laboratoires
publics ou privés.
Statistics of 150-km echoes over Jicamarca based on
low-power VHF observations
J. L. Chau, E. Kudeki
To cite this version:
J. L. Chau, E. Kudeki. Statistics of 150-km echoes over Jicamarca based on low-power VHF
observa-tions. Annales Geophysicae, European Geosciences Union, 2006, 24 (5), pp.1305-1310. �hal-00318047�
www.ann-geophys.net/24/1305/2006/ © European Geosciences Union 2006
Annales
Geophysicae
Statistics of 150-km echoes over Jicamarca based on low-power
VHF observations
J. L. Chau1and E. Kudeki2
1Radio Observatorio de Jicamarca, Instituto Geof´ısico del Per´u, Lima, Peru
2Department of Electrical and Computer Engineering, University of Illinois, Urbana-Champaign, Illinois, USA
Received: 17 August 2005 – Revised: 22 November 2005 – Accepted: 11 November 2005 – Published: 3 July 2006 Part of Special Issue “The 11th International Symposium on Equatorial Aeronomy (ISEA-11), Taipei, May 2005”
Abstract. In this work we summarize the statistics of the
so-called 150-km echoes obtained with a low-power VHF radar operation at the Jicamarca Radio Observatory (11.97◦S, 76.87◦W, and 1.3◦ dip angle at 150-km altitude) in Peru. Our results are based on almost four years of observations be-tween August 2001 and July 2005 (approximately 150 days per year). The majority of the observations have been con-ducted between 08:00 and 17:00 LT. We present the statis-tics of occurrence of the echoes for each of the four seasons as a function of time of day and altitude. The occurrence frequency of the echoes is ∼75% around noon and start de-creasing after 15:00 LT and disappear after 17:00 LT in all seasons. As shown in previous campaign observations, the 150-echoes appear at a higher altitude (>150 km) in narrow layers in the morning, reaching lower altitudes (∼135 km) around noon, and disappear at higher altitudes (>150 km) after 17:00 LT. We show that although 150-km echoes are observed all year long, they exhibit a clear seasonal variabil-ity on altitudinal coverage and the percentage of occurrence around noon and early in the morning. We also show that there is a strong day-to-day variability, and no correlation with magnetic activity. Although our results do not solve the 150-km riddle, they should be taken into account when a rea-sonable theory is proposed.
Keywords. Ionosphere (Equatorial ionosphere; Ionospheric
irregularities; Electric fields and currents)
1 Introduction
Since the early 1960’s VHF radar echoes have been observed and reported from around the 150-km altitude region above the Jicamarca Radio Observatory (JRO) in Peru (e.g. Bowles et al., 1962; Balsley, 1964). Since then these so-called
150-Correspondence to: J. L. Chau
km echoes have been observed on a campaign basis at Jica-marca (e.g. Royrvik and Miller, 1981; Kudeki and Fawcett, 1993; Fawcett, 1999), using the high power backscatter radar system. More recently, the150-km echoes have also been ob-served at other sites (e.g. Kudeki et al., 1998; Blanc et al., 1996, de Paula and Hysell, 2004), all of them with low-power radar systems located within a few degrees of the magnetic equator and with radar beams pointing perpendicular to the geomagnetic field (B).
The main characteristics of the equatorial 150-km echoes obtained from radar observations perpendicular to B can be summarized as follows (e.g. Fawcett, 1999): (1) they are confined to daytime hours at equatorial magnetic latitudes; (2) they occur at upper E region heights between 140 and 170 km; and (3) they exhibit narrow Doppler spectral widths (<15 ms−1). In addition, their vertical Doppler velocities coincide with the vertical component of the F-region E×B plasma drift (Chau and Woodman, 2004). As such, 150-km echoes facilitate an economical and reliable way of measur-ing these drifts, particularly durmeasur-ing the day. For example, Anderson et al. (2004) have used many days of drift data obtained from 150-km echoes, to find a reliable empirical model to derive F-region zonal electric fields from magne-tometer 1H observations.
Although 150-km echoes have been observed and stud-ied for many years, the physical mechanism which causes them is still unknown. Recently, Chau (2004) showed that 150-km echoes can also be observed with radar beams a few degrees away from perpendicular to B, although in that case the echo power is many dBs weaker. Moreover, these off-perpendicular returns have much wider Doppler spectra, comparable to the spectra of incoherent scatter returns from lower F region heights. These very intriguing results add to what has been dubbed as the “150-km riddle” in the iono-spheric radar community.
In this work, we report on the statistics of 150-km echoes derived from almost four years of Jicamarca observations
1306 J. L. Chau and E. Kudeki: Statistics of 150-km echoes over Jicamarca
Table 1. Radar parameters for observing 150-km echoes at Jicamarca.
Parameter Value Units
Inter-Pulse Period (IPP) 1.33 (200) ms (km)
Pulse width 20 (3) µs (km)
Receiver Bandwidth 20 µs
Sampling rate 10 (1.5) µs (km)
Number of complex channels 2
Transmitter peak power 2×20 kW
Spectra time averaging 1 min
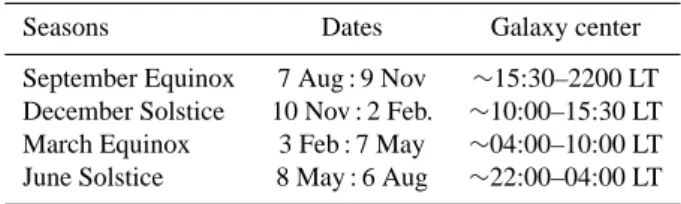
Table 2. Seasons considered for 150-km echo statistics.
Seasons Dates Galaxy center
September Equinox 7 Aug : 9 Nov ∼15:30–2200 LT December Solstice 10 Nov : 2 Feb. ∼10:00–15:30 LT March Equinox 3 Feb : 7 May ∼04:00–10:00 LT June Solstice 8 May : 6 Aug ∼22:00–04:00 LT
between 2001 and 2005 (with an average of 150 days per year), obtained with a low-power configuration of the Ji-camarca radar known as the JULIA (JiJi-camarca Unattended Long Term Investigations of the Atmosphere) system. The observations were carried out with antenna beams pointed perpendicular to B. Although our results do not solve the 150-km riddle, they do provide important information that any theory attempting to explain the 150-km echoes should consider. Particularly important is our finding that the echoes can be observed at Jicamarca every day in all seasons, which is contrary to the results from Pohnpei, where 150-km returns are only detected during the local summer months (Tsunoda and Ecklund, 2004).
The paper is organized as follows: In Sect. 2 we present the experimental setup for the observations used in our study. Section 3 presents the statistical occurrence data obtained with the JULIA system. Finally, in Sect. 4 we discuss the results and present our conclusions.
2 Experimental Setup
The results presented in this paper have been obtained with the JULIA system of the Jicamarca radar. The observations have been made using two different antenna beam configura-tions: (a) a single vertical beam, and (b) an east-west (EW) beam pair. The single vertical beam configuration uses the two orthogonal linear polarizations of the Jicamarca antenna array pointing perpendicular to B in the geomagnetic merid-ian plane. The north and south quarters of the array are used for transmission. On reception, the east and west quarters
are used independently, forming an east-west baseline inter-ferometer. A similar configuration has also been used since 1996 to study the equatorial electrojet (EEJ) and equatorial spread F (ESF) irregularities (Hysell et al., 1997; Hysell and Burcham, 1998; Hysell and Burcham, 2002). Originally, this configuration was also intended for measuring 150-km echoes, but the sensitivity proved not to be sufficient in the early attempts (D. Hysell, personal communication, 2000). However, successful observations of 150-km echoes have been performed since August 2001, when the sensitivity was improved by:
– Using two antenna quarters – north and south – instead
of one, in reception, and thus increasing the collecting area in the elongation direction of the scattering density irregularities.
– Increasing the transmitter pulse width from 1 to 3 km. – Decreasing the receiver bandwidth from 200 to 50 kHz,
and
– Using coherent integrations to improve the
signal-to-noise ratio (SNR).
The main parameters obtained with this mode are: (a) SNR, (b) vertical drift, and (c) spectral width. These parameters are extracted by fitting a Gaussian model to the measured Doppler spectra. The fitting procedure takes into account the instrumental function due to truncated time series and uses a Levenberg-Marquardt algorithm (e.g. Bevington, 1969).
The second antenna configuration uses a pair of beams, both pointed perpendicular to B and ∼±2.5◦to the east and
west of the magnetic meridian plane. Each beam in this mode is formed using one of the linear polarizations of the Jica-marca array (in transmission, as well as reception). This EW beam-pair configuration is similar to the one used to measure the vertical and zonal F-region drifts at Jicamarca with inco-herent scatter techniques (e.g. Kudeki et al., 1999). As in F-region drift measurements, the vertical and zonal 150-km drifts are obtained from the radial velocities derived from the two beams. It is important to mention that contrary to the observations of EEJ and ESF, east-west baseline interferom-etry does not provide usable zonal drift estimates from the 150-km echoes, forcing us to use the EW beam pair con-figuration described here. The EW beam-pair observations started in September 2003. The main parameters derived from this mode are: (a) SNR in two beam directions, (b) vertical drift, (c) zonal drift, and (d) spectral width, obtained, once again, with a Gaussian spectral fitting applied to each beam data independently.
In both configurations we use two low-power transmitters which are phased together to excite the transmission antennas as a single unit. Also identical radar parameters, summarized in Table 1, are used in both modes. The observations be-fore September 2003 were taken with the single beam mode, whereas more recent observations make use of one of the
140 150 160 170 Range (km)
(a) 150-km SNR
-20 0 20 ExB (m s -1 ) (dB) -10 0 10 20 30 140 150 160 170 Range (km)(b) 150-km Vertical Drift
m s -1 -40. -20. 0. 20. 40. 9:00 10:00 11:00 12:00 13:00 14:00 15:00 16:00 Local Time 140 150 160 170 Range (km)(c) Spectral Width
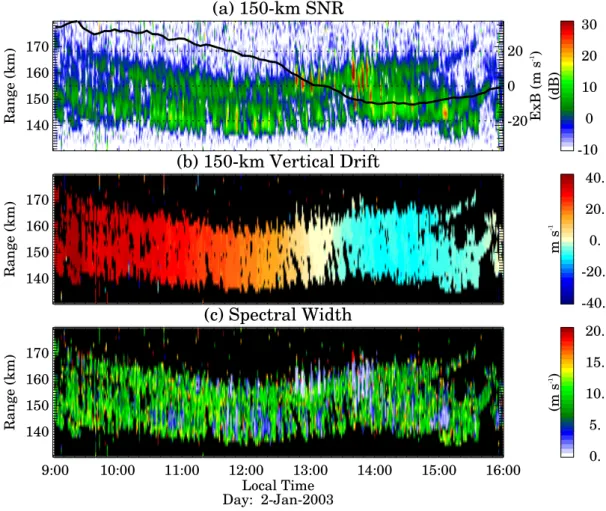
Day: 2-Jan-2003 (m s -1 ) 0. 5. 10. 15. 20.Fig. 1. Example of 150-km parameters from a vertical beam configuration: (a) SNR (dB), (b) vertical drift (ms−1), and (c) spectral width (ms−1), for 3 January 2003.
two configurations depending on Jicamarca scheduling – as in the case of most JULIA observations, the 150-km observa-tions have been conducted during the idle times of the main Jicamarca array, i.e. when the high-power system was not operational or the antenna was not under maintenance. It is important to note that the expected SNR is slightly higher (1– 2 dB) in the vertical beam configuration than when the EW beam pair is used.
As indicated above, the 150-km echo statistics have been obtained for four different seasons. In Table 2 we summarize the seasons considered, including the dates, and the periods where the Galaxy center passes over the Jicamarca beams. At Jicamarca, the overall system noise is dominated by sky noise, and the hottest region in the sky is the Galaxy center (∼10 times larger sky temperature than the minimum).
3 Radar observations
In Fig. 1, we show a typical example of the observations ob-tained with the vertical beam configuration: (a) SNR (dB), (b) vertical drift (ms−1), (c) Doppler spectral width (ms−1).
The solid line in Fig. 1a indicates the height averaged verti-cal drift from Fig. 1b. Note that the vertiverti-cal drift and spectral width values have been “cleaned” using a low SNR threshold of –3 dB and an upper spectral width threshold of 20 ms−1. Also note that the strength of the 150-km echoes is not de-pendent on the direction and amplitude of the vertical drift. In the case of the EW beam configuration, we also obtain a zonal drift map (at the expense of a few dB SNR per radar beam).
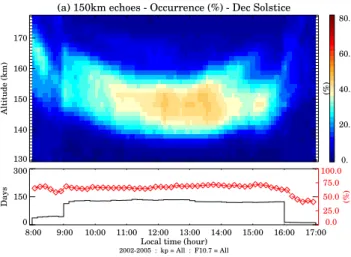
The next four figures show the occurrence statistics of 150-km echoes classified by four different seasons: (a) September equinox (Fig. 2), (b) December solstice (Fig. 3), (c) March equinox (Fig. 4), and (d) June solstice (Fig. 5). Each plot shows the frequency of occurrence of 150-km echoes as a function of the time of day and observation al-titude. A good count has been obtained from the selection criteria established above, i.e. an SNR threshold of –3 dB and spectral width threshold of 20 ms−1. Each count is accu-mulated over bins of 3-km and 10-min width between 130-and 180-km altitude 130-and 08:00 130-and 17:00 LT. At the bottom of each plot, we show the number of days contributing to
1308 J. L. Chau and E. Kudeki: Statistics of 150-km echoes over Jicamarca 130 140 150 160 170 Altitude (km)
(a) 150km echoes - Occurrence (%) - Sep Equinox
(%) 0. 20. 40. 60. 80. 8:00 9:00 10:00 11:00 12:00 13:00 14:00 15:00 16:00 17:00 Local time (hour)
0 150 300 Days 0.0 25.0 50.0 75.0 100.0 (%) 2001-2005 : kp = All : F10.7 = All
Fig. 2. Diurnal occurrence of 150-km echoes for the September
equinox period, based on 2001–2005 observations. The top panel shows the statistics as a function of time of the day and altitude. The bottom panel shows the number of days considered (in black) and the occurrence for a given time independent of altitude (in red).
130 140 150 160 170 Altitude (km)
(a) 150km echoes - Occurrence (%) - Dec Solstice
(%) 0. 20. 40. 60. 80. 8:00 9:00 10:00 11:00 12:00 13:00 14:00 15:00 16:00 17:00 Local time (hour)
0 150 300 Days 0.0 25.0 50.0 75.0 100.0 (%) 2002-2005 : kp = All : F10.7 = All
Fig. 3. Diurnal occurrence of 150-km echoes for December solstice
period.
the statistics (in black) and also occurrence frequency of the echoes (in red), independent of the altitude of occurrence.
The main results of these statistical plots can be summa-rized as follows:
– The frequency of occurrence maps for all four seasons
exhibit the characteristic necklace shape of the 150-km RTI maps obtained in previous observations, i.e. lower in altitude around noon and higher up at the beginning (∼08:00 LT) and at the end (∼17:00 LT).
– Echoes occur more frequently at lower altitudes
dur-ing June solstice and September equinox months (∼145 km) as compared to December solstice and March equinox (∼150 km). 130 140 150 160 170 Altitude (km)
(a) 150km echoes - Occurrence (%) - Mar Equinox
(%) 0. 20. 40. 60. 80. 8:00 9:00 10:00 11:00 12:00 13:00 14:00 15:00 16:00 17:00 Local time (hour)
0 150 300 Days 0.0 25.0 50.0 75.0 100.0 (%) 2001-2005 : kp = All : F10.7 = All
Fig. 4. Diurnal occurrence of 150-km echoes for March equinox.
130 140 150 160 170 Altitude (km)
(a) 150km echoes - Occurrence (%) - Jun Solstice
(%) 0. 20. 40. 60. 80. 8:00 9:00 10:00 11:00 12:00 13:00 14:00 15:00 16:00 17:00 Local time (hour)
0 150 300 Days 0.0 25.0 50.0 75.0 100.0 (%) 2001-2005 : kp = All : F10.7 = All
Fig. 5. Diurnal occurrence of 150-km echoes for June solstice
period.
– Echoes occur at a wider range of altitudes during March
equinox and June solstice (140–160 km) as compared to other months (145–155 km).
– The occurrence frequency is high (>70%) for all four
seasons, the highest being >85% for June solstice.
– Echoes occur most frequently within ±2–3 h centered
about 12:00 LT in all seasons, except that the duration is somewhat longer in June solstice.
– The echoes are less frequent (and have lower power)
be-fore 09:00 LT and after 15:00 LT, with the smallest fre-quency in the late afternoon during September equinox. We attribute this result to a Galaxy pass in the late af-ternoon during September equinox – the Galaxy pass in December solstice is between 10:00–15:30 LT, and be-tween 08:00 and 10:00 LT for March equinox.
Daily SNR of 150km echoes
O D F A J A O D F A J A O D F A J A O D F A J From: 1-Aug-2001 (213) to: 21-Jul-2005 (202) 0 10 20 30 40 SNR (dB) Mean Median Max. Maximum
Fig. 6. Time series of 150-km SNR values: mean (♦), median of
higher values (4), and maximum values (•). Measurements were conducted between August 2001 and July 2005.
– The occurrence frequency of early morning echoes is
higher during December solstice and March equinox compared to other seasons (see the red curves in bot-tom plots) and exhibits a layered structure.
It is important to note that there is a small occurrence of specular meteor echoes that has not been caught by our clean-ing procedures. The influence of these can be noticed below 140 km and between 08:00 and 10:00 LT, particularly dur-ing September equinox and December solstice. The meteor echoes could bias our results shown in red (i.e. occurrence frequency irrespective of altitude), but their occurrence is too small to be significant.
In order to examine the day-to-day and annual variability of 150-km echoes, we show the time series of the measured SNR values in Fig. 6. The SNR values have been obtained between 140- and 160-km altitude and 10:00 and 14:00 LT, using a low-SNR threshold of 0 dB and an upper spectral width limit of 20 m/s. The average SNR is shown with ♦, the maximum SNR in •, and the median of the higher SNRs in 4. It is clear that there is a strong day-to-day variabil-ity, not only in the maximum values – which could be larger than 40 dB – but also in the median and mean values. How-ever, there is no clear signature of any annual variability, and, therefore, there is apparently no dependence on solar activ-ity (although more years of observations may be needed to obtain conclusive results).
We also conducted a statistical study based on magnetic activity, using a kp index for classification. The study (the
results are not shown here) failed to identify any correla-tion between magnetic activity and 150-km echoes. Figure 1 supports our findings – note that the strength of the 150-km echoes is not affected by the electric field reversal caused by magnetic disturbances (kp=5).
4 Concluding remarks
Recently, Tsunoda and Ecklund (2004) showed that 150-km echoes observed with the 50-MHz Pohnpei radar (6.96◦N, 158.19◦E geographic, 0.3◦magnetic dip latitude) exhibit a strong seasonal dependence, occurring mainly during north-ern summer months, i.e. June solstice, while having minimal activity in other seasons. The authors related this enhanced occurrence in June to a similar enhancement in June of spo-radic E (Es), and suggested that an Es-layer instability may
generate a polarization electric field and map to the 150-km region where the 150-km echoes are generated.
Our observations at Jicamarca, on the other hand, indicate no seasonal preference for the occurrence or strength of 150-km echoes. As suggested by Tsunoda and Ecklund (2004) the lack of seasonal variability over Jicamarca might be due to weaker sporadic Esactivities observed in Jicamarca’s
lon-gitude sector. However, Chau et al. (2002) have shown that VHF radar echoes associated with Eslayers in the Jicamarca
sector – observed with the Piura radar (∼900 km north of Ji-camarca) – are stronger and more frequent during the south-ern summer, i.e. December solstice. So there is a detectable seasonal dependence of Es in the Jicamarca sector, but it
seems that the variability has no effect on the seasonal statis-tics of 150-km echoes.
We also think that there may be a relationship between 150-km echoes and the electrodynamics of the associated E region north and south of the geomagnetic equator, but the relationship appears not to be as straightforward as what has been proposed by Tsunoda and Ecklund (2004). Another puzzle at Jicamarca longitudes, which may or may not be a part of the 150-km riddle, is the result by Cohen and Bowles (1963) – based on one year of observations during the IGY – which show a pronounced asymmetry between E-region VHF echoes observed 5◦S
mand 5◦Nm, with the echoes
be-ing stronger 5◦S
min (nearly) all seasons.
As mentioned in the Introduction, the physical mechanism leading to the generation of 150-km echoes is still unknown. Our results presented here do not solve the 150-km riddle, but we think they are important and they should be consid-ered by any proposed theory – in particular, a successful the-ory should be able to account for the occurrence of 150-km echoes in all seasons, the variability with season of echo oc-currence in altitude, as well as time of the day, and the day-to-day variability.
Acknowledgements. We thank the Jicamarca staff for performing
the experiments and pre-processing the data, in particular, D. Scip-ion, G. Vera, and H. Pinedo. The Jicamarca Radio Observatory is a facility of the Instituto Geof´ısico del Per´u and is operated with sup-port from the NSF Cooperative Agreement ATM-0432565 through Cornell University. This research was funded at the University of Illinois by the NSF grant ATM-0215246.
Topical Editor M. Pinnock thanks N. Aponte for his help in evaluating this paper.
1310 J. L. Chau and E. Kudeki: Statistics of 150-km echoes over Jicamarca
References
Anderson, D. N., Anghel, A., Chau, J. L., and Veliz, O.: Daytime, Vertical ExB Drift Velocities Inferred from Ground-Based Mag-netometer Observations at Low Latitudes, Space Weather, vol. 2, S11001, doi:10.1029/2004SW000095, 2004.
Balsley, B. B.: Evidence of a Stratified Echoing Region at 150 Kilometers in the Vecinity of Magnetic Equator During Daylight Hours, J. Geophys. Res., 69, 1925–1930, 1964.
Bevington, P. R.: Data Reduction and Error Analysis for the Physi-cal Sciences, McGraw Hill, 1969.
Blanc, E., Mercandalli, B., and Houngninou, E.: Kilometric Ir-regularities in the E and F Regions of the Daytime Equatorial Ionosphere Observed by a High Resolution HF Radar, Geo-phys. Res. Lett., 23, 645–648, 1996.
Bowles, K. L., Ochs, G. R., and Green, J. L.: On the Absolute Intensity of Incoherent Scatter Echoes from the Ionosphere, J. of Res. NBS – D. Rad. Prop., 66D, 395–407, 1962.
Chau, J., Woodman, R. F., and Flores, L. A.: Statistical Character-istics of Low-Latitude Ionospheric Field-Aligned Irregularities Obtained with the Piura VHF Radar, Ann. Geophys., 20, 1203– 1212, 2002.
Chau, J. L.: Unexpected Spectral Characteristics of VHF Radar Sig-nals from 150-Km Region over Jicamarca, Geophys. Res. Lett., 31, L23803, doi:10.1029/2004GL021620, 2004.
Chau, J. L. and Woodman, R. F.: Daytime Vertical and Zonal Velocities from 150-Km Echoes: Their Relevance to F-Region Dynamics, Geophys. Res. Lett., 31, L17801, doi:10.1029/2004GL020800, 2004.
Cohen, R. and Bowles, K. L.: Ionospheric VHF Scattering Near the Magnetic Equator During the International Geophysical Year, J. Res. Natl. Bur. Stand. U. S., Sect. D, 67, 459–480, 1963.
de Paula, E. R. and Hysell, D. L.: The Sao Luis 30 MHz Coherent Scatter Ionospheric Radar: System Description and Initial Re-sults, Radio Sci., 39, doi:10.1029/2003RS002914, 2004. Fawcett, C.: An Investigation of Equatorial 150-Km Irregularities,
Ph.D. thesis, Univ. of Illinois at Urbana-Champaign, 1999. Hysell, D. L. and Burcham, J. D.: JULIA Radar Studies of
Equato-rial Spread F, J. Geophys. Res., 103, 29 155–29 167, 1998. Hysell, D. L. and Burcham, J. D.: Long Term Studies of
Equa-torial Spread F Using the JULIA Radar at Jicamarca, J. At-mos. Sol. Terr. Phys., 64, 1531–1543, 2002.
Hysell, D. L., Larsen, M. F., and Woodman, R. F.: JULIA Radar Studies of Electric Fields in the Equatorial Electrojet, Geo-phys. Res. Lett., 24, 1687–1690, 1997.
Kudeki, E. and Fawcett, C. D.: High resolution observations of 150 Km echoes at Jicamarca, Geophys. Res. Lett., 20, 1987– 1990, 1993.
Kudeki, E., Fawcett, C. D., Ecklund, W. L., Johnston, P. E., and Franke, S. J.: Equatorial 150-Km Irregularities Observed at Pohnpei, Geophys. Res. Lett., 25, 4079–4082, 1998.
Kudeki, E., Bhattacharyya, S., and Woodman, R. F.: A New Ap-proach in Incoherent Scatter F Region E x B Drift Measurements at Jicamarca, J. Geophys. Res., 104, 28 145–28 162, 1999. Royrvik, O. and Miller, K. L.: Nonthermal Scattering of Radio
Waves Near 150 Km Above Jicamarca, Peru, J. Geophys. Res., 86, 180–188, 1981.
Tsunoda, R. T. and Ecklund, W. L.: On a Summer Maxi-mum in the Occurrence Frequency of 150 Km (F1) Radar Echoes over Pohnpei, Geophys. Res. Lett., 31, L06810, doi:10.1029/2003GL018704, 2004.