by
M. S. Tillack and M. S. Kazimi
July 1980
Plasma Fusion Center and
Department of Nuclear Engineering Massachusetts Institute of Technology
Cambridge, Massachusetts 02139
ABSTRACT
LITFIRE is a computer code written to simulate the combustion of lithium in fusion reactor containments. The accuracy of LITFIRE in predicting containment responses has been tested against small-scale spills performed at the Hanford Engineering Development Laboratory.
Based in part on these comparisons, modifications to the code were made to improve its accuracy. Both the chemical reaction rate calcula-tions and the heat transfer mechanisms have been affected. More general improvements were made to extend its applicability, particularly with respect to alternate geometries. The code was expanded to allow for
(1) determination of the effects of lithium-concrete reactions, and (2) the existence of a physical separation between the spill area and the containment.
It is found that the modified code temperature field predictions are lower than the original code predictions. However, even the current predictions of lithium-air reaction consequences appear to be conservative in comparison with observations from the small-scale experiments.
page Abstract 2 Table of Contents 3 List of Figures 5 List of Tables 6 Chapter I Introduction 7
Chapter II LITFIRE Description
2.1 Purpose of the Model 14
2.2 History of LITFIRE 15
2.3 LITFIRE Model Description 16
2.4 Recent Changes to the LITFIRE Geometry 19
Chapter III Description of HEDL Experiments
3.1 Introduction 22
3.2 Description of HEDL Test Cell 22
3.3 Description of the HEDL Test Procedure 27 3.4 Modelling of the HEDL Experiment in LITFIRE 29
3.4.1 Geometric Considerations 30
3.4.2 Idealization in the LITFIRE Model 32
Chapter IV Model Development and Verification
4.1 Introduction 36
4.2 Tests with no Combustion 38
4.2.1 Overview 38
4.2.2 Physical Properties and Test Conditions _ 40 4.2.3 Non-Ideal Geometrical Effects and
the Determination of Heat Transfer
4.3 Nitrogen Combustion 44
4.3.1 Overview_ . .--- __.___ 44
4.3.2 Temperature Dependence of Nitrogen Reaction 47 Rate Curve
4.3.3 Combustion Zone and Film Properties 48 4.3.4 Mass Transport to the Combustion Zone 52
4.3.5 Cell Gas Emissivity 56
4.4 Multiple Species Combustion. 58
4.4.1 Overview -_58
4.4.2 Some Observations on Lithium-Air Reaction 59 Kinetics
4.4.3 Gas Emissivity Calculation 64
4.5 Summary of Comparisons 66
Chapter V LITFIRE Model Extensions
5.1 Introduction .. 69
5.2 Two-Cell Code 70
5.2.1 Motivation for Development of Two-Cell Code 70
5.2.2 Node Structure 71
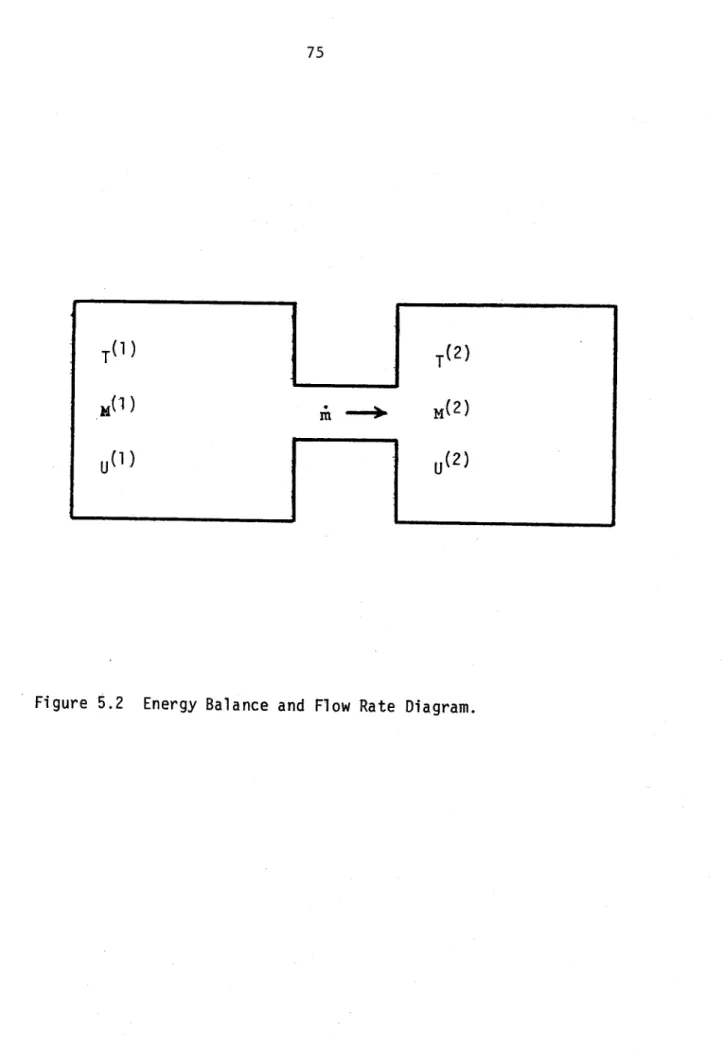
5.2.3 Flow Rate and Energy Balance Calculations 71 5.2.4 Effects of Two-Cell Structure on Containment 76
Response
5.3 Concrete Combustion 7 8
5.3.1
Introduction
785.3.2 Assumptions Made in Modelling the Concrete ... 82 Combustion Zone
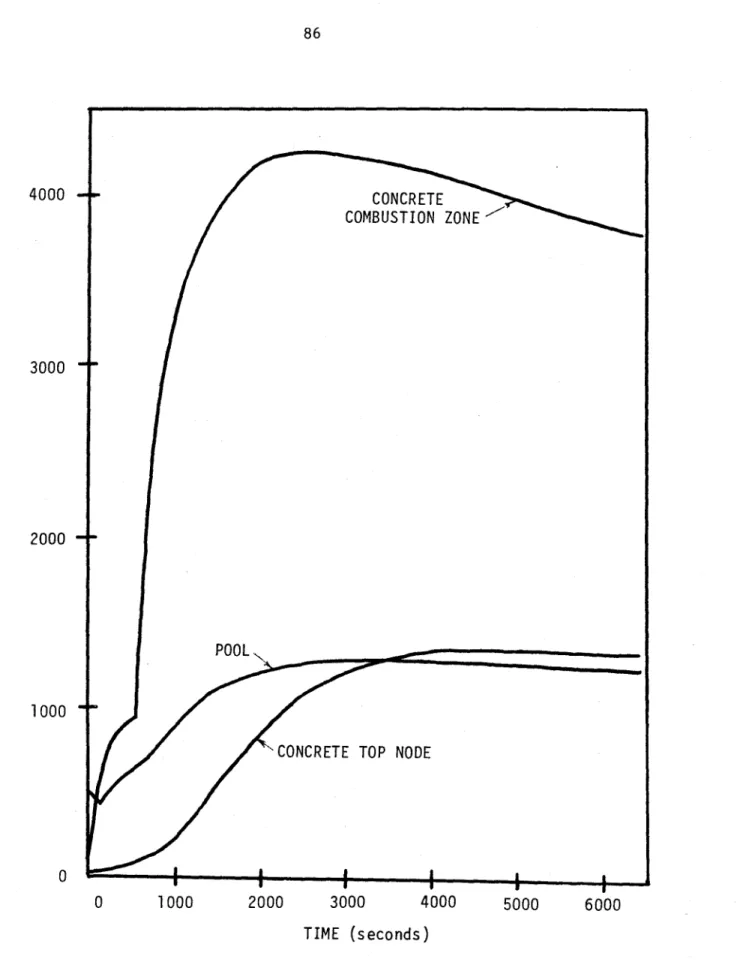
5.3.3 Sample Results 84
Chapter VI Conclusions, Evaluations, and Recommendations. 87 6.1 Updated Predictions for UWMAK-III
6.2 The Future of LITFIRE
92 References
no. page
2.1 One-Cell Node Structure with Suspended Pan 18
3.1 Schematic of HEDL Lithium-Atmosphere Reaction
Test Equipment Arrangement 25
3.2 Schematic of HEDL Lithium-Atmosphere Reaction and
Heater Pans 26
3.3 Radiation from the Suspended Pan 34
4.1 LN-1 Pool Temperature. Effect of Pool Emissivity and
Convection Coefficient on Lithium Cooling Rate 41
4.2 Combustion Zone Geometry 45
4.3 Nitrogen Reaction Rate Curves 46
4.4 Radiation Heat Transfer Equivalent Circuit Diagram 51 4.5 Effect of Changing the Combustion Zone Emissivity
and Film Conductivity 53
4.6 LN-3 Lithium Consumption Curves 55
4.7 LN-3 Sensitivity of Gas Temperature to Gas Emissivity 57
4.8 LA-2 Amount of Gases Consumed 61
4.9 Oxygen Concentration in the Cell Atmosphere for
LA-1 and LA-2 63
4.10 LA-2 Cell Gas Temperature Sensitivity to Gas Emissivity 65
5.1 Two-Cell Node Structure 72
5.2 Energy Balance and Flow Rate Diagram 75
5.3 Two-Cell Results 77
5.4 Concrete Combustion Zone Nodalization 80
5.5 Temperature Predictions for Lithium-Concrete Reactions 86 6.1 Comparison of Current LITFIRE Predictions with
List of Tables
no.
1.1 Potential Tritium Breeding Reactions --- 10
1.2 Lithium Properties Favoring its Use as a Coolant 11
1.3 Lithium Chemical Reactions 12
1.4 Comparison of Alternate Coolants and Breeding Materials-_ 13
3.1 HEDL Test Summary . 23
3.2 Classification of Tests 24
4.1 LA-2 Reaction Rate Calculation 60
4.2 Summary of Primary Conclusions from Comparisons 68
5.1 Reactions of Lithium with Concrete 79
I. INTRODUCTION
The first generation of fusion power plants will almost cer-tainly be based on the D-T fuel cycle, given by:
2 3 4
H + H - 4 He + n + 17.6 MeV
This is a consequence of the extraordinary difficulty in con-taining and heating a plasma. D-T ignites at values of nT* two orders of magnitude lower than the next most promising contender, D-D. Coupled with the fact that D-T ignites at a lower temperature than most other fuels, this implies that the technology required to replace D-T will involve considerable time and effort.
Since tritium ( H) does not occur naturally in sufficient
quantities, it must be obtained either externally (such as from fission reactor effuents) or internally through breeding. Table 1.1 lists some tritium producing reactions. Only the lithium reaction offers a real hope of attaining total tritium regeneration.1 The neutron economy is quite strict, ruling out reactions of low neutron absorption cross section or low utilization fraction. In fact, even with lithium it may be necessary to use neutron multiplication in the blanket via
(n,2n) reactions in medium-sized nuclei.
*
nT, the Lawson parameter, characterizes the degree of con-finemens necessary for energy breakeven. For D-T, it is about 6 x 10
Fortunately, lithium is abundant in salt deposits and in sea water. Metallic lithium also has excellent heat transfer properties which make it a likely candidate for primary coolant as well as breeding medium. (see table 1.2) Combining these two functions will have the added advantage of simplifying the engineering design
of the reactor - an important consideration since fusion reactors appear to be far too complex already. Early conceptual designs, such as UWMAK-I and UWMAK-III, took advantage of these properties of lithium by using it as their primary coolant.
Unfortunately, pure lithium is a caustic and highly flammable substance. As is evident from table 1.3, many of the materials and gases likely to be present in controlled thermonuclear reactor (CTR) containments react exothermically with lithium. For the UWMAK-III design, lithium reactions in air and concrete account for the largest potential source of energy with approximately 40,000 GJ available in chemical energy.
In addition, the reaction products of lithium (which may become airborne) are themselves very corrosive. These serious faults of pure lithium have led some of the more recent designers to abandon it in favor of compounds and eutectics of lithium - for example NUMAK and STARFIRE. However, the issue has by no means been set to rest. As fusion research evolves closer to engineering feasibility tests, we need to take a closer look at lithium handling and safety as well as the search for potential alternate coolants.
Some of the many replacements for lithium which are currently under study are listed in table 1.4. Except for lithium and Flibe, the functions of coolant and breeder are separated between two dif-ferent materials. There are advantages and disadvantages to adopting any of these. In general, the price one pays for the increase in safety is a decrease in breeding capability and inferior heat transfer properties. Whether or not these factors are critical depends upon
the particular design.
In order for the reactor designer to make an informed decision on such an important part of the system as the primary coolant and breeding medium, he needs to comprehend all of the aspects of the available choices. It is this concern which motivates the development of the LITFIRE model. LITFIRE is an attempt to quantify the potential consequences of a lithium fire more accurately than previous "first guesses" in order to ascertain just how bad it is.
TABLE 1.1
Potential Tritium Breeding Reactions
10B (n,T) 8Be + 0.2 MeV 11B (n,T) 9Be + 9.6 MeV 14N (n,T) 12C - 4.3 MeV 14N (n,T) 3 He - 11.5 MeV 6 L4He + 4.8 MeV Li (n, n T) He - 2.5 MeV 2H + n -3H 3 He (n,T) p
TABLE 1.2
Lithium Properties Favoring its Use as a Coolant
low melting point high boiling point low vapor pressure high specific heat
high thermal conductivity low density
low viscosity
low activation cross section
low pumping power compared with other liquid metals necessary as a breeding material
TABLE 1.3
Lithium Chemical Reactions
02 -a 2 Li2 0 02 - Li202 N - 2 Li3N 2 H 0 -- o 2 LiOH + H 2 heat of reaction Kcal/mole of product -43 -152 -48 -49 In Concrete 8 Li 4 Li 2 Li 2 Li 2 Li + + + + + Fe3 -30 3 Fe + 4 Li20 Sio - Si + 2 Li2 0 2-H2 0 --o 2 LiOH + H2 H2 --w 2 LiH 2 LIOH -P 2 Li 20 + H2 -151.3 (magnetite) (basalt) Others 2 Li + 2 C -- Li 2 C n Li + m Pb -- Li Pb n m In Air 4 2 6 2 Li Li Li Li + + + + -55
TABLE 1.4
Comparison of Alternate Coolants and Breeding Materials
Material pure lithium Breeder Coolant or both B + C Advantages
excellent heat transfer good breeding
good neutron moderator
Disadvantages
reactive in air and water caustic by-products of
fire
high electrical conduc-tivity
no long-term activation no neutron damage
Flibe B + C good moderator scarcity of beryllium (34Be F2: marginally good breeding chemical reactivity
uncertain 66 LiF) low vapor pressure
low electrical conduc-tivity
low tritium solubility
Li 20 B good packing fraction water reaction (good breeding) tritium retention
non-reactive in air radiation induced sinter-ing
reacts with impurities
in
coolantLi Al 02 B chemical stability requires neutron
Li2 Si 03 multiplier
Li7 Pb2 B good breeding reactive in water
non-reactive with low- high pumping power if temperature air used as coolant
water C large data base reacts with breeding materials
low boiling point and poor heat transfer properties
Helium C oxygen and other
impurities react with
metals & breeding materials high pumping power
II. LITFIRE DESCRIPTION
2.1 Purpose of the Model
LITFIRE is a computer code developed at MIT(2) to predict the
consequences of a postulated lithium spill in a fusion reactor containment. Application of the code allows quantification of the two principal dangers
arising from a lithium spill:
1) Lithium combustion may cause overpressurization if heat flow out of the containment gas is sufficiently slow. This could lead to leakage of tritium and activated materials or possibly containment rupture.
2) The heat released in the process of combustion may cause mobilization of the first wall which could contain very large quantities of radionuclides (on the order of 650 million
(3)
curies estimated for the UWMAK-III design after 2 years operation and ignoring half-lives less than 30 min.). Under extreme conditions this might come about through melting or vaporization. However, a much more likely scenario involves rapid oxidation catalyzed by hot, caustic gases, and subsequent volatilization of the oxides.
Both of these dangers are quantified in LITFIRE through the
generation of pressure and temperature profiles in an idealized geometry. By accounting for geometric effects and the various heat transfer
mechanisms, LITFIRE makes a much more accurate estimate than earlier, conservative calculations based on an adiabatic equilibrium. Still,
the code is small and very simplified. This makes it easy and inexpensive to use, but based on the results presented in Chapter 4, the accuracy is limited to 20- 30%.
2.2 History of LITFIRE
LITFIRE was first written in 1977 as a modification of the code SPOOLFIRE, developed at Argonne National Laboratory. Since
SPOOLFIRE was intended to model sodium fires, the major modification to create LITFIRE was inclusion of nitrogen and lithium-water vapor reactions, and conversion from sodium to lithium proper-ties. In addition, modeling of the combustion zone and aerosol form-ation was introduced into the code.
The LITFIRE code was then initially applied to tests of the sensitivity of a CTR containment response to various changes in the parameters characterizing an accident scenario. Conclusions were also drawn concerning the likelihood of various containment responses and the viability of different schemes for mitigating the consequences of a spill. However, the code was not strictly verified in terms of the absolute values of the temperatures and pressures which it pre-dicted.
With experimental data now in hand, the current aim of the LITFIRE development program is to compare the code results with small-scale experiments which simulate larger, full-size spills. These
comparisons are made with tests performed at Hanford Engineering Devel-opment Laboratory; they are described in full detail in chapter 3.
Several specific goals have been informally laid down for this phase of the program:
a) achieve a 20% accuracy in the LITFIRE temperature field prediction, based on
A% = 100 x HEDL - T LITFIRE
THEDL, max - THEDL, max
b) suggest and implement improvements which will increase the accuracy
c) develop a standard for proper application of LITFIRE for future users.
The fulfillment of these goals is described in the following chapters.
2.3 LITFIRE Model Description
LITFIRE traces the movement of energy from the source to the containment components, and eventually out to the ambient - a constant temperature, infinite heat sink. The source term includes both the hot lithium metal and the fire, also called the combustion zone. In tests without ignition, only the first term is present.
The heat flow mentioned above is computed using one-dimensional heat transfer relations and a combustion source term which is highly idealized. Given enough time and money, the heat transfer
mechanisms could be made almost arbitrarily accurate using well-defined correlations and attention to specific details. The
well-understood. For example, the effects of surface layer formation, wicking, bulk product buildup, and multiple species competition are all very difficult to accurately model. Improvements in these areas are sorely needed, since the accuracy of the temperature profiles is limited by the accuracy of the reaction rate.
In order to follow the containment response, LITFIRE solves a set of coupled equations which describes the simultaneous processes of heat and mass transfer. It uses well-known methods of finite differences for the spacial dimensions, and either Simpson's rule or a Runge-Kutta method in the time domain. Properties are computed at each time step from the integral equation:
tdY Y (t) = Y (t ) + to dt' d
dY
where the rates of change dt are given for each node by finite difference solution of the heat transfer relations.
The physical system is simulated by a nodal network in which each node has a heat capacity equal to that of its physical counter-part and a temperature corresponding to a gross averaged temperature in the structure. Heat flows are calculated between nodes using the values of temperature and of the thermal resistance between any two nodes.
The one-cell version of LITFIRE is shown schematically in Figure 2.1. In general, the three heat transfer mechanisms - con-duction, convection, and radiation - are allowed between nodes
when-CONCRETE WALL AMBIENT
CONTAINMENT GAS
STEEL WALL LINER EXTRA HEAT CAPACITY
(STRUCTURES)
COMBUSTION ZONE
STEEL PAN POOL
INSULATION 1 Ff STEEL
EFLOOR LINER
CONCRETE FLOOR
ever appropriate. Exceptions occur when the effect of a particular heat transfer channel is minor. For example, there is no radiation from the extraneous heat capacity node or the outermost concrete node.
2.4 Recent Changes to the LITFIRE Geometry
Most of the nodes appear in the original version of LITFIRE and can be found in reference 2. Some notable exceptions occur in the current version of LITFIRE which make the code more flexible and/or help to model the special features of the HEDL experiment.
1) The number of concrete nodes can now be varied between zero and 20, with each thickness defined by the user. Care must be taken in selecting node sizes such that
p c Fo = 5 0.3 where t k
(Ax)2
k
does not violate the minimum step size in the explicit con-duction heat transfer calculations (for t-~ 0.3 sec we need
x> 4 inches).
2) An insulated, suspended spill pan option has been added. If employed there are two insulation nodes of variable thickness and one steel pan node. If
not employed, then the lithium is spilled directly onto the floor of the steel liner.
3) An extraneous heat capacity node was added to model structures within the cell volume not
accounted for elsewhere. So far, the effect
of this node on the code results has been observed to be negligible.
4) The capability was added to represent discrete injections of gas independent of the containment flooding option for consequences mitigation. These injections were necessary in the HEDL experiment in order that the cell pressure never fell below atmos-pheric, since it was susceptible to leaking at
underpressures. The most pronounced effect of these injections is to decrease the nitrogen reaction rate due to an increased oxygen concentration (02 is usually depleted faster than N2).
5) The lithium pool currently has only one node due to its high thermal conductivity. Tests with a three-node version of the pool showed little varia-tion in temperature through the pool - less than 50C. The increased restriction on the time step due to
thinner pool nodes outweighs the increased accuracy, so the three-node pool has been abandoned.
6) The computations in LITFIRE are in British units.
added a subroutine which converts input from SI to British and then converts output back to SI before printing.
III. DESCRIPTION OF HEDL EXPERIMENT
3.1 Introduction
Our primary source of data for verifying the LITFIRE code is a series of small-scale lithium spills performed at the Hanford
Engineering Development Laboratory (HEDL) Large Sodium Fire Facility (LSFF). (5) Six different tests were performed by introducing ten kilograms of preheated liquid lithium into atmospheres of carbon dioxide, pure nitrogen, and ordinary air. Tables 3.1 and 3.2
summar-ize the important parameters characterizing each test.
The verification of LITFIRE is based upon measurements taken during each test including temperatures, gas pressure, and spill pan mass. These values were monitored continuously for a 24 hour period following the spills (although combustion was always completed in less than four hours). In addition, discrete measurements were made during and after the tests in order to determine the composition of the reaction pan, aerosol, and bulk gas.
3.2 Description of the HEDL test cell
The diagram of the LSFF (see Figs. 3.1 and 3.2) gives de-tailed information on the location of the various components of the test cell and associated instrumentation. The most conspicuous element is the steel containment vessel which measures 2.13 m in
TABLE 3.1
HEDL Test Summary
test LC-1 LN-1 LN-2 LN-3 LA-1 LA-2
species in cell gas CO2 N2 N2 N2 normal normal air air initial Li temp 0C 238 222 532 840 243 510 #peak Li temp 0
C 238 224
532 916 1001 977 initial gas temp 0C 49 38 41 46
27 43
peak gas temp 0C 48 37 49 82 102 118
TABLE 3.2
Classification of Tests
* surface reaction observed
no combustion single species multiple species
combustion combustion LC - 1 LN - 3 * LN - 1 LA - 1 * LN - 2 LA - 2
LEGEND
(
- THERMOCOUPLE - PRESSURE @ - GAS SAMPLE ARGON LELIVERYL~II~j
C
-o T TYPICAL .- AERCSOL SAMPLING ._- -_ REACTION -STATION - PANI
BACKUP CATCH PAN LITHIUM TRANSFER TANKHEDL 7811-073.9
Fig. 3.1
Schematic of Lithium-Atmosphere Reaction Test Equipment
Arrangement.
MOVIE CAMERA LOAD 0-0 JCELL I0
I
uI vZ U CD LO S U z c 0 uoQu U 3 0 u-Ii E 0) (cN -QN EEN..c
CV)I 0 C)% 0~ xJ E 0 0l to,diameter, 3.7 m high, 8 mm thick, with a volume of 14.1 m3 -5
approximately 5.6 x 10 as big as the UWMAK-III containment. The steel vessel is free to convect and radiate energy directly to the ambient, which in this case is a brick room with a volume of
approxi-3 mately 150 m
Inside the cell hangs a steel spill pan which contains the burning lithium. The spill pan is 50 cm x 40 cm x 25 cm high. It is encased in another tightly fitting steel pan which has heating elements attached to it for preheating the pan. The entire spill pan apparatus is encased on five sides with 7.6 cm of ceramic
insula-ting fiber and suspended by chains to a height of about 60 cm above the floor.
The lithium delivery system consists of a storage tank and a long, insulated 1.8 cm inner diameter delivery tube, both capable of being preheated for each test. The outlet nozzle of the delivery line extends to just above the pan lip. This close proximity to the pool surface, combined with the relatively slow transfer rate ensured that very little spray fire existed. For our comparisons, we assumed no spray fire at all.
3.3 Description of the HEDL Test Procedure
For each of the six tests, the experimental procedure was the same. Before transferring the lithium from the transfer tank
into the spill pan, the cell was filled with the appropriate atmos-phere and the lithium, delivery line, and spill pan were all pre-heated. This preheating was sufficient to guard against unwanted freezing of the lithium. However, as the temperature profiles illustrate, there are still aspects of a transient response present which appear similar to that of a real accident. (Even though we
are not comparing directly with reactor-size spills, there are some effects like these which can give us some limited insight.)
After transferring the contents of the holding tank, thermo-couples monitored temperatures at various locations in the vessel for the remainder of the test. Five were placed in the center of the pool, supported by a vertical rod. Three were placed in contact with the spill pan, two in the bulk gas - one at.6 ft. and one at 12 ft. - and one thermocouple was placed in contact with the steel vessel 6 ft. up. In addition, a pressure gauge at 5 ft. measured the cell pressure, and the load cell kept track of the total mass of the reaction pan and its contents.
During some of the tests, gases of the same composition as the original charge had to be injected in order to maintain a controlled atmosphere. This is a result of the leakiness of the containment vessel at sub-atmospheric pressures. Any errors due to this pro-cedure have been eliminated by incorporating discrete gas injections
into LITFIRE. Other than these injections, the atmosphere was con-tained within the cell throughout the entire test.
Post-test analysis of the spill pan and aerosol composition helped to identify which reactions had been present and how much aerosol was formed. In addition, grab samples taken during the tests were analyzed in order to determine the cell gas composition. Unfor-tunately, these measurements are not sufficiently detailed except to get a rough estimate of the reaction rates as a function of time, temperature, and oxygen concentration. It is quite difficult to unravel the combined effects which drive the reaction rate unless a well-controlled experiment is designed for that specific purpose.
3.4 Modelling of the HEDL Experiment in LITFIRE
The difficulties encountered in modelling the HEDL tests are noteworthy not just because of the sheer amount of work expended to solve them, but because they shed much light on the interpretation of the results of the verification study which follows. There are
important limitations on the accuracy of the modelling, with which we should be acquainted. Furthermore, since the ultimate goal of our study involves reactor concepts, we should appreciate the applica-bility of the results when extrapolated to much different sizes and geometries. In the following, we classify these points into two
sections: (1) changes in the LITFIRE model to accommodate the REDL experiment, and (2) difficulties which could not be incorporated into the model.
3.4.1 Geometric Considerations
a) scaling
It is obvious from Figure 3.1 that the LSFF does not corres-pond precisely with the geometry of a fusion reactor containment. The small size alone should forwarn us that some effects relating to the physical dimensions may be either ignored or overemphasized. For example, a reactor-sized containment has a much smaller wall surface area to volume ratio. This has the same effect as insulating the cell, since less heat is conducted out this channel. Another scal-ing effect which might take place concerns the very important pare-meter of gas emissivity. The path length of radiation to the walls from the combustion zone scales as the radius, r, whereas aerosol
2 (production rate _
accumulation scales as h/r ( t 3r Then at reactor
volume 3
r
sizes we might expect less heating of the gas due to radiation. As we shall see, radiation heating can be the dominant effect on the cell gas.
b) concrete
Another important geometric consideration is that the LSFF has no concrete surrounding the vessel. In the HEDL experiment, this enhances the rate at which energy reaches the ambient, keeping the
cell cool and underpressurized. It is much less likely in a reactor containment that underpressures will be encountered unless active cooling is performed on the cell gas.
c) suspended pan
The presence of an insulated spill pan removes conduct-ion as an avenue of heat transfer out of the pool. This absence heightens the effects of radiation and convection supporting the scaling effect of the gas emissivity. It also keeps the spill localized and deep. The depth of the pool (10 cm) affects all heat transfer mechanisms since all depend linearly upon surface area. The
deeper pan delays the extinguishment of the fire and softens some of the transient effects.
d) Extraneous Structures
Besides the spill pan, there are various elements in the HEDL test cell such as: the load cell, delivery line, backup catch pan, chains, and flanges. Actually this is not much different than a reactor containment, where there are numerous extraneous heat sinks dispersed throughout the room. These structures will tend to hold down the gas temperature and give extra inertia to the response.
The modelling of an extra heat capacity node, as well as the suspended spill pan and no concrete options have all been incorporated into the LITFIRE model as described in Chapter II. Therefore, we don't expect these elements to add any innaccuracy to the comparisons
with the HEDL data. However, it deserves to be reiterated that with the reactor in mind as our ultimate concern, these differences will tend to make our conclusions somewhat less applicable.
3.4.2 Idealization in the LITFIRE Model
There is another class of diffitulties which could not be incorporated into the model; they deal with imprecision and the effects of idealizing a rather complex system into a few simplified nodes. The net effect of all the uncertainties is to limit the
accu-racy of the code, even if all the modelling assumptions are exactly correct, which they are not.
a) Node Shapes
LITFIRE is essentially one dimensional in that the shapes of the various nodes are ignored. The phenomena most affected by geometry is convection, however radiation from the spill pan
is also affected. In order to surmount the difficulty with convec-tion, most nodes are given their own heat transfer correlation co-efficient "C" in
Nu = C (Gr Pr)
This allows the programmer some flexibility in dealing with irregular surfaces, enclosure effects, and other non-ideal conditions. For example, the HEDL containment vessel rests on cement blocks high enough to allow ventilation, but much too close to the ground to assume normal free convection from a horizontal surface. A first
order correction would be to simply reduce the constant C to some smaller value.
The presence of the spill pan complicates the process of gas convection in the containment. But it also makes
the radiation view factors more inexact. For simplicity, we assume that the pan sides and bottom radiate only to the cell floor; the pool radiates only to the cell wall and ceiling. In addition, because the pan is so close to the floor
(
2 ft.), we assume no absorption in the gas due to the pan sides and bottom. (see Figure 3.3)b) Node Sizes
The large node sizes in LITFIRE introduce a sizeable error due to temperature variations in that element. This problem is
especially large in the reaction pan, cell gas, and insulation nodes. For instance, the HEDL data shows for test LA-2 a 75 *C variation in the pan steel (out of 900 *C) at 2 hours into the test, and about 5 *C (out of 100 *C) variation in the cell gas. Across the
insulation LITFIRE predicts temperature drops of over 500 0C. The effect on convection and radiation from the insulation can be sub-stantial unless the outer node is kept quite thin. If future experi-ments are analyzed with an insulated spill pan, it would be worth the
effort to add one or two nodes in the insulation.
c) Localization of Measurement
A related problem to the homogenized nodes is the fact that measurements are localized to a single point. Therefore, the error
Assume: The pool radiates only to the walls The pan radiates only to the floor
on any given comparison with measurement is limited to at least the variation through that element. This problem is bounded unlike the node structure problem where each time step is based upon the results of the previous one.
d) inexact properties
Many aspects of the lithium combustion add small errors which may or may not accumulate. If they do accumulate, they would add
to the uncertainty in the results above, beyond the
idealiza-tions and simplifying assumpidealiza-tions already made. For most properties in LITFIRE (thermal conductivities,, heat capacities, densities, emissivities) standard reference values are used, assuming that the test cell is constructed of standard materials. Properties of materials are most critical when they are near the combustion zone, since in that event they can affect the combustion rate extensively.
In addition to the semi-static properties, there are properties in the bulk pool and on the surface which can never be exactly
modelled simply because of the complexity of the exact processes. These include non-uniform product accumulation, wicking, non-uniform emissivities, etc. They account for much of the uncertainty in the reaction rate calculation.
4.1 Introduction
The tests performed at HEDL can be classified into three areas for the purpose of analysis and comparison in this report. These are:
(1) tests which did not ignite (LC-1, LN-1, LN-2), (2) tests which ignited in nitrogen only (LN-3), and (3) tests which ignited in normal air
(LA-1, LA-2). This categorization is very helpful in separating out individual effects which are in general strongly coupled.
The results of the comparisons helped to improve LITFIRE in two distinct areas. First, studying the differences between the predicted behavior and the experimental behavior motivated additions and changes
to the model itself. Secondly, "best estimates" for the many adjustable parameters in LITFIRE (the fine tuning knobs) were obtained for these small-scale spills.
In the discussion which follows in this chapter, both of these aspects of the comparisons are described in some detail. The ordering of the text is chronologically similar to the way in which the data was actually analyzed. This should give the reader some flavor of the coupled nature of the processes in LITFIRE and the way our solutions converged to their present values through several iterations of changes. Plots are contained in the appendix which give an appreciation for the
emphasized when viewing these, that the error in making a "blind prediction" is likely to be higher than our observed errors having the results
already in hand.
Adequate verification of LITFIRE depends upon the accuracy with which it predicts the containment response of tests like those performed at HEDL. In order to define the containment response, we looked for the critical areas in the structures and in the pool. The appended plots were chosen as the appropriate basis, including:
1) cell gas temperatures
2) steel vessel wall temperature
3) spill pan and/or lithium pool temperature
It can be shown that the cell gas pressure is primarily a function of the gas temperature (and a weaker function of the gas consumption rate), therefore the pressure is not used in our comparisons. Nevertheless, peak gas pressure is an important number for the reactor designer, so we should pay some respect before putting the issue to rest.
The HEDL tests which we analyzed showed a trend for the pressure to monotonically drop during combustion. This is a direct result of the geometry, i.e. large vessel surface area to volume ratio and no concrete insulation. It indicates that the combined effects of atmosphere depletion due to combustion and efficient cooling are sufficient to prevent
overpressurization. However, our case studies of larger, concrete-covered containments indicate that overpressurization is still a problem
Besides temperatures and pressures, a complete verification of LITFIRE would have to include measurements of the reaction rates which form the source term. For LN-3, this is extracted readily from the reaction pan mass measurement. However, for LA-1 and LA-2 the effects of mutliple species combustion are somewhat more difficult to extract. For LA-2, we were able to compute the multiple species reaction rates from the HEDL oxygen concentration measurement; however, our results are in conflict with the reaction pan mass measurement and are therefore
subject to doubt. For LA-1 we are lacking a pressure measurement, therefore no analysis was attempted for this test.
4.2 Tests with No Combustion 4.2.1 Overview
In these tests with no source term, the system simply responds
passively to an initial disturbance away from equilibrium. This response is well-characterized in terms of heat transfer relations such as:
convection q = h A (T1 - T2) Newton's Law of Cooling (4.1)
h (Gr, Pr) Heat Transfer Coefficient dT
conduction q k A Fourier's Conduction Equation (4.2)
k (T) Thermal Conductivity
radiation q = a A (T1- T2) Stephan-Boltzman Law (4.3)
The predictions of LITFIRE are generally quite good for these tests. The lithium temperature profiles differ somewhat in LN-1 and LN-2 due to an initial surface reaction which is quickly extinguished. The fire dies presumably because of the temperature dependence of the reaction rate and to some extent the buildup of a protective product layer.
The cell gas and steel vessel temperature profiles are modelled less accurately than the lithium pool; however, this is primarily due to the smaller absolute changes in temperature which occurred. The low heat capacity atmosphere is particularly susceptible to small variations in the nodes around it ( Cp ~ 7 BTU/ *F for the atmosphere, Cp ~ 420 BTU/*F
for the steel vessel). In addition, the steel vessel is sensitive to the ambient temperature and to the precise value for the ambient heat transfer coefficient. For these runs, absolute magnitude is a fairer comparison
than percent difference. We expect that most of the errors observed for low temperature, non-ignited spills will not be important in the higher temperature spills.
Our experience with the no combustion tests has identified the following areas of sensitivity: exact knowledge of physical properties and test
4.2.2 Physical Properties and Test Conditions
Both static and dynamic properties can have noticeable effects in the no-combustion runs. Static properties such as steel conductivity and emissivity are in principle obtainable to very high accuracy. In order to maximize the accuracy of LITFIRE, attention should be paid to using reliable values - within one or two percent. After all, the quality of the output can never exceed the quality of the input.
Dynamic properties, such as gas emissivity and pool surface properties become much more important than static properties when combustion takes place. They can vary over a range much wider than the uncertainty in static properties. Unexpectedly, the importance of dynamic properties was first observed in a no-combustion test. The pool temperature
profile from LN-2 suggested that a change in pool emissivity due to the small surface reaction substantially affected the radiation heat transfer. Using a value of 0.6 for the emissivity, we obtained excellent agreement with the experimental data (see Figure 4.1). We now compute this
property in LITFIRE as a function of time, assuming that a 2 mm layer of product completely covers the metallic lithium. The emissivity changes gradually from 0.2 to 0.9.
Precise test conditions are not always a source of concern, but in the no-combustion runs they stand out as did the sensitivity to static properties. The most notable example is the ambient temperature, which
C LI LA C)) C)C 4-W 00 *l Ci a 4 C\J kD0-o C Ln 0 LDiL S4- -) C) I..-U 0j(a( 4- 7 Li - ) SE C)
/C
C)a C)J 0-L Do3bnifVd~dW3i
was assumed to be elevated 5 *C greater than normal in order to match the experimental results for LC-1 and LN-1. Extrapolating to larger, higher temperature spills, this type of uncertainty should disappear into the background.
4.2.3 Non-Ideal Geometrical Effects and the Determination of Heat Transfer Coefficients
Some of the processes modelled by LITFIRE require qualitative decisions and to some extent unsupported judgement. Rather than suppress that fact, we have tried to identify these areas and help the user to think about them by requiring input to the code. These "fine tuning knobs" allow flexibility in treating various heat transfer parameters, and when used properly will increase the accuracy of the code.
The best example of this is the coefficient on convection correlations for the various structures, given by
Nu = C Ra'/ (44)
By making C a user defined variable, the code can adapt to unusually shaped surfaces and the complicated enclosure effect. We suggest using the following values for C:
pool surface 0.12 ± .01 vertical surface inside enclosure 0.11 ± .01 vertical surface outside enclosure 0.07 ± .01 oddly shaped components inside enclosure 0.09 ± .01
We arrived at these values by trying to match all of the HEDL tests with the same consistent set of coefficients.
Transient natural convection is another geometry dependent effect which LITFIRE addresses. It is representative of a whole class of similar
phenomena which reflect the fact that the oversimplified node structure of the model causes elements to respond to transients immediately and as a single entity. For solid elements, our strategy has been to use node sizes as small as possible without increasing the execution time due to either extra computations or a smaller time step. In the case of natural convection, we have added an exponential time constant to the heat and mass transfer coefficients which damps their response to abrupt changes.
The value of this time constant is to be specified by the user. Torrance and Rockett(6) suggest a correlation for the time to achieve a constant energy input rate in a cylindrical enclosure:
Fo =12
for 4x10⁴
- Gr : 4x101 0
where Fo = (A) (Ax)2
Fo = -'rG_
By using approximate values of a, the thermal diffusivity, and Gr=gMTL3
Gr = g2L we extract
t(sec) = 110 L(ft) (4.6)
This time is very short compared to the length of the burn. However,
we have continued to use this time constant with values up to 100 seconds
to help smooth out the initial tendency for the combustion rate to
overshoot. In other words, we have found time constants like this
useful in controlling numerical instability as well as in modelling the
physical phenomena.
4.3 Nitrogen Combustion
4.3.1 Overview
When combustion is taking place, the area of emphasis shifts to the
so-called combustion zone, shown schematically in Figure 4.2. The principal
mode for heat transfer in high temperature ignited runs is radiation,
rather than convection. This case is therefore more useful in defining
the dynamics of the combustion zone as well as the response of the
9 bulk gas
combustion zone film region
lithium pco
previous form current form 22i 225 625 1025 2 5 65 1625 another possibility
I
225 625 1025 Temperature 'CFigure 4.3 Nitrogen Reaction Rate Curves (See Text for Explanation) Reaction
Our analysis of the LN-3 test motivated changes in the nitrogen
reaction rate curve, the combustion zone emissivity, the composition of the film region, and the radiation circuit diagram. Furthermore, the gas
emissivity was identified as a potential problem area.
4.3.2 Temperature Dependence of Nitrogen Reaction Rate Curve
The dependence of the nitrogen reaction rate on temperature (shown in Figure 4.3) reflects the fact that no combustion occurs below the melting point of lithium or above the point where the change in Gibb's
free energy reverses sign - near 1027C. The peak in the curve is fixed by assuming that at some point there is no hindrance and all available nitrogen combines as fast as it can reach the combustion zone. The observations from LN-2 and LN-3 suggested that the parabolic form needed to be altered to the new shape as shown in Figure 4.3.
The absence of ignition for LN-2 at a pool temperature of 530*C
led to lowering the reaction rate at that temperature such that convection and radiation cooled the pool faster than combustion heated it (see
calculations, p A5 of appendix). On the other end, rapid combustion near the thermochemical cutoff during LN-3 suggested that the entire curve should be pushed up in temperature. The new curve generated by these two operations is not uniquely defined; future efforts in this
used in these calculations remains to be seen. We have switched from using the combustion zone temperature to using the average between the combustion zone and pool temperatures, thereby raising the reaction rate. Since the combustion zone can be over 200*C hotter than the pool, this distinction has a serious impact.
The new reaction rate curve emphasizes a pathological property of tests in pure nitrogen caused by the steep slope in the high temperature regime. The fire shows a tendency to burn freely, heating the pool rapidly until the thermochemical limit is reached. This limit is generally
easier to reach than the radiation heat transfer limit (i.e. where
radiation balances heat production) because of the low cutoff temperature. So in most cases the temperature of the combustion zone finds itself
very near 1027*C, where the reaction rate is extremely sensitive to the precise value of temperature. One result of this is that large
oscillations usually occur in the combustion rate and time step as a result of small temperature changes. In addition, the length of the burn can change considerably if the code can find a way to alter the
combustion zone temperature slightly. In other words, small variations in parameters can drastically affect the results.
4.3.3 Combustion Zone and Film Properties
In our early comparisons it became clear that changing the reaction rate alone could not generate lithium temperatures high enough to match
those observed experimentally. Furthermore, allowing faster combustion was only pushing the gas temperature further away from the observed values. The problem was eventually identified as poor coupling between
the combustion zone and the pool - too much heat was being sent up to the cell gas and steel vessel, and too little to the pool.
A combination of two changes helped to drastically alter the
temperature profiles: the film conductivity was increased to allow more conduction to the pool, and the combustion zone emissivity was reduced from 0.5 to 0.1 or less. These changes force heat down through the conduction channel as opposed to the radiation channel which generally sends most of the heat upwards (unless the pool emissivity is 1, in which case approximately equal parts radiate up and down).
Both of these modifications can be justified in terms of credible assumptions. The composition of the film region was changed from pure nitrogen to a mixture of nitrogen and lithium vapor. This thermal
conductivity is then obtained from a pressure weighted mean using
the known vapor pressure of lithium. This gives roughly the same order of magnitude in the high temperature range (above 15000K), but a
sizeable enhancement at lower temperatures (typical peak pool temperatures are % 1000*C). Unlike most vapors, lithium shows an
Lowering of the combustion zone emissivity is in direct disagreement with the previous assumption that the flames are luminous and therefore opaque grey bodies. The assumption of luminescence is based upon the
existence of macroscopic product aerosols which effectively block the line of sight from the pool. However, if one assumes that the combustion zone is very thin, as we do, then one cannot simply conclude that the combustion zone is optically thick.
Like most vapors, lithium emits primarily at its discrete rotational/vibrational lines, most of which lie between 6708 and
0
2302 A. Away from these lines the vapor is essentially transparent. Ignoring for the moment the reaction products, if the combustion zone emits only at characteristic lines, then the pool should be strongly absorbing at those same lines. This implies that the combustion zone should couple well with the pool, but not necessarily with the gas. In fact, the narrow range of frequencies that are excited should lead to a fairly low averaged emissivity.
LITFIRE currently allows the user to select both the combustion zone emissivity, Ecz, and the transmissivity, Tcz, to pool radiation individually. We advise the use of low values for ccz (A .1) and fairly high values for Tcz (Q .5). By allowing a finite transmission through the combustion zone, we had to rederive the pool radiative interchange
factors based on the circuit diagram in Figure 4.4. The new heat transfer relations are as follows:
4.1 0 0 0 0 -,-I I S 0 4-1 .74 1 0
~3
0 P4 W 0.0 N - 0 0. 0. t4 E-4 411 -r4 r4 0 -10 co 04 C, F4 -4-4w 0.3 0 N NtAp a (Tp4
-Tg4)
(pool to gas) Qp-g = -ep + 1 (4.7)
£p TzegFpg
Ap a (Tp4 -Tw4
)
(pool to wall)
Qp.-
= + A-Esp +p (l T (4.8)Cp E~w Aw (1-6g)TzFpw 48
where Tz is not necessarily equal to (1-6z). In general, Tz 5 (l-ez).
Given the importance of radiation from the combustion zone, this area deserves more detailed study, particularly in defining the correct values for 6z and Tz. Figure 4.5 compares LITFIRE results before and after the increased coupling between the combustion zone and the pool. The latter profiles include lithium radiational cooling as detailed above, which tends to work against the coupling.
4.3.4 Mass Transport to the Combustion Zone
Based upon the observation of violent churning in the pool as well as the fact that gases are being consumed in the combustion zone, one might expect more turbulence in that region - therefore more heat and mass transfer. In fact, the vacuum left when nitrogen is solidified
into Li3N is a driving term not even considered in the LITFIRE model. This suction effect might explain the initial speed of the reaction not predicted by our model. Keep in mind though, that the temperature dependent hindrance factor on nitrogen combustion could also explain
REACTION PAN TEMPERATURE LITFIRE EMCZ = 0.1 HEDL LITFIRE EMCZ = 0.5 2000 4000 TIME (seconds)
CELL GAS TEMPERATURE
2000
TIME (seconds)
4000
Figure 4.5 Effect of Changing the Combustion Zone Emissivity and Film Conductivity
1000-0 LuJ LuJ
C
120
100-4
0 LU I-Q_ M: Lu 60-40
0
LITFIRE EMCZ = 0.5 LITFIRE EMCZ =0.1 HEDL,' 800-.600-80 -f
away the discrepancy. One of the central ideas on which LITFIRE has been based is that the reaction rate is controlled by convection
according to the assumption that mass diffusivity and thermal diffusivity are equal (see Figure 4.6 and also see reference 2 for discussion of mass transport).
In addition to the initial speed of the reaction, after 2000 seconds the actual rate was suppressed below the prediction, presumably due to product formation. A theory which is consistent with both of these
observations has been advanced by Ostroushko, et al.(1 0) It is postulated that the kinetics of the lithium-nitrogen reaction are expressed very satisfactorily by the "topochemical reaction of Kolmogorov and Erofeev":
a 1 - exp(-ktn) (4.9)
where
a
is the extent of the reaction. Glancing at the experimental data confirms that the proper form is indeed roughly exponential. More work on defining k and n, as well as the coupling of this theory with theories of oxygen combustion is needed. The present estimates of the current model are a principal limitation on the accuracy of the code.A good first guess at the problem could be formulated by multiplying the old calculation of reaction rate by an enhancement factor e and an exponential decay factor (1-a):
C:) I Lfn C) CD CD C) 00 1-S Lo O-C) LU 0 00 (0 CD, CD) CD) c
~C)
I i LL I-w -C) C:) 0 C) LL C)Y C) C) 0 0l) I - -~ LI) C=) C14 (N, LU LU C)LU-ew = E Rmold (1 -a) (4.10)
where a = f Rnew dt
N
and N is a normalization factor to keep a between zero and one.
4.3.5 Cell Gas Emissivity
In order to keep the cell gas from becoming unreasonably hot, we were forced to keep the gas emissivity below 0.05. After implementing the new model for the combustion zone and film described in Section 4.3.3, the effect of varying EMG has been substantially reduced. Nevertheless, since the cell gas temperature is one of the most important numbers generated it will be necessary to develop a reasonably accurate model to predict the dynamics of aerosol generation and removal. The model currently releases a fraction of the combustion products into aerosol, but has no mechanism for removal.
Figure 4.7 shows the sensitivity of the cell gas temperature using 0.1 for the combustion zone emissivity. When full species combustion is approached, a much larger amount of aerosol will be generated, making radiation to the gas an even more important effect. More discussion of this will appear in the following section.
1204. 1104 0.2 0.1 .04 .02 1004 90-- 80-1-I
i
i i i 2000 3000 4000 5000 60-5 0J 1000 6000 Time (seconds)LN-3 Sensitivity of Gas Temperature to Gas Emissivity, E .
Q 0 0) I-. 0) 0) I I Figure 4.7
4.4 Multiple Species Combustion
4.4.1 Overview
Because tests with multiple species combustion are ignited runs, the emphasis is still on the combustion zone and radiant heat transfer.
Many of the effects present with LA-1 and LA-2 were already observed for LN-3. The most notable added feature is multiple species
combustion kinetics.
Through analysis of the nitrogen tests, it is possible to establish
- qualitatively if not quantitatively - the effect of temperature on the nitrogen reaction rate. The primary obstacle to defining this was the possible inapplicability of Reynolds's analogy for the
mass transport. With oxygen now present, the effect of oxygen
concentration on the nitrogen combustion rate must be included as welli as both the effects of temperature and of nitrogen concentration on the oxygen combustion rate. These complications make it extremely difficult
to infer precise relationships from our limited sample of data. If we further add in the fact that the oxygen concentration was not monitored continuously, and for LA-1 there is no pressure data avilable, then it becomes clear that only qualitative statements are justified in our analysis.
As observed at HEDL, the smoke generated during lithium-air
combustion is mostly Li2
0,
some LIOH, and virtually no Li3N. Therefore,unlike nitrogen tests, the gas emissivity changes a great deal throughout the fire. The net result on cell gas temperature and pressure is a more pronounced effect; therefore serious consideration must be given to aerosol transport and kinetics. The nature of this topic is very complex, but the crudeness of the modelling currently in LITFIRE allows us sizeable gains even for small investments of effort. Observing the LA-i and LA-2 profiles in the appendix, we note that LITFIRE is conservative in
its estimates. So at worst we will have an upper bound which is quite acceptable. As we shall see, after remodelling the combustion zone and film region the sensitivity to gas emissivity has been reduced.
4.4.2 Some Observations on Lithium-Air Reaction Kinetics
In order to investigate the accuracy with which LITFIRE predicts combustion rates, experimentally inferred values had to be developed from the available data. Two different (independent) techniques were attempted: one involves simply differentiating the load cell output to form a gas consumption rate, the other requires application of the ideal gas law
PV = nRT (4.11)
to the profiles of temperature and pressure. Figure 4.8 points out the fact that these two methods are in disagreement with one another. However,
Table 4.1
LA-2 Reaction Rate Calculation
time pressure temp. (seconds) 0 120 240 420 600 1200 1-800 3600 5400 mPa .123 .124 .120 .112 .112 315.8 322.5 335.3 372.0 383.3 moles 02 132.2 130.5 118.4 77.1 28.4
moles ~2 rate N2 rate
moles 02 rate N2 rate
N2 moles/hr moles/hr 482.4 472.7 443.6 408.1 427.6 25.65 121.2 123.9 61.75 145.35 291.1 106.4 29.33
[note: 62.5 moles were added at 4400 seconds]
N2 combustion rate Kg Li/hr m2 HEDL LITFIRE 30.27 60.64 22.17 6.10 6.74 27.88 1.80 0.0 0.0 17.77 02 combustion rate Kg Li/hr m2 HEDL LITFIRE 3.56 16.84 17.19 8.59 0.50 27.15 27.68 21.04 4.93 3.82 % 02 pool temp. OC 21.35 21.1 18.45 11.12 5.19 304 699 999 982 860 time (seconds) 120 420 1200 3600 8220
> co 0 C) U7)) r-.. ;M CD I-4 . LL-0 U0 L. 0 C) U) c -eH C0 00 C) u LU C> C C) C) LU a-o~ -C) CD CD C o- co 110I LO) .C
~)
ej CDPAi)
ssvw
if either of them is an accurate representation then we have further evidence that LITFIRE underpredicts the reaction rates. The reason for this underprediction could stem from an error in the mass diffusion calculation or from an error in the temperature and oxygen concentration dependences of the nitrogen reaction rate curve. The comparison shown in Figure 4.9 for the oxygen concentration profiles tends to support this latter conclusion. The higher values of oxygen concentration measured experimentally imnly that nitrogen is not being consumed fast enough in relation to oxygen.
There are two credible explanations for this effect. Both depend upon an accurate definition of the temperature and oxygen
concentration at the exact location where reactants combine. Since oxygen is not hindered from reacting the way nitrogen is, it can be presumed that the combustion zone is an oxygen-poor environment compared to the bulk gas. In calculating the nitrogen reaction rate versus oxygen concentration, the bulk values for 02 and N2 masses are used. This leads to over-predicting the oxygen concentration, and thus lower values of the nitrogen reaction rate.
The other possible explanation involves the large temperature gradient which exists between the combustion zone and cell gas, and also between the combustion zone and pool. If some combustion occurs outside the boundary of our idealized, infinitely thin combustion zone
node, then the true temperature at the reaction site is not nearly so high as predicted. Because of the steepness of the nitrogen reaction rate
C~J 0 E Luj IL-U, C 0 U, C0 Lu ai 0 C:) 0: C-) a)I 4C. -J 0 o4-) S.-CC co C) C C) C) to cu u a.' -t S.-= 0.' LL C) ("I 0~ C) C) C0 -o
I
j -JL LuL 1-Icurve, even small gradients could be very important. Intuitively, we might well expect that the integrity of the combustion zone boundary
is not strictly upheld. Turbulent bursts of cool air are likely to mix with the flames, giving rise to combustion at lower temperatures
- therefore higher nitrogen reaction rates.
Although the oxygen concentration data gives compelling evidence of miscalculating the hindrance factor for nitrogen combustion, it should be remembered that the mass diffusion calculation is still in doubt. In fact, LA-2 was even more surprising than LN-3 because the measured oxygen combustion rate was initially faster than we thought possible assuming mass to be transported in accordance with Reynolds's analogy. Unlike LN-3, where the hindrance factors could be changed to account for the difference, for LA-2 there are no hindrance factors operating on oxygen. Therefore, the
underprediction of oxygen combustion can only be due to low predicted mass diffusion rates.
4.4.3 Gas Emissivity Calculation
After making the changes to the combustion zone and film region described in Section 4.3.3, the impact of the gas emissivity was substantially reduced (see Figure 4.10). Nevertheless, this area
w 4-J C) C) C *r* u 0 4-) P., -J C; C) C4-J C-) rq I' u wc En Q) Cd 0 C It u C4 * H C) oa Cu w -H CC LIn 0C