HAL Id: tel-03117138
https://hal.archives-ouvertes.fr/tel-03117138v2
Submitted on 3 May 2021
HAL is a multi-disciplinary open access archive for the deposit and dissemination of sci-entific research documents, whether they are pub-lished or not. The documents may come from teaching and research institutions in France or abroad, or from public or private research centers.
L’archive ouverte pluridisciplinaire HAL, est destinée au dépôt et à la diffusion de documents scientifiques de niveau recherche, publiés ou non, émanant des établissements d’enseignement et de recherche français ou étrangers, des laboratoires publics ou privés.
Self-organization of silver nanoparticles with
femtosecond laser in TiO2 matrix : Applications to
plasmonic colours, multiple hidden images and Colour
Image-Multiplexing
Nipun Sharma
To cite this version:
Nipun Sharma. Self-organization of silver nanoparticles with femtosecond laser in TiO2 matrix : Applications to plasmonic colours, multiple hidden images and Colour Image-Multiplexing. Optics [physics.optics]. Université de Lyon, 2020. English. �NNT : 2020LYSES032�. �tel-03117138v2�
N° d’ordre NNT : 2020LYSES032
THESE de DOCTORAT DE L’UNIVERSITE DE LYON
opérée au sein de
Laboratoire Hubert Curien Ecole Doctorale N° 488
Science Ingénierie Santé
Spécialité de doctorat : Optique, Photonique
Discipline : Matériaux pour l'optique Soutenue publiquement 21/10/2020 par :
Nipun SHARMA
Self-organization of silver nanoparticles
with femtosecond laser in TiO
2matrix:
Applications to plasmonic colours, multiple hidden images
and Colour Image-Multiplexing
Devant le jury composé de :
TREGUER-DELAPIERRE Mona Professeur des Universités, Université de Bordeaux Rapporteure
SOPPERA Olivier Directeur de recherche CNRS, IS2M, Mulhouse Rapporteur
GROSSO David Professeur des Universités, Université Aix-Marseille Président
SIEGEL Jan Faculty Research Scientist, Instituto de Óptica, CSIC Examinateur
OUERDANE Youcef Professeur des Universités, Université Jean Monnet Examinateur
DESTOUCHES Nathalie Professeur des Universités, Université Jean Monnet Directrice de thèse
i
ACKNOWLEDGEMENT
As I pen down the acknowledgement of my thesis, I would first and foremost thank my thesis supervisor Professor Nathalie Destouches, who accepted me in her Ph.D. Program at Laboratoire Hubert Curien (LabHC) five years back. She has been one of the amazing research supervisors I have worked under till now and her quest for research, makes you learn and exploit new things. I would also like to thank my co-supervisor Professor Guy Vitrant, who hired me for this thesis. Although, interactions with him were less during this time due to different field of research, his suggestions have always been useful.
Secondly, I would like to acknowledge ANR Region Auvergne Rhone-Alpes for funding the three years of my thesis from September 2015 up to September 2018. Further, the experiments, conferences related to this thesis for the three years were funded by LABEX MANUTECH-SISE 10-LABX-0075) of Université de Lyon, within the program Investissements d’Avenir (ANR-11-IDEX-0007). The prolongation of the thesis for four months were funded by HID Global CID, France from October 2018 up to January 2019.
Further, I would like to acknowledge Professor Youcef Ouerdane, for his immense support on this thesis at most of the times and ofcourse at coffee breaks. Then, I would also thank Professor Francis Vocanson who supported me in the chemistry part of the thesis.
Moving on, chronological order of the thesis chapters, I am thankful to Dr. Hongfeng Mark for his support on the theoretical coding in the chapter II, Dr. Thomas Bottein and Professor David Grosso for the ellipsometric measurements, followed by Dr. Matthieu Bugnet for all the TEM measurements performed in this thesis. Further thanks to Dr. Camilo Florian and Scientist Jan Siegel for an amazing collaborative work and laser processing at their Institute. Thanks to Dr.
Marie Vangheluwe for her support in the first half of my thesis and her collaborative work in the thesis related to laser processing in chapter IV.
Thanks to Stéphanie Reynaud, Yaya Lefkir, and Jean-Yves Michalon for their support in the characterization trainings and thesis related assistance. I would also like to thank all the researchers, engineers, technicians and support staff of the LabHC who helped me directly, indirectly through the period of the thesis.
A warm thanks to the group Nanoparticules, including Christophe, Zeming, Nicolas, Balint, for their support in the thesis and discussions in coffee and lunch breaks.
A big thank to HID Global CID and my manager Stéphane Ayala and ex-colleague Alice Vermeulin for hiring me before my thesis and having a belief that I can fit to the current role in the company while giving me space to complete the thesis parallel with the job.
At last, I would like to thank my parents, my wife Ambika and brother who supported me in tough times. This would not have been possible without you guys.
iii
ABSTRACT
Self-organization of metallic nanoparticles in a medium is an efficient and a low-cost way to produce plasmonic systems that can be used for applications to active colour display, image encoding, and security. Such nanocomposite systems must be synthesized in form of stable films which could be coated on any kind of surface for laser processing. This doctoral thesis focuses on laser‐induced self‐organization of nanocomposite thin films of silver and mesoporous titania.
In this work, we first investigate synthesizing mesoporous TiO2 thin films using hydrolytic process,
which is easy to implement, to provide crystallized films starting at 100°C. First activation energies in mesoporous TiO2 films using Raman spectroscopy in combination with the phonon
quantum confinement model are reported in this work. Further, growth mechanisms of nanocrystals in mesoporous TiO2 films are investigated in form of ellipsometric measurements
highlighting its effect on film porosity and crystallinity with annealing temperature.
The second study demonstrates fabrication of different nanocomposite structures using femtosecond laser scanning technique, triggering growth and self-organization of silver nanoparticles inside porous amorphous titania matrix giving rise to plasmonic dichroic colours. Further investigation on the parametric study of such nanocomposites gives rise to different nanostructures at two different scan speed regimes, which are formed at the surface and are embedded below due to excitation of surface and the guided modes. The flexibility of this laser-based marking technology also allows to fabricate hybrid nanostructures composed of different adjacent nanostructure types, interlaced to cover large areas. An extension of this study is concluded on plastic/flexible substrates to encode diffractive printed images. Here surface nanostructures (LIPSS) are formed by using the control of laser polarization and thus grating orientation, which is used to encode grey-level images that can be observed in diffraction modes.
Further, this study is concluded by producing three image multiplexing which can be observed in three selected modes of observation under white light in reflection with non-polarized light and transmission between polarizers for two different polarization angles. This is due to the fact that the film birefringence and dichroism can be controlled to produce unprecedented colour gamuts for multiplexing. Such smart laser processing on nanocomposite thin films gives rise to artistic and security applications by encoding different images up to three under same area.
v
TABLE OF CONTENT
ACKNOWLEDGMENT ... i
ABSTRACT ... iii
LIST OF SYMBOLS AND ACRONYMS ... ix
LIST OF FIGURES ... xiii
LIST OF TABLES... xix
Chapter I: INTRODUCTION
1. Overview of TiO2 Synthesis Methods and Applications ... 31.1. Mesoporous TiO2 and Thin Films: First Achievements ... 4
1.2. Coating Techniques for Thin Film Deposition ... 7
1.3. Applications to Mesoporous TiO2 Thin Films ... 8
2. Metallic Nanoparticles and Photochromic Behavior ... 9
2.1. Factors Influencing Localized Surface Plasmon Resonance (LSPR) ... 10
2.2. Photochromic Behavior ... 12
3. Self-Organization Using Continuous (cw) and Femtosecond (fs) Lasers on Nanocomposites of Ag:TiO2 ... 14
3.1. Continuous (cw) Laser ... 15
3.2. Femtosecond (fs) Laser ... 16
4. Motivation and Organization of the Thesis ... 20
Chapter II: MATERIAL SYNTHESIS
1. Introduction ... 252. Experimental Details ... 27
2.1. Materials ... 27
2.2. Initial Sol ... 27
2.3. Modifications in the Sol ... 28
2.4. TiO2 Films ... 28
3. Results and Discussion ... 29
3.1. Influence of pH and Synthesis Temperature on the Generation of Crystal Seeds ... 29
3.2. Role of Crystal Seeds on the Temperature-Induced Crystal Growth and Phase Transition ... 32
4. Optical Properties of Amorphous Mesoporous Ag:TiO2 Films ... 46
4.1. Synthesizing Ag:TiO2 Films ... 46
4.2. Photochromic Behavior of Ag:TiO2 Films ... 47
5. Conclusions ... 48
Chapter III: TAILORING NANOCOMPOSITES OF Ag:TiO
2WITH FS LASERS
1. Introduction ... 511.1. Thin Film Fabrication ... 53
1.2. Laser Setup ... 55
2. Femtosecond (fs) Irradiations on Ag:TiO2 Nanocomposite Thin Films ... 56
2.1. Scan Speed Study ... 56
2.2. Two Different Self-Organization Processes ... 59
2.3. Temperature Rise in the Nanocomposite ... 63
2.4. Optical Response in the Nanocomposite ... 65
2.5. Elimination of Spectral Anisotropy by Structuring with Circular Polarized Laser Light ... 67
2.6. Imprinting Hybrid Structures ... 69
3. Conclusions ... 71
Chapter IV: DIFFRACTIVE MULTIPLE IMAGES HIDING USING FS LASERS
ON NANOCOMPOSITE FILMS
1. Introduction ... 731.1. Thin Film Fabrication ... 75
1.2. Laser Setup ... 76
2. Parametric Study ... 77
3. Conclusions ... 89
Chapter V: IMAGE MULTIPLEXING
1. Introduction ... 912. Experimental Techniques ... 95
2.1. Thin Film Fabrication ... 95
2.2. Laser Setup ... 95
3. Conceptual Insights ... 96
3.1. Multidimensional Colours ... 96
3.2. Conditions for Multiplexing ... 97
3.3. Influence of the Printing Parameters on the Optical Properties of the Nanostructures ... 100
vii
4. Image Multiplexing ... 106
4.1. One Image (Not Multiplexing Yet) ... 106
4.2. Two-Image Multiplexing ... 107
4.3. Three-Image Multiplexing ... 109
5. Conclusions ... 117
Chapter VI: CONCLUSIONS AND PERSPECTIVES ... 119
ANNEXURE 1 ... 123
ANNEXURE 2 ... 125
REFERENCES ... 127
ix
LIST OF SYMBOLS AND ACRONYMS
A constant
a0 lattice parameter
AcAc acetyl acetone
AFM atomic Fore Microscopy
Ag silver
Ag:TiO2 silver:titania nanocomposite
Al aluminum
Au gold
B1g, Eg, A1g Raman band for crystal titania
BBO barium borate
|C(0,q)|2 phonon confinement function
CIE Commission Internationale de l'éclairage
CLI changeable laser image
CVD chemical vapor deposition
cw continuous-wave
D crystallite size
d laser beam diameter
D0 crystallite size obtained at the lowest temperature
DI deionized water
DSSCs dye synthesized solar cell
dy distance between two laser lines
d3q∝q2dq three-dimensional confinement
Ea activation energy
EBL electron beam lithography
EELS electron energy-loss spectroscopy
EEP environmental ellipsometric porosimetry
EG embedded grating
EtOH ethanol
F laser fluence
f or frep repetition rate of laser
FFT fast Fourier transform
FIB focused ion beam
fs femtosecond
HAADF high angle annular dark field
HCl hydrochloric acid
HNO3 nitric acid
HRTEM high resolution transmission electron microscopy
HS high speed
HSt hybrid structure
hν photon energy
I(ω) Raman scattering intensity
𝐼(𝛼,β, 𝜆 ) intensity transmitted under normal incidence through the dichroic sample placed between two polarizers whose axes are at α and α+β from x IUPAC International Union of Pure and Applied Chemistry
k constant
kHz kilo Hertz
kJ kilo joules
𝑘𝑆𝑃𝑃0 SPP wave vector
LIPSS laser induced periodic surface structures
LS low speed
LSPR localized surface plasmon resonance
M molar
mJ millijoules
mL milliliter
MLI multiple laser image
mW milliwatt
n grain growth exponent
𝜂 refractive index
Neff number of effective pulse of laser
NH3 ammonium hydroxide
𝜂𝑔𝑚 refractive index of the grating mode
nm nanometer
xi
P distance of the particles, periodically spaced
P123 poly(ethylene glycol)-block-poly(propylene glycol)-block-poly(ethylene glycol)
PET polyethylene terephthalate
pH potential of hydrogen
PMMA poly(methyl methacrylate)
ps picoseconds
PVD physical vapor deposition
𝜃𝜋 angle formed at plane of incidence for which diffraction occurs
𝜃𝑖 incidence angle
R’ molar gas constant
R calculated reflectance
Re(η) real part for the complex of the effective refractive index of the plasmon mode
Rh% humidity percentage
Rpm rotations per minute
SEM scanning electron microscopy
SERS surface enhanced Raman scattering
SG surface grating
SPP surface plasmon polariton
sRGB standard Red Green Blue
T calculated transmittance
𝜏 film thickness
T (K) annealing temperature in Kelvins
TE transverse electric
TEM transmission electron microscopy
TiCl4 titanium tetrachloride
TiO2 titanium dioxide
TM transverse magnetic
TTIP titanium isopropoxide
𝑡𝑥 𝑒𝑖𝜑𝑥(𝜆) and 𝑡𝑦 𝑒𝑖𝜑𝑦(𝜆) components of the complex transmittance of the film
UV ultraviolet
v laser scan speed
x integer
1-R-T losses, including absorption and diffraction
𝛬 grating period
𝛬𝐸𝐺 period of embedded grating
𝛬𝑆𝐺 period of surface grating
𝛼′ absorption coefficient
α sample rotation angle
𝛼(𝜆) polarizability
λ wavelength
λTmin wavelength at which transmission shows minimum
𝜖𝑎𝑖𝑟 dielectric function of air
𝜖𝑑 relative permittivity of the surrounding dielectric
𝜖𝑚 relative permittivity of the metal
𝜔0 zone center phonon frequency
𝜔(𝒒) dispersion relation of the phonon with the integral being performed over the entire Brillion zone
µm micrometer
Γ0 Raman linewidth at room temperature
𝛿 width of phonon dispersion curve
𝛽𝑚 propagation constant
xiii
LIST OF FIGURES
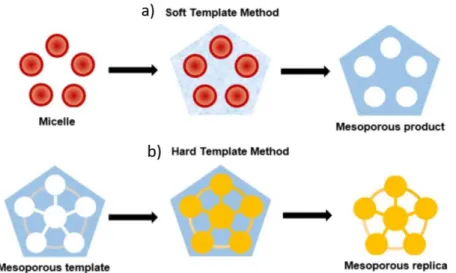
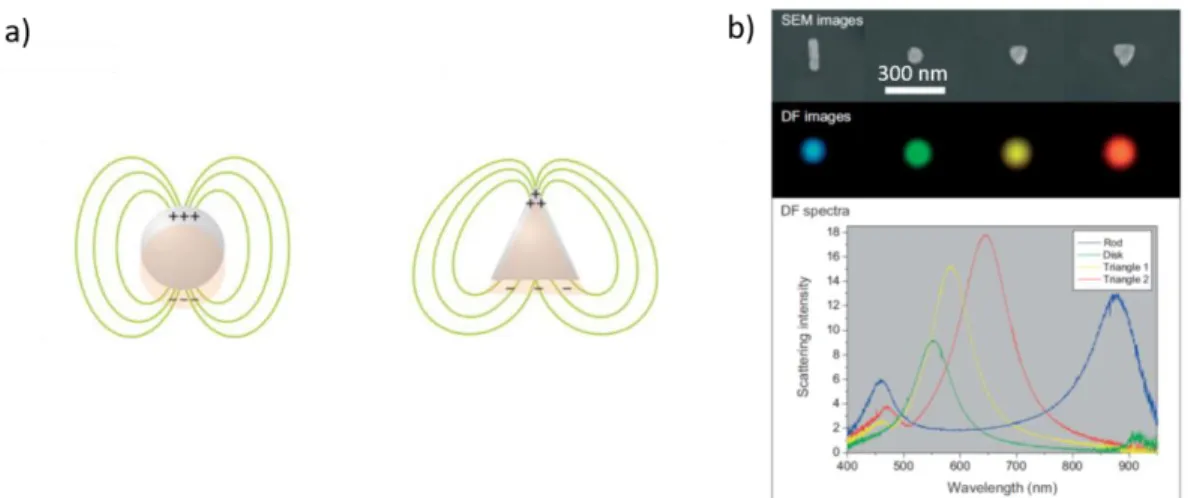
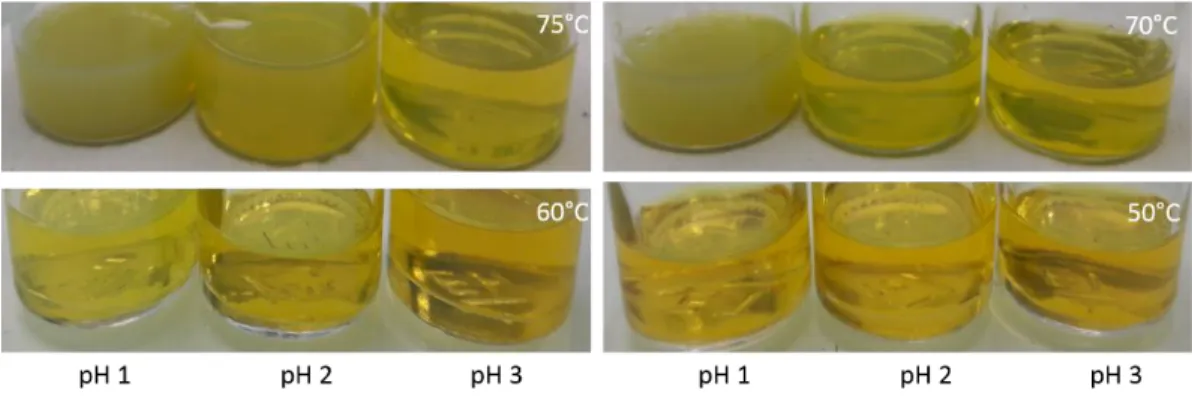
I.1. Scheme representing the methods of a) Soft templating and b) hard templating to produce mesoporous films. (Image adapted from Machado et al.)………..5 I.2. Steps involved in a) Spin and b) Dip coating techniques, generally used to coat mesoporous thin films (Image adapted from Raut et al.)………7 I.3. A schematic diagram of electron charge displacement in the metallic nanoparticle interacting with an incident plane wave………10 I.4. Schematic diagram of LSPR of nanoparticles with two different shapes of a) sphere and triangle
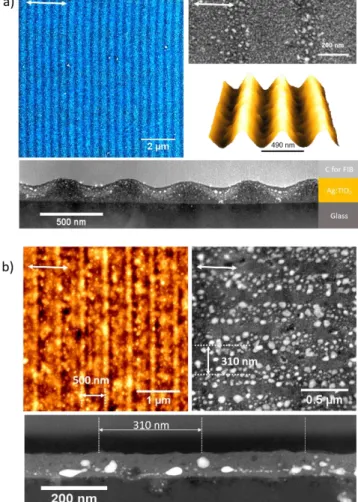
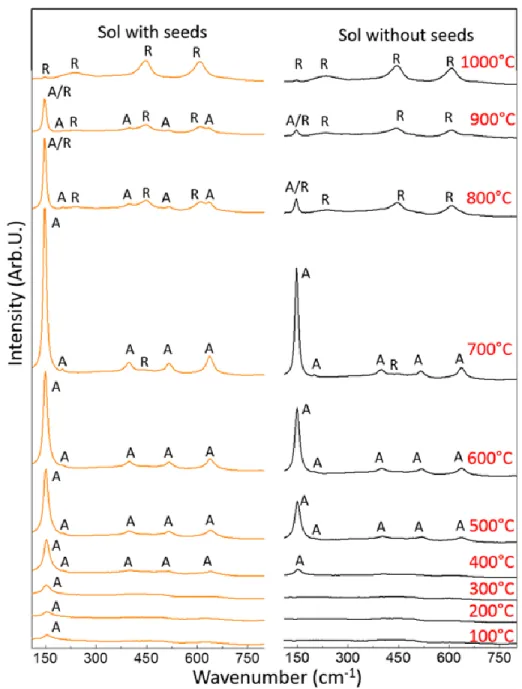
nanoparticles, with their corresponding charges distribution. Figure b) shows the LSPR shift, broadening and splitting for different nanoparticle shape. (Images adapted from Coronado et al. and Murray et al.)……….………..11 I.5. Mechanism proposed by Kawahara et al. for a) charge separation at Ag:TiO2 interface and b) electron pathway from excited silver nanoparticle to the oxygen molecule (Images adapted from Kawahara et al.)………13 I.6. Physio-chemical mechanisms leading to the growth or the shrinkage of Ag nanoparticles with a cw laser system. (Image adapted from Liu et al.)……….16 I.7. Energetic diagram of the silver metal and semiconductor interface, in this case Ag:TiO2 (Image adapted from Liu et al.)………..18 I.8. a) SEM micrograph showing a self-organized periodic surface grating when the surface wave is excited while using high speed of 100mm/s with fs laser. The corresponding images showing the AFM topography for the same followed by HAADF-STEM micrographs from the top view (top right side) and on the cross section for the HS structure. b) LS nanostructures produced while using 10 mm/s laser scan speed. AFM surface topography and HAADF-STEM top view and cross-section. The white double sided arrow in the top corner of each images, depicts the laser polarization.(Image adapted from Liu et al.)………..……….…..19 II.1. An image showing the colour change in sols when synthesized at different pH and temperatures……….30 II.2. The presence of crystal seeds is followed by the growth of Eg band of anatase TiO2 at 155 cm-1. Influence of the synthesis temperature for sol synthesized at a) pH 1. b) pH 2 and c) pH 3 respectively. A comparison of the Eg anatase band of TiO2 for the as-deposited film and the film baked at 100°C/30 minutes for the sol at pH 1 and 75°C synthesis temperature……….32 II.3. Raman spectra of films with and without seeds after calcination at various temperatures. Spectra were measured in the same conditions and are plotted using the same intensity scale. A and R locate the different bands of the anatase and rutile phases, respectively………..34 II.4. Normalized first Eg band of the anatase phase measured on films with seeds as a function of annealing temperature. b) Average anatase nanocrystal size D versus annealing temperature for the two kinds of films
calculated using a phonon-confinement model. An inset figure illustrates the accuracy of the model by showing the experimental and fitted curves of the film with seeds annealed at 400°C. c) Fits used for determining the activation energy of the crystal growth in both sample in the temperature range from 300°C to 600°C, as derived by the theoretical model relating the isothermal grain size D (nm) to the annealing temperature T (K).It’s to be noted that units of kelvin have been used for depicting activation energy here………..……….36 II.5. HRTEM image of a film with seeds annealed at 400°C showing a large amount of small anatase nanocrystals. Adjacent Image:FFT of image (a) and identification of diffraction lines of anatase TiO2. b) Cross-section of the mesoporous films without seeds. c) Selection of Raman spectra from seeded and unseeded films after annealing at 400°C, 700°C, 800°C and 1000°C and corresponding SEM images for seeded (d) and unseeded (e) film surfaces. The scale bars for all the SEM micrographs corresponds to 400 nm………40 II.6. The change in the spectral response for the films synthesized with two sols showing the possibility for the scattering effect in the films annealed above 700°C. The solid line depicts the % transmission along with the dotted line depicting % reflection for the temperatures above 700°C for a) sol without seeds and b) sol with seeds, where large opening of porosity is observed in the surface morphology of the samples. The corresponding graphs shows losses (scattering and absorption) for the seeded and unseeded films…………41 II.7. The change in the spectral response for the films synthesized with a) sol with seeds and b) sol without seeds for the films annealed at 300, 400, 500 and 600°C. The solid line depicts the transmittance along with the dotted line depicting the measured reflectance. c) The band gap calculated while extrapolating the absorption edge; calculated from the transmittance and the reflectance values for the film made with sol with seeds annealed at 600°C. d) Changes in the band gap with temperature for films with and without seeds annealed between 300 and 600°C……….43 II.8. Evolution of a) refractive index and b) thickness of films with and without seeds annealed between 300 and 600°C. c-d) Adsorption (full lines) and desorption (dotted lines) curves of films with (c) or without (d) seeds at 300, 400 and 700°C. Figures in inset show the pore size distribution extracted from the adsorption curve………..45 II.9. a) Absorption spectra for the six different films after the third cycle bleaching. b) Absorption for the three-cycle UV/bleaching for six different films measured at 515nm (laser wavelength for applications). c) Colour change of films from brown to transparent, showing the photochromic behavior of the nanocomposite films………...48 III.1. a) Transmittance (T) and reflectance (R) spectra taken at 6° incidence angle for the initial Ag:TiO2 nanocomposite films. Losses including absorption and scattering were calculated as (1-R-T). ⊥ and ∥ refers to the probe polarization, respective to the laser polarization………54 III.2. a) Schematic of a galvanometer scanner completed by a F-theta lens to perform laser scans over a large
area. Image source: OptoSigma………..………55 III.3. Illustration of the colour changes induced by scanning high repetition rate femtosecond laser pulses over the sample surface at different speeds and constant fluence. Each square is imprinted over an area of 9 mm2. Illumination was provided by a white light source for unpolarized (No pol) and horizontally/vertically polarized light (denoted by double sided arrows) and the image was recorded with a smartphone camera (a) in reflection and (b) in transmission……….56 III.4. Illustration of the evolution of the nanocomposite structure with the scan speed, characterized by their respective SEM and AFM images for a) 1 mm/s b) 20 mm/s c) 100 mm/s and d) 170 mm/s scan speeds. The embedded grating (EG) for speed v = 1 mm/s is formed parallel to the laser polarization (depicted by double
xv
side yellow arrows), whereas the surface grating (SG) at v = 100 mm/s and 170 mm/s is oriented perpendicular to the laser polarization………..57 III.5. Evolution of the period of the nanostructures that feature gratings with the scan speed. For speeds in the range v = 1 - 5 mm/s, an embedded grating (EG) is formed inside the film and its orientation is parallel to the laser polarization. For the range v = 70 – 170 mm/s, a surface grating (SG) is formed, whose orientation is perpendicular to the laser polarization………..……..…62 III.6. Randomly distributed of Ag nanoparticles at scan speed of 200 mm/s……….63 III.7. Raman spectra for the different nanostructures obtained using different scan speeds, as indicated. ‘A’ denotes the bands corresponding to the crystalline anatase phase of titania………64 III.8. Transmittance (T) and reflectance (R) spectra taken at 6° incidence angle for a) the initial Ag:TiO2
nanocomposite films before laser irradiation and different scan speeds of b) 1 mm/s, c) 20 mm/s, d) 100 mm/s, and e) 170 mm/s. Losses including absorption and scattering were calculated as (1-R-T). ⊥ and ∥ refers to the probe polarization, respective to the laser polarization………..67 III.9. Transmittance (T), reflectance (R) and loss (1-R-T) spectra for nanostructures fabricated with circular polarized laser light for two different scan speeds. a) 1 mm/s and b) 100 mm/s. For comparison, c) and d) show curves for linear polarized laser light, obtained by calculating the average value of the experimental ⊥ and ∥ curves from Fig. III.8a and III.8c. ⊥ and ∥ refers to the probe beam polarization, respective to the laser polarization. The spectra were taken at 6° incidence angle………68 III.10. Optical micrographs of a hybrid nanostructure composed of adjacent vertical scan lines, each containing a different type of nanograting. Magnified regions are shown below, the left corresponding to the EG (barely visible horizontal grating lines) and the SG (vertical grating lines). b) and c) Measured transmittance spectra of the hybrid nanostructure for both light polarizations (∥ and ⊥), compared to the corresponding spectra of areas written at single speeds, 1 and 100 mm/s……….70 III.11. Photographs of samples highlighting diffraction of white light by laser-written areas at different scan speeds corresponding to a) embedded gratings (EG) and hybrid gratings (HG) and b) surface gratings (SG) and hybrid gratings. The red arrow indicates that the sample has been rotated by 90º between (a) and (b)……71 IV.1. A schematic diagram showing the laser setup developed at Laboratoire Hubert Curien for low repetition rate laser writing. The inset shows the legend used in the illustrative diagram………..77 IV.2. Different regimes of laser-induced changes in the film nanostructure and morphology, identified with varying scan speed and laser fluence for a fixed spacing between lines of 20 µm and repetition rate at 25 kHz………..78 IV.3. SEM images showing surface topography as illustrated in Figure II parametric range (25 kHz,) for three different laser fluences of a) 124 mJ/cm2, b) 159 mJ/cm2 and 195 mJ/cm2 (SEM image in each row corresponds to the similar power as depicted) and the scan speed for 1.8, 3.08 and 10.5 mm/s, mentioned here for each column are similar for each fluence respectively………79
IV.4. Diffraction by LIPSS patterns on plastic substrate. Photographs of a sample taken under white light and different angles of observation to qualitatively highlight the variations in the diffraction efficiency with the scan speed and laser fluence……….80 IV.5. a-b) SEM images at two different locations, showing LIPSS with a period of 495 15 nm and different orientations perpendicular to the laser polarization (green double sided arrows). c) HAADF-STEM cross-section view of the LIPSS. Note that the big Ag particles (yellow arrows) appearing on the film cross cross-section were not stable under electron beam during STEM characterizations, contrary to the smaller ones d) HAADF-STEM enlarged view of the sample cross-section, with Ag nanoparticles embedded in the grooves of the LIPSS. Inset: EELS Ti L2,3 near-edge structures obtained in the region below the LIPSS groove. The red arrow highlights the shoulder at the higher-energy side of the eg peak of the L3 line, which is characteristic of the anatase TiO2 phase. The low amplitude of this shoulder compared to anatase spectra of the literature is attributed to the partial crystallization of the TiO2 as well as the instrumental resolution ( ̴1 eV)………81 IV.6. Angular ranges of LIPSS used to encode the 256 grey-levels of each image. The three raster images have been interlaced and printed on a 1.18 cm2 surface. b) Sketch of the setup used for taking photographs of the sample. This top view sketch especially shows the incidence angle 𝛉𝐢 of the white light collimated beam
and the angle 𝛉𝟏𝐠 of the first diffraction order in the plane of incidence for a green radiation at 537 nm
wavelength. c) Photographs of the sample printed on polycarbonate recorded for three different azimuthal angles obtained by rotating the sample in its plane. The three different images appear at 0°, 60° and 120°, respectively and their d) negative images at 15°, 75° and 135° angles………..84 IV.7. Photographs taken with a smartphone under ceiling lighting illustrating the reflectivity and the flexibility of the samples fabricated on flexible plastic substrate……….85 IV.8. An illustration of the pixelated technology. a) Diffraction image of human portrait on plastic substrate with an optical zoomed image showing a pixel. SEM images, showing a) two dots, representing starting points of the laser lines inside the pixel, b) a zoomed image showing separation for two laser lines inside a pixel, with LIPSS………86 IV.9. Interlaced diffractive images with same human portrait as in Figure V and a better resolution of 40 µm. Azimuthal angles a) 0°,60° and 120° displays the three positive images while their respective negative images are shown in b) at 15°, 75° and 135° angles………..……….87 IV.10. Setup for taking pictures b) A tabulated values for θi, θdand respective λ as calculated using equation 1 and
2, followed by images taken for different diffraction angles c) Multi-images illustrated at azimuthal angles of 0°, 60° and 120° revealing images of doughnut, star and a square with their respective negative images at 15°, 75° and 135° angles with angle of incidence and diffraction fixed at 55.5° and 20.5°………..88 V.1. Ag:TiO2 films deposited on four circular flexible glass. The photographs were taken after the three UV-VIS cycle………95 V.2. A concept for multidimensional colour illustrating that a single laser nanostructured pixel can generate three different colours in three different modes of observation…..………97 V.3. Conditions to satisfy image multiplexing for a) two images and b) three images. A nanostructured pixel is depicted by a black square………..98 V.4. Conditions to satisfy image multiplexing for three images. Here we use 5 colours in mode 1, while in mode 2 and 3, 2 colours are used……….99 V.5. A sketch for pixelated matrix printed with orthogonal laser parameters and observed in different modes of observation………100
xvii
V.6. When the laser printed matrix is illuminated and observed under reflection (Mode 1), it is seen that while the fluence is increased from 226 to 284 mJ/cm2, one can observe a variation in the reflective colour while, the colours for various laser polarizations (from 0° to 90°) remain the same. On the other hand, when the same matrix is illuminated under polarized transmission (Mode 2), the colour now strongly varies with the laser polarization angle but not with the fluence. Such orthogonal parameters give rise to modes that can be used for multiplexing since we get a vertical gradient in one mode and horizontal gradient in the other mode………..………102 V.7. Control of the dichroic property of the nanostructures using fs laser on Ag:TiO2 nanocomposites. The matrix
were printed with varying laser fluence and laser polarization. The image shows the matrix in reflection and under polarized transmission. SEM images for three fluence of a) 354, b) 307, and c) 249 mJ/cm2 are shown here for laser polarization 0°. The white dashed line shows the way FIB cross-section was made and the yellow double sided arrow depicts the laser polarization………104 V.8. STEM images for three fluence of a) 354, b) 307, and c) 249 mJ/cm2 shown for different laser polarization indicated with a double side yellow arrow. The images indicate a shape anisotropy and elongation of silver nanoparticles along with the direction of laser polarization, especially for 307 and 354 mJ/cm2. The STEM shows how the matrix collapses as the fluence is increased and the density of nanoparticles is decreased. While, lower fluence values of 249 mJ/cm2, shows higher density of silver nanoparticles with smaller size………105 V.9. Illustration for coloured image printing using fs laser on nanocomposite film while defining a) laser fluence as linear function of the 256 greyscale levels. b) Image printed with 256 greyscale levels as observed in reflection mode of illumination, polarized transmission for different β values and scattering mode. The scale bar in the image corresponds to 4 mm………106 V.10. Requirements for producing two image multiplexing using 256 × 256 nanostructures. The encoded image should be such that different nanostructures gives similar colour in polarized transmission and colour pallet in reflection and vice versa. b) Illustrates the colour pallet observed under different modes of reflection and polarized transmission for specific laser fluence and polarization with the corresponding printed image in modes of reflection and polarized transmission. The scale bar on the image corresponds to 4 mm…………108 V.11. Colour pallet matrix printed with different laser fluence from 226 to 284 mJ/cm2 and laser polarization 30, 60, 120, 150° respectively and observed in Reflection in Mode 1 and polarized transmission for different values of sample rotation or α in Mode 2 and 3 respectively, depicting a solution for 3-image multiplexing………110 V.12. Setup use to measure the polarized transmittance spectra. α is the angle between laser induced nanostructure oriented along the laser polarization and the polarizer axis. β is the angle between the two polarizers. The nanostructure here acts as a dichroic sample. b) The spectra data is converted to determine the CIE XYZ values which in turn displays the colour variation in the form of chromaticity diagram………...…112 V.13. a) Illustration showing setting up of neutral axis, when the sample is printed with laser polarization θ. The sample has to be rotated at α=- θ between two polarizers as to make the sample behave as if it is printed with polarization θ= 0° b) illustrates the colour variation with the rotation of angle α for a single nanostructure printed with a fluence of 249 mJ/cm2, laser polarizations along the x axis, scan speed of 7
mm/s and a dy 15 µm. The curves intersects two different values of α. The first value for α1 for which colours for 30° and 150° will be similar (red dashed rectangle) and colours of 60° - 120° will be similar (black dashed rectangle) and similar colour combination is achieved for α2 for 30° - 60° and 120° - 150° respectively………..….113 V.14. a) Requirements for producing three image multiplexing that requires a production of colour pallet with 256 × 2 × 2 nanostructures to be able to display pallets in Mode 1 for reflection and mode 2 and 3 for polarized transmission for different samples angles α and angle β……….……….115 V.15. Three images multiplexing printed with three independent images as observed under a) reflection and polarized transmission for different α angle and for a specific β angle. The matrix corresponding to each image corresponds to the variation in the laser fluence and the different laser polarization chosen for printing the encoded image. The scale bar corresponds to 4 mm for the image……….………116
xix
LIST OF TABLES
II.1. Summary of films synthesized with sols having different pH and synthesis temperature. indicates nucleation of nanocrystals, indicates amorphous phase of TiO2 and means no sample characterization due to gelification of the sol………31 II.2. Activation energies as calculated with the different values of n. The activation energy for the sol with seeds is however lower each time with respect to the activation energy for the sol without seeds, whatever the value of n is………38
1
CHAPTER I
INTRODUCTION
Since many years now there has been quest for exploiting nanomaterials for different applications. The properties of nanomaterials such as high surface energy, higher fraction of surface atoms, reduce defects, vary from the bulk materials that make them unique.1,2,3 One of
the examples of such nanomaterials include mesoporous materials i.e. the class of nanomaterials having pores ranging from 2 to 50 nm. Such materials have lower density and high surface areas. Their properties are not just governed by the arrangement of the atoms within the crystal but also by the pore size and its surface area. Further, investigations for exploiting the pore size, phase, synthesis temperature and the structure has been carried out for applications to solar cells, sensors, membranes, optoelectronics and others, but still a need of exploring the world of such mesoporous nanostructures is present. Research of new mesostructured and mesoporous materials has become important over the last 25 years.4,5,6
Such mesoporous materials also act as host matrices to grow metallic nanoparticles within them. They are emerging as a new class of optical materials. These nanocomposite materials are characterized by the localized surface plasmon resonance (LSPR) phenomenon exhibiting absorption in the ultraviolet/visible region. LSPR is a collective oscillation of electrons in the conduction band of metallic nanoparticles, which is excited by the incoming electric field of the incident light. This behavior is directly related to the shape of the nanoparticles, their size, nature, inter-particle distance and the dielectric permittivity of the host environment.7,8,9 Metallic
nanoparticles have been used in for different applications, the oldest being used as a colourizing agent when dispersed inside a host matrix. A famous example of such response from the past, is the well-known Lycurgus Cup which exhibits dichroic colours due to the presence of gold (Au) and silver (Ag) nanoparticles.10 Metallic nanoparticles exhibit colours due to light absorption and
scattering in the visible region due to their plasmon resonances. Two of the most studied plasmonic metals for such behavior are Ag and Au as they exhibit the LSPR in the visible thus being used in many applications including colours, biosensors, surface enhanced Raman scattering (SERS) applications, and others.11,12,13
Metallic nanoparticles are important in fabricating nanocomposite materials with different optical properties when high intensity light is interacted with them. In the past, lasers have been used to alter the optical response of the nanocomposites either by tuning the individual characteristics of the nanoparticle or by producing nanoparticles gratings. While inducing the deformation of Ag in glass, Kaempfe et al. were able to produce permanent dichroic colour changes inside the glass.14 Seifert et al. showed that Au/Ag nanoparticles in glass can be
transformed to anisotropic shapes along the laser polarization direction to design optical properties of metal glass nanocomposites.15 While for latter cases, where the optical response of
nanocomposite materials can also be tuned both by varying features of the periodic structure and changing the morphology of the individual nanoparticle, Loeschner et al. showed femtosecond (fs) induced laser grating like structure and nanoparticle anisotropy inside polymer films giving rise to optical dichroism.16 Other ways of altering the optical response of the
composite systems can be using lasers to grow or self-organize nanoparticles inside dielectric titanium dioxide (TiO2) thin films with embedded nanoparticles. A recent example of which was
shown by our group ‘Nanoparticules’ using continuous-wave (cw) and fs laser on nanocomposites of Ag:TiO2. Here while nucleation, growth and self-organization was observed using cw laser, a
double self-organization was observed while using fs laser system giving rise to permanent dichroic colours.17,18 Such laser induced nanocomposites can be used to encode colour pattern
by taking advantage of its dichroic nature. This motivates us in studying the nanostructures that can be fabricated combining nanocomposite mesoporous thin films of Ag:TiO2 and fs lasers and
further explore the applications that these nanostructures can pave for applications towards encoding information. Further, structuring of metallic nanoparticles inside the crystallized and amorphous thin films of TiO2 starting from low temperatures can potentially improve the
3
photocatalytic performance of potentially fabricated laser induced nanocomposites on such films due to field trapping in the self-organized gratings.
The thesis completely revolves around mesoporous TiO2 that is the principal matrix used in the
thesis. In the first part, we explore the chemistry of mesoporous crystalized TiO2 thin films while
working at lower synthesis temperatures followed by studying light interaction of a fs laser system with nanoparticle composite films made of Ag:TiO2 to control and self-organize
nanoparticles within the oxidize films in the second part of the thesis. Further investigations show the practical applications of such nanostructures fabricated for multiple image hiding on plastic substrates and image multiplexing with fs laser systems.
1. Overview of TiO
2Synthesis Methods and Applications
Since the commercial production of TiO2 after 1920, it is one of the most exploited
semiconductor. In 1972, Fujishima and Honda first discovered the photocatalytic splitting of water on electrodes of TiO2 under ultraviolet (UV) light.19 Since then enormous efforts have been
put to research on TiO2 material, leading to many practical applications including photovoltaics,
photocatalysis, pigments, waveguides and sensors.20,21,22,23,24 TiO
2 exists in three different
polymorphs apart from its amorphous phase known as anatase, rutile and brookite where, the formation of the amorphous TiO2 starts at room temperature until 350°C . All the three
polymorphs are built from the TiO6 octahedra where, the anatase structure is built from the edge
sharing TiO6 octahedra, and the other two polymorphs are built from both edge and corning
sharing of the TiO6 octahedra.25,26 Moreover from various synthesis procedures of TiO2 including
sol-gel, physical vapor deposition (PVD), chemical vapor deposition (CVD) and hydrothermal, the transformation of amorphous to anatase phase usually occurs first at 350-400°C, due to ease of arrangement of short range TiO6 octahedral into long range order anatase structure, this can be
due to less constrained molecular construction of anatase as compared to rutile.27 A pure anatase
transition temperature can vary up to 1200°C depending upon the type of synthesis precursors and route chosen.27 Usually anatase and rutile are the two common polymorphs of TiO
2 and its
third polymorph, i.e its brookite phase is usually obtained at around 500-600°C as a bi-product along with its other two polymorphs when synthesized under an ambient synthesis condition.26
The vast applications of amorphous and different polymorphs of TiO2 being used as pigments in
paints, cosmetics, polymers is due to their high refractive index in the visible range and its strong absorption in the ultraviolet range, especially in its anatase and rutile forms which also result in high reflectivity at its surface.27 It has been studied that while the refractive index of amorphous
TiO2 is around 2.4, the refractive index values for the anatase varies from 2.5 ~ 2.6 and further
rutile phase possesses a higher refractive index values of around 2.6 ~ 3 (wavelength (λ) corresponding to 546 -550 nm).28,29 Further, due to its high dielectric constant, high transparency
in the visible region TiO2 has also been used in different optical applications. It has been used as
micro ring resonators and waveguides.30 Other works have showed that TiO
2 can be used as
anti-reflector on infrared detectors, thanks to the low refractive index values of TiO2 nanorods at
wavelengths greater than 2 µm.31 Further, the other applications of TiO
2 has been in the area of
photocatalysis due to its deep valence band and the tendency of the photon-generated holes to locate at the surface of the material, thus making it as an oxidant agent. Also, the oxygen vacancy of TiO2 and its n-type semiconductor behavior makes it good candidate for sensors including gas,
optical, electric, and biosensor.32 Thus, when the gases are absorbed on the surface of TiO 2 they
lead to a change in its resistance. All these applications and the ease of fabrication of TiO2 makes
it an interesting material to investigate for further applications too.
1.1 Mesoporous TiO
2and Thin Films: First Achievements
According to the definition of ‘The International Union of Pure and Applied Chemistry’ (IUPAC), porous solids are classified into three categories according to the diameter size of the pores: micropores (< 2 nm), mesopores (2-50 nm), and macropores (> 50 nm). Porous materials are of great interest due to their capacity of interacting with ions, molecules, atoms and nanoparticles not just on the surface but throughout the bulk of the porous material as a result
5
of which the porous materials enhance their physical, and chemical properties and hence their potential applications. In early 90’s scientists first reported a new family of mesoporous silicate denoted as M 41, before which such porous features were not recognizable due to lack of analysis techniques.33 After this work, a quest of investigating new porous materials began, especially
metal oxides, due to their tunable pore size, shape, volume, and composition. The first ever synthesis of hexagonal packed mesoporous TiO2 was in print in the year 1995 by Antonelli et al.
using sol-gel route.34. When compared to bulk TiO
2, the mesoporous TiO2 is advantageous due to
a higher surface area, and the possibility of diffusion of reactants over the surface, and further an increase in the density of the active sites hence making it interesting candidate over bulk TiO2.35 Such mesoporous materials are usually synthesized by two approaches, i.e. hard or soft
templating routes (Figure I.1).36 In hard templating synthesis routes the nanostructures are
formed on the surface of the template. The templates are then removed via different physical and chemical methods thus generating pores. The other method used vastly, due to ease of fabrication is the soft templating route. It involves use of organic or polymeric surfactant which assembles into supermolecular structures, which involve co-assembly of the precursors (metal oxides, polymers, silica, etc). Such assemblies are then used as soft templates to tune pores.37
Figure I.1: Scheme representing the methods of a) Soft templating and b) hard templating to produce mesoporous films. (Image adapted from Machado et al.)36
Besides these templating methods, other methods can also produce mesoporous TiO2, but with
disordered structures. A perspective of synthesizing mesoporous TiO2 thin films is by combining
sol-gel along with soft templating technique or self-assembly process. A sol-gel is generated by two terms: sol, which consists of the liquid, and gel, which consists of a three dimensional network. The sol-gel process consists of an inorganic precursor or organic metal precursor along with an amphiphilic organic template. After this, the precursor and the organic template are mixed in a solvent in presence of an acid. The complete reactions take place under water. The final solution is then deposited with the help of different coating techniques such as spin-coating, dip-coating or slot die. The different coating techniques can offer different homogeneity and the choice for the coating technique generally depends upon the final application of the films. After the coating process, a thermal treatment is usually required to eliminate the organic template and release the porosity to obtain mesoporous TiO2 thin films. In order to maximize the utility of
such TiO2 mesoporous materials, it is essential to synthesize them in form of thin films.
In 2001, three different research groups published back-to-back works on mesoporous TiO2 thin
films. Grosso et al. produced optical thin films of mesoporous TiO2, synthesized using titanium
tetrachloride (TiCl4) as the inorganic precursor and F 127 and Brij 58 as the structuring template.
The films were obtained at temperature of 350°C, with porosity ranging from 20 to 45%.38
Further, Hwang at al. used a different four step synthesis process to obtain mesoporous TiO2
films using nanoparticles of TiO2.39 Their four-step process comprises the synthesis of TiO2
nanoparticles using TiCl4 as a precursor and then blending these synthesized nanoparticles with
template molecules of Brij di-block copolymer into the film followed by ageing and calcination process. The third published research in the same year used different synthesis precursors and templates. Yun et al. synthesized hexagonally packed TiO2 mesoporous films under acidic
conditions using titanium isopropoxide (TTIP) as the precursor and poly(ethylene glycol)-block-poly(propylene glycol)-block-poly(ethylene glycol), i.e. P123, as pore generating agent.40 The
mesoporous films were obtained after heating at 300°C. After this year, research on synthesizing mesoporous films began. Such mesoporous thin films of TiO2 have proven their worth in the
7
applicative research areas when compared to the bulk mesoporous TiO2 as discussed above, due
to instability of the nanopowders, and agglomeration over time for practical applications.
1.2 Coating Techniques for Thin Film Deposition
Two main types of coating techniques namely spin and dip coating techniques have been used in this thesis to deposit thin films of mesoporous TiO2, before the post heat treatment as
explained in the above section. Although such techniques are well-known a small introduction will give users a background of these two important techniques for thin film deposition. Spin coating requires a flat substrate (dimensions up to centimeter in length or diameter) for coating a solution. The substrate is stacked over the spinner with the help of vacuum and the coating solution is put homogenously over the substrate. The spinner is rotated at a specific angular speed, thus allowing the coating solution to spread homogeneously over the top surface due to centrifugal force acting due to the rotation (Figure I.2).41 Generally the film thickness can be
controlled by the speed of the spinner (in rotations per minute (rpm)), viscosity of the liquid used and the evaporation rate of the liquid which in turn depends upon the vapor pressure, local humidity, and temperature of the surrounding.42 Generally, thickness of around 1 µm or less can
be achieved with such coating technique.
Figure I.2: Steps involved in a) Spin and b) Dip coating techniques, generally used to coat mesoporous thin films (Image adapted from Raut et al.)41
On the other hand, dip coating requires a flat and cylindrical substrate which is immersed in a coating solution vertically or with an angle and then is withdrawn upwards with a constant speed, thus resulting in thin film coating which is deposited on both sides of the substrate. The formation of the thin film occurs at the time of withdrawal where the substrate is retracted. It is when the evaporation of the coating solution takes place and part of the coating solution is stuck to the substrate. The thickness in this case is also dependent on the viscosity of the coating solution. The other factors which play a role on the film thickness are the withdrawal speed, fluid density and fluid surface tension as predicted by model proposed by Landau and Levich. Although, improvement in this model proposed by Faustini et al. showed that the film thickness also depends upon the evaporation rate of the sol used and the substrate width.43 When comparing
the two techniques, dip coating is developed for large-scale film production and has an advantage for incorporation to roll to roll processing and also for small batch experiments.
1.3 Applications to Mesoporous TiO
2Thin Films
This section gives an overview and the advantages of the porous TiO2 in different
applications. TiO2 thin films with larger surface areas, and controllable pore sizes have been
studied for applications to solar-cells, photocatalysis, sensors, lithium ion batteries, waveguides and for micro inscription using lasers due to their stability over time.44,45,46,47,48,49 A typical dye
synthesized solar cell (DSSCs) contains a dye-adsorbed TiO2 layer deposited on conductive oxide
glass. A porous TiO2 permits the dye specific concentration to be high for the absorption of the
incident light and also provides accessibility to hole transporter, a thumb rule for efficient solar energy conversion in case of a typical DSSCs. Tuning the pore volume, Granados et al. synthesized mesoporous TiO2 films with varying thickness and demonstrated that a combination of higher
porosity and higher thickness gave the largest photocurrent density and hence the best photovoltaic performance when compared to the films with lower porosity and thicknesses.50
Further, TiO2 has been a great candidate for applications to photocatalysis. For a photocatalytic
reaction, light with greater energy than the band gap of semiconductor should be absorbed on the surface of the semiconductor, thus creating electron-hole pairs, and simulating oxidation and reduction reactions. For this purpose, mesoporous TiO2 becomes an interesting candidate, with
9
higher surface areas. However, since TiO2 alone shows a poor absorption in the visible range,
efforts have been made to dope it with noble metals, non-metal anions and metal cations, thus enhancing absorption in the visible region and hence promoting the photocatalytic activity.37
Further, such TiO2 mesoporous thin films have also shown their worth as sensors due to higher
surface areas, pore volumes and carrier diffusion length. When the TiO2 mesoporous films are
exposed to gases, the gas molecules are bound onto the surface of the pores, resulting in a chemical reaction and generating electrical signals.51 Such mesoporous films also possess
advantage over bulk TiO2 acting as potential electrodes for lithium ion batteries, used in
day-to-day life. The pores in the TiO2 give a higher surface area to the material and a shorter diffusion
pathway for electrons and lithium ions.47 Further, one of the interesting properties of such
mesoporous TiO2 thin films in terms of this thesis is that, such films can also be used as reservoir
for metallic ions, which results in high ionic mobility for such metallic ions. As the thesis, is principally based on nanocomposite of Ag:TiO2, it is now important to give an overview of the
optical phenomena happening around when laser are used with such nanocomposites.
2. Metallic Nanoparticles and Photochromic Behavior
Particles within the range of 1-100 nm, known as nanoparticles, show some fascinating properties. When an electromagnetic wave is trapped at a metal-dielectric interface on a metal surface, it is termed as surface plasmon polariton (SPP). Surface plasmons possess specific characteristic due to the oscillation of conduction electrons upon excitation of the incident light. Surface plasmon confined on the surface of metallic nanoparticles exhibit what is named LSPR as describe above. This collective oscillation of the free electrons (Figure I.3) causes a large resonant enhancement of the local field around the nanoparticle. This phenomenon, is widely used in SERS,52 optical tweezers,53 and optical devices.54
The resonance frequency of the oscillations as discussed in the introduction depends upon the dielectric properties of the metal, surrounding medium and other factors like the shape and size of the nanoparticles. Faraday showed that metal particles with different sizes and shapes exhibit different colours. Further in 1908, Mie theory suggested a general solution for single sphere interacting with electromagnetic radiation by solving the Maxwell equations.55 The other
important developments or models in this field included that of the effective medium theory and dipole approximations.56,57
2.1 Factors Influencing Localized Surface Plasmon Resonance (LSPR)
The surface plasmon resonance is not only influenced by the nature of the nanoparticle, but also by the environment of the host matrix. Once the effective polarizability of the free electrons is affected, the plasmon resonance is also affected. When the particle is smaller than the wavelength of light, the polarizability α(λ) can be simplified as:7,58
𝛼(𝜆) = 4𝜋𝑟3 𝜀𝑚− 𝜀𝑑
𝜀𝑚+ 2𝜀𝑑 (Eq. I.1)
where 𝜀𝑚 is the relative permittivity of the metal, 𝜀𝑑 is the relative permittivity of the surrounding
dielectric. Further, it is known that the 𝜀𝑚 of the metal depends on the wavelength and the LSPR
occurs when 𝜀𝑚 = − 2𝜀𝑑. Thus the response of the plasmon is sensitive to the local
environment, i.e. a change in the value of 𝜀𝑑 alters the value of 𝜀𝑚 for which resonance occurs
(𝜀𝑚 = − 2𝜀𝑑). For bulk glass, the refractive index (𝜂) is generally around 1.5 and hence the 𝜀𝑑 =
𝜂2 = 2.25. As a result, in case of glass, the resonance condition is satisfied when, 𝜀𝑚 = −2𝜀𝑑 =
−4.45. For Ag nanoparticles, this occurs at 420 nm; whereas, for other noble metals like Au it Figure I.3: A schematic diagram of electron charge displacement in the metallic nanoparticle interacting with an incident plane wave.
11
occurs at 520 nm.7 Other works from Rivera et al. also showed that the resonance frequency for
Au and Ag nanoparticles differed when the 𝜂 of host matrix was changed from 𝜂=1 to 𝜂=2. The shift in the LSPR corresponded to 78.5 nm for Ag nanoparticles, whereas a shift of 54.1 nm was observed for the Au nanoparticles for the two different host matrices.59
While the surrounding matrix is dominant for LSPR shift for smaller nanoparticles, for larger particles above 10 nm, the effects due to the amplitude and phase of the electromagnetic field around the particles become important thus resulting in size and shape dependency of the plasmon resonance. As the nanoparticle size is increased, there is an increase in the absorption and scattering, thus affecting the optical extinction of the nanoparticles. Further, the size-increase scattering dominates the absorption in the optical extinction thus shifting the plasmon resonance response.7 Moreover, a change in the shape produces different surface charge (Figure
I.4). While for the sphere or rods, the distribution of the surface charges is homogeneous, it becomes complex when the nanoparticle shape changes. An example of such particle is triangular nanoparticle where the charges are localized on one tip and one base of the prism. In such cases Figure I.4: Schematic diagram of LSPR of nanoparticles with two different shapes of a) sphere and triangle nanoparticles, with their corresponding charges distribution. Figure b) shows the LSPR shift, broadening and splitting for different nanoparticle shape. (Images adapted from Coronado et al.60 and Murray et al.7)
the resonances can be described in terms of hybridization between the plasmon modes of different structural components of the nanoparticles. While different shapes of the nanoparticles from rod, sphere to triangle fabricated using electron beam lithography (EBL) has showed a huge shift and splitting in the LSPR.7,60 Further works from Mock et al. showed the effect of both the
shape and size on the respective LSPR of the nanoparticles.8 Here the authors investigated that
they were able to shift the LSPR of the spherical silver nanoparticles from 400 nm, to 550 nm for pentagon silver nanoparticles and up to 700 nm for triangular silver nanoparticles. Such tuning of the LSPR with shape, size and medium as discussed firstly gives rise to various applications including near-field optical microscopy, nanosensors, and others.61,62
2.2 Photochromic Behavior
Photochromic behavior is defined as light induced reversible change of colour. The word photochromic is derived from Greek, where ‘Phos’ depicts the light and ‘Chroma’ means colour. In 1867, photochromism, first came into print when Fritzsche found that the colour of a tetracene solution from initial orange faded when kept in sunlight. Further, when the solution was again kept in dark it regained its orange colour.63 This research expanded applications to photochromic
glasses and photochromic micro-images where a book consisting of 1245 pages was reduced to 6 cm2, but photodegrading of the organic photochromes limited the practical applications then.
As this work also deals with photochromic Ag:TiO2 thin films in some parts, this section discusses
the mechanism behind the photochromic behavior of the Ag:TiO2 nanocomposites, giving users
a background. It is known that when a metallic nanoparticle integrated with a host semiconductor is photo-excited due to plasmon resonance, then charge separation occurs by the transfer of the photo-excited electrons from the metallic nanoparticle to the conduction band of the semiconductor, passing through the Schottky junction formed at the metal/semiconductor interface (Figure I.5a).64,65
13
In case of Ag:TiO2 nanocomposites, under UV light irradiation the Ag ions are converted into Ag
nanoparticles, due to the photocatalytic activity of the TiO2 matrix; the Ag nanoparticle grows
due to the LSPR of the nanoparticle. The film at this point is brownish in colour. Now if the same film is irradiated by a monochromatic white light, the excited electrons at the silver surface absorb the white light, thus the electrons which are excited are transferred to the oxygen and hence the Ag nanoparticle oxidizes to Ag ions. Now due to the oxidation, only light of incoming wavelength is reflected or transmitted, and the rest is absorbed by the remaining particles thus showing the colour on the nanocomposite films of the respective excited wavelength.66 Further,
the UV light reduces the Ag ions to nanoparticles, due to the photocatalytic activity of TiO2.
Such Ag nanocomposites can be synthesized using different protocols inside and with TiO2 porous
or nonporous matrix in its different phase of amorphous, anatase and rutile. Ohko et al. investigated reduction of Ag ions into Ag nanoparticles using UV light irradiation inside TiO2
anatase films synthesized using sintering techniques.67. Such nanocomposites of Ag:TiO
2 were
also prepared by Crespo-Monteiro et al. where the authors synthesized amorphous TiO2 matrix
using sol-gel and then reduction of Ag ions into nanoparticles inside such matrix was performed using a continuous UV laser.68 Although, such growth of nanoparticles inside the pores is reduced
Figure I.5: a) Mechanism proposed by Kawahara et al. for a) charge separation at Ag:TiO2 interface and b) electron pathway from excited silver nanoparticle to the oxygen molecule (Images adapted from Kawahara et al.65).
when using lasers. The authors overcame this issue by thermally growing silver nanoparticles in such TiO2 amorphous mesoporous matrix using heating of TiO2 matrix with Ag ions at 200°C in
air.49 Further, Bois et al. also showed how Ag nanoparticles can be grown in TiO
2 mesoporous
template using ammonical silver solution and its chemical reduction using ammonium hydroxide (NH3), followed by a thermal treatment at 100°C.69
Due to photochromic behavior of Ag:TiO2 nanocomposite films, the nanocomposites are unstable
over time and may change the nanoparticle content (size, density) inside the film over time or in other words the colour stability for the films. To have reproducible results on such films, it is vital to make such films stable over time. Our group showed the stability of such films by demonstrating the repeatable ability of photochromic behavior of such nanocomposites coated on glass by exposing them to laser induced reduction (244 nm) followed by laser induced oxidation (488 nm), six times. The bleached films, regain their brown colour under UV exposure and absorption was similarly restored to its original value even after six cycles of UV-visible depicting colour stability of the films under ambient light.70 Further, Fanny et al. showed the
photochromic stability of the Ag:TiO2 nanocomposites coated on plastic substrates using
UV-visible light exposure. The photochromic properties were showed to be in good contrast for coloured and colourless state for five different cycles, demonstrating a good reproducibility.71
3. Self-Organization Using Continuous (cw) and Femtosecond (fs) Lasers on
Nanocomposites of Ag:TiO
2The change in behavior of the nanoparticles dispersed in a host matrix after laser exposure is known since few years now. The nanoparticles after laser irradiation can grow, oxidize or self-organize themselves inside a host matrix. Such fundamentals become vital to understand before discussing the experimental results and applications discussed in this thesis work. This section will mainly revolve around the work carried out by our group in recent years.
15
3.1 Continuous (cw) Laser
The first self-organized arrays of nanoparticles with a cw laser was reported in the year 2014 by our group.72 Here, a thin mesoporous film of TiO
2 acting as a waveguide of around 200
nm was produced via a sol-gel chemistry on a glass substrate. The film acts as a waveguide, and high refractive index of TiO2 becomes essential in such laser processes. The initial films are
impregnated with Ag ions, which are converted to small Ag nanoparticles, thanks to the photocatalytic activity of TiO2. Thus, the initial Ag:TiO2 films contain Ag ions, atoms and
nanoparticles as suggested by Liu et al.73 For the growth of Ag nanoparticles using cw laser, high
atomic and ionic mobility must be reached, which is favored by the low density of the mesoporous films. The laser driven growth of nanoparticles is a two-step process where silver ions are firstly reduced to silver atoms by reduction reaction, and growth mechanisms that increase the size of the nanoparticles either by adsorption of Ag atoms to nanoparticles according to Ostwald ripening or by coalescence of nanoparticles, the whole being controlled by plasmon induced temperature rise.74 Oxidation occurs whatever the laser intensity, while the nanoparticle
growth becomes significant above a certain threshold temperature (Figure I.6).75 Above an
intensity threshold leading to temperature rise, for certain laser parameters including power, speed, and wavelength, the laser writing gives rise to buried self-organized arrays of Ag nanoparticles where the embedded grating are always parallel to the laser polarization.76
The optical origin of self-organization arises from the fact that a part of the field scattered by the nanoparticles is trapped inside the waveguide. The particles which are periodically spaced by a distance P = 𝛽2𝜋
𝑚, where 𝛽𝑚 is the propagation constant of the guided mode, can then excite the
guided mode.72 These guided waves thus interfere with the incident beam, giving rise to an
intensity modulation and further nanoparticle evolution. Thus, embedded self-organization with a cw laser occurs with grating lines parallel to the incident laser polarization.
Further studies by Baraldi et al. with cw lasers showed a polarization driven 1-D and 2-D self-organization.76 Here, a 2-D organization was obtained via two different methods. The first
method involves a two consecutive laser writing process with cross polarizations. As discussed above, the porous structures play an important role; the author takes care that the porosity is not destroyed completely after the first laser writing. The porous structure provides the ionic and atomic mobility for the growth of the nanoparticles for the second consecutive laser writing along with that, the presence of the adsorbed oxygen in this scenario is responsible for oxidation to occur. While the second approach uses a single scan illumination consisting of a circularly polarized light thus giving rise to a 2-D hexagonal structure.
With the self-organization of silver nanoparticles with the cw laser system being discussed now, it is important to give an introduction to the nanoparticle growth and self-organization processes using femtosecond (fs) laser systems, recently developed within the team.
3.2 Femtosecond (fs) Laser
Unlike a cw laser system, a pulsed laser system confines the optical energy into a short span of time (10-15 seconds) and leads to a very short interaction of light with matter and
transient response of the atoms and molecules.77 It is also known that the pulsed laser generates
less temperature rise than cw lasers. Theoretically, Baffou et al. showed that for nanoparticles of Figure I.6: Physio-chemical mechanisms leading to the growth or the shrinkage of Ag nanoparticles with a cw laser system. (Image adapted from Liu et al.)75