HAL Id: halshs-01943306
https://halshs.archives-ouvertes.fr/halshs-01943306
Preprint submitted on 3 Dec 2018HAL is a multi-disciplinary open access archive for the deposit and dissemination of sci-entific research documents, whether they are pub-lished or not. The documents may come from teaching and research institutions in France or abroad, or from public or private research centers.
L’archive ouverte pluridisciplinaire HAL, est destinée au dépôt et à la diffusion de documents scientifiques de niveau recherche, publiés ou non, émanant des établissements d’enseignement et de recherche français ou étrangers, des laboratoires publics ou privés.
Distributed under a Creative Commons Attribution - NonCommercial - ShareAlike| 4.0
Developments in Well-Being at Work in Japan
Louise Baudrand, César Castellvi, Nao Kinoshita, Adrienne Sala, Sebastien
Lechevalier
To cite this version:
Louise Baudrand, César Castellvi, Nao Kinoshita, Adrienne Sala, Sebastien Lechevalier. Developments in Well-Being at Work in Japan: A Survey and a Comparison with France. 2018. �halshs-01943306�
Center for French-Japanese Advanced Studies in Paris (CEAFJP)
CENTER FOR FRENCH-JAPANESE ADVANCED STUDIES IN PARIS
CEAFJP DISCUSSION PAPER #18-05
Developments in Well-Being at Work in Japan
A Survey and a Comparison with France
Louise Baudrand
EHESS
César Castellvi
EHESS
Nao Kinoshita
EHESS
Adrienne Sala
Sciences Po Lyon
Sébastien Lechevalier
EHESS, Fondation France-Japon de l’EHESS
November 2018
C
EA
FJ
P D
IS
C
U
SS
IO
N
P
A
PE
R
#1
8-0
5
CEAFJP Discussion Paper Series #18-05
November 2018
Developments in Well-Being at Work in Japan
A Survey and a Comparison with France
Louise Baudrand, César Castellvi, Nao Kinoshita,
Adrienne Sala & Sébastien Lechevalier
Abstract
This paper discusses the evolution of well-being at work in Japan, from a historical and political perspective, in comparison with France, in particular. Several indicators reveal a deterioration of work conditions, like in many OECD countries. Still, this decline of well-being at work in Japan has led to detrimental effects, from diminishing productivity and employees’ satisfaction, up to absenteeism and, in acute cases, death at work (karōshi). By focusing on the Japanese case, the aim of the study is to fathom both the reasons for this decline and the different ways in which public authorities, as well as firms, have addressed this issue. The 1990s was a difficult period for workers who saw an increasing number of non-regular employees, which caused a decline of the average wage. Women, younger and elder workers have been particularly affected by the economic slowdown. In response to this degraded environment, successive governments have taken initiatives and built major laws to help workers to improve their work-life balance and to reduce the risk of death by overwork. Moreover, firms themselves have taken initiatives to improve workers’ well-being using working hours flexibility, developing childcare facilities and providing various fringe benefits. The enacting of the so-called “Work Style Reform” (hatarakikata kaikaku) in June 2018 may be seen as the most recent effort to tackle the situation.
Keywords
Well-being at Work, Productivity, Japan, Employment Inequalities, Women Workers, Fringe Benefits, Work-life Balance, Karōshi.
C
EA
FJ
P D
IS
C
U
SS
IO
N
P
A
PE
R
#1
8-0
5
Contents
Introduction
p. 6
A. Japanese Regular Workers Well-being’s Factors
p. 7
B. Japanese Non-regular Workers Well-being’s Factors
p. 9
C. Current Debate about the Work Style Reform Law Project
p. 9
Part I: The Japanese Labor Market Dynamics since the Last Twenty Years and
its Consequences on Well-Being at Work
p. 11
A. Japanese Economy since the 1990s
p. 11
B. The Limit of an Unemployment Rate Analysis
p. 12
C. Wage Stagnation and Low Labor Productivity
p. 14
D. Non-regular Employment Increase
p. 16
E. The Inequalities between Regular and Non-regular Employees in Japan p. 17
F. Position of Women in the Labor Market
p. 19
G. Japanese Youngers Workers: Between Anxiety and Dissatisfaction
p. 20
H. The Effects of Increasing Elderly Employment
p. 22
I. Working Time, Principal Problem for Regular Employees?
p. 23
Conclusion
p. 27
Part II: Main Public Initiatives regarding Well-being at Work in Japan since the
Early 2000s
p. 28
A. 2003 Act on Advancement of Measures to Support Raising Next-Generation
Children
p. 28
1. The Declining Birthrate for Origin p. 28
2. Content of the Law p. 29
3. The Kurumin Certification p. 30
4. Effects and Revision: Limited Effectiveness p. 31
B. Act on Promotion of Measure for Karōshi
p. 32
1. Emergence of Karōshi and Karôjisatsu p. 33 1.1. Evolution of the Socioeconomic Context of Karōshi and Karōjisatsu: The Decline of Caring in Japanese Style Management and Labor Market Deregulation
p. 34 1.2. Legal and Medical Mobilizations to Reform the Worker’s Compensation
System from the 1970s to the 1980s p. 35
1.3. Successful Litigations and Legislative Improvement from 1990s to
C
EA
FJ
P D
IS
C
U
SS
IO
N
P
A
PE
R
#1
8-0
5
2. Administrative and Legislative Changes: Improvement and Limits p. 38 2.1. Limited Impact of Compensation System Reforms and Legislative
Progress p. 39
2.2. Japanese Firms Abusive Practices and the Struggle to Expand Corporate
Care Obligations p. 40
Conclusion p. 41
C. 2015 Act on Promotion of Women’s Participation and Advancement in the
Workplace
p. 42
1. Background Situation of Women’s Participation in the Workplace and Relation to
Female Employees’ Well-being p. 42
2. Related Debates on 2015 Act on Promotion of Women’s Participation and
Advancement in the Workplace p. 44
3. Content of the Law p. 45
4. Effect of the Legislation on Company Initiatives p. 45
5. International Condition p. 46
5.1. France p. 47
5.2. The Netherlands p. 47
5.3. Norway p. 48
Conclusion
p. 48
Part III: Firm-driven Initiatives: Case Studies
p. 49
A. Initiatives Related to Reducing Working Hours by Better Considering
Well-being at Work
p. 49
1. Encouraging a Morning-Focused Working System p. 50
2. Flexible Working Styles p. 50
3. Encouraging Employees to Take Paid Holidays p. 50
Conclusion p. 51
B. Initiatives Related to Childcare Facilities: The Case of Nissan
p. 52
C. Microsoft Japan and Teleworking Experiment
p. 53
1. Teleworking and Well-being p. 53
2. Teleworking in Japan p. 54
3. A Look at Microsoft Japan’s Initiative p. 54
C
EA
FJ
P D
IS
C
U
SS
IO
N
P
A
PE
R
#1
8-0
5
D. The Diversity of Fringe Benefits within Japanese Firms
p. 55
1. Definition and Background p. 56
2. How do Fringe Benefits Relate with Well-being of Employees? p. 56 2.1. Characteristics of Fringe Benefits p. 56
2.2. Preference of Job Seekers p. 57
2.3. Differences of Fringe Benefits among Companies and Categories of
Employees p. 57
3. Case Examples of Japanese Companies p. 57
3.1. Cybozu Co.,Ltd p. 57
3.2. CyberAgent, Inc. p. 58
4. Cross-national Situation of Fringe Benefit p. 58
Conclusion p. 59
Part IV: Current Challenges of the Work Style Reform (Hatarakikata Kaikaku)
p. 60
A. Why is Work Style Reform Needed?
p. 60
B. Work Style Reform and Employees’ Well being
p. 60
C. Contents of the Reform
p. 60
1. The Bill of the Work Style Reform p. 60
1.1. Introduction of Upper Limit of Overtime Work (Labor Standards Act) p. 61 1.2. Promotion of Dissemination of Inter-duty Interval System (Working Time
Arrangements Improvement Law) p. 61
1.3. Equal Pay for Equal Work p. 61
D. Context and Political Debate regarding the Adoption of the Bill
p. 62
1. Flexibilization of the Labor Market with the Temporary Dispatching Work Law p. 622. The Working Time Deregulation Reforms p. 63
3. The Political Debate p. 63
E. Some Reactions in the Press
p. 65
Conclusion
p. 67
References
p. 69
C
EA
FJ
P D
IS
C
U
SS
IO
N
P
A
PE
R
#1
8-0
5
Introduction
Happy workers are more productive1. It used to be an assumption but since the last decade
many studies showed that there are clear and positive links between workers’ happiness and their productivity2. So far, conventional ways were used to raise productivity: capital investment,
labor increment, skills training, and technological and business innovation. However, according to these reports one unconventional factor has been overlooked and underestimated – the power of happiness3. This growing concern for workers happiness reveals that private and public
actors better understand workers-oriented labor management and organization by assessing its positive impact on firms’ global competitiveness.
According to Global Workforce Happiness Index, Japan is below many other industrialized advanced countries4 and it could be one reason for its low productivity. According to the
Commission on Measuring Well-being in Japan (2011), three domains are considered to be the greatest contributors towards well-being; socio-economic situation, health and relatedness; however, the individual subjective well-being plays a central role for the overall assessment of well-being. A clear distinction is made between the term “happiness” and “well-being”. The term “happiness” is used when describing a state of contented pleasantness which is categorized as an emotion in response to events that occur on a daily basis, while “well-being” is used to capture how well people are doing in all aspects of their life, or in other words, how happy they are in the overall evaluation of their life5.
In this report we investigate several factors of Japanese workers’ well-being and to
what extent a deteriorated well-being could impact workers and firms’ productivity6. In fact,
since the 1990s, Japanese companies’ productivity remains lower than the OECD average. Several factors explain this phenomenon, among them: fewer companies’ investment in human capital (caused by a constant increase in the number of non-regular workers who do
not benefit from company’s formation), high level of retained earnings (in response to future
uncertainty leading to risk-adverse strategies) and to a certain extent workers’ well-being deterioration (OECD, 2015). Indeed, two major trends impact the Japanese labor market:
evolution of the workforce structure and wages. First, the increasing number of non-regular workers reinforces the labor market duality and its rigidity by reducing social mobility and
1. Global happiness workforce Index, https://universumglobal.com/happinessindex/ ; A recent survey found happy workers to be 12% more productive, while unhappy workers were 10% less productive. The research was based on four different experiments with more than 700 participants led by Pr. Andrew Oswald, Dr Eugenio Proto and Dr Daniel Sgroi from the University of Warwick Department of Economics. 2.https://warwick.ac.uk/fac/soc/economics/staff/dsgroi/events/japan_today_13th_june_2016_-_ happiness_and_productivity.pdf
3. Happiness is a mental or emotional state of well-being defined by joy, satisfaction, contentment, enthusiasm and interest. Many psychologists have pointed out that happiness promotes the capacities of innovation, improves memory, and leads to greater altruism. For example, the U.S. Internet giant Google/Alphabet, the most valuable company in the world and the No. 1 place to work for seven years in a decade, is regarded as the pioneer in employee happiness.
4. In the World Happiness Report 2016 Update by the U.N. Sustainable Development Solutions Network, Japan was ranked the 53rd happiest country among 156 countries.
5. http://www5.cao.go.jp/keizai2/koufukudo/pdf/koufukudosian_english.pdf
6. The economic challenge of non-prevention of safety and work health is considerable. The International Labor Office estimated on the World Day for Safety and Health at Work the economic costs of accidents and work-related illnesses to represent nearly 4% of the World GDP.
C
EA
FJ
P D
IS
C
U
SS
IO
N
P
A
PE
R
#1
8-0
5
worsening instability7. Second, despite the economic growth in the mid-2000s and its slight
recovery since 2013 wages are stagnant for both regular and non-regular workers. Labor
market instability, fear of unemployment and wages stagnation became gradually major factors of stress and demotivation for a growing number of Japanese workers. Although well-being factors differ slightly between regular and non-regular workers, since the 1990s labor market ongoing deregulation has generated negative impacts on workers’ well-being.
According to the OCDE framework for measuring well-being and progress, there are three distinct domains: material conditions, quality of life, and sustainability. The material conditions include income and wealth, jobs and earnings, as well as housing. The quality of life refers to several aspects such as health status, work-life balance, education and skills, or subjective well-being. Last but not least, to sustain well-being outcomes over time it is necessary to preserve human capital, social capital, natural and economic capital8. This framework proposes a
multi-dimensional approach of well-being by combining economic circumstances (material living conditions, purchasing power, etc.) with indicators that consider a wide range of quality of life factors. We first explore the well-being’s factors for regular and non-regular workers to highlight different domains of well-being’s interconnection in both cases.
A. Japanese Regular Workers Well-being’s Factors
According to the International Social Survey Program (ISSP)9 on subjective job
satisfaction indicators, Japanese respondents are twice the number of French respondents who would agree to work fewer and earn less money10. In Japan “long working hours” is strongly
correlated with regular workers well-being, whereas in France “income” still has a stronger correlation with job satisfaction. In Japan, despite being on a decreasing trend, the percentage of workers working long hours (60 hours or more per week) remains at a high level compared to other countries (21,9% in Japan; 11,7% in the USA; 7,8% in France, 5% in Germany)11. Since the
1980s, most of the western advanced industrialized countries have adopted ILO (International Labor Organization) standards to reduce legal working time. Japan has also revised the Labor Standards Law (LSL) in 1987 to reduce working time to 8h/day and 40h/week, but no legal measures were introduced to limit overtime. We explain this characteristic in the second part of the report.
Excessive working time leading to overwork impacts negatively workers’ well-being at the workplace but also in their personal life. Japanese employees working longer hours fail to achieve a sustainable work-life balance12. Thus, the number of working hours is a key
factor impacting the perceived equilibrium between expected and actual work-life balance for 7. International Social Survey Program on Job satisfaction (http://www.issp.org/about-issp/ ).
8. http://www.oecd.org/statistics/measuring-well-being-and-progress.htm
9. International Social Survey Program is a cross-national collaboration program conducting annual surveys on diverse topics relevant to social sciences (http://www.issp.org/about-issp/).
10. For example, 32,87% of French agree to work longer and earn more money compare to 25,51% of Japanese; 14,90% of Japanese agree to work fewer and earn less money compare to 7,38% of French (ISSP, 2005).
11. Ministry of Labor, Health, and Welfare report, « Analysis of the Labour Economy ― Challenges for Promoting Innovations and Realizing Work-Life Balance », 2017.
12. According to a recent survey, husbands/wives in double-income household are more stressed than those in full-time housewife households (78,9% of female regular employee declare being stressed and 70,4% of the male respondents are stressed when their wife is a regular employee) in National Employment Situation Panel Survey” (2016), Recruit Works Institute, Recruit Holdings.
C
EA
FJ
P D
IS
C
U
SS
IO
N
P
A
PE
R
#1
8-0
5
regular employees13. Therefore, if wages and job security remain important issues for workers,
Japanese regular workers’ well-being is also strongly correlated with working time as it affects workers’ quality of life (health status, work-life balance, subjective well-being, etc.).
In response to workers’ stress-related health troubles, scientists developed internationally more accurate indicators to measure the correlation between workers well-being and stress, working hours, labor organization, management method, etc14. In France since the 1980s
several salient issues related to the workplace were publicized15 but workers’ well-being is a
relatively recent topic. Indicators such as absenteeism, turnover, labor accident, delay in the production process, or mistakes are taken into consideration to evaluate workers’ well-being as well as the productivity’s loss for the company16.
According to a recent survey, the cost of depression in the Japanese workplace is evaluated at 14 billion dollars lost productivity, twice the Japanese energy budget17. If the cost
of workers’ well-being deterioration is evaluated, it is more complex to measure the positive correlation between workers’ well-being and company productivity (Yamamoto & Mastuura, 2012)18. Nervertheless, according to ILO (International Labour Organization) many studies
show a direct link between productivity levels and the general health and well-being of the workforce19. More recently we observe a growing trend for the development of global health
promotion policies by employers and their partners covering a large range of lifestyle issues including diet, exercise and mental well-being. They focus in particular on the quality of sleep, nutrition and physical activity’s impact on workers’ health, well-being and productivity20. We will
address these dimensions of well-being in the following part of the report. In the next part we focus on non-regular workers’ well-being factors.
13. 70,6% of respondents working 10 hours or more said that the expected status and actual status do not match whereas for 41,8% respondents working less than 10 hours, it matches; “Individual/Company Survey on Work-Life Balance” (2014), Cabinet Office.
14. In France also since last decade work-related stress, moral as well as sexual harassment and management by fear have been analyzed by scientists to publicize the correlation between workplace and well-being (Lerouge, 2017).
15. In the 1980s following the ILO standards on working time “Quality of Life at Work” was a salient issue, then in the 1990s “work-life balance” and in the 2000s moral harassment as well as psychosocial risks were under fierce interest among public and private actors.
16. Work-related stress is a major issue, in the European Union; 22% of workers declared being work-related stressed, and 50% to 60% of absenteeism (day-off) is due to stress work-related troubles. The cost is evaluated at 20 billion euros in 2002 for the European Union (15 countries in 2002).
17. http://www.lse.ac.uk/website-archive/newsAndMedia/PDF/Work-Depression-Japan-Infographic-Full-UPDATED.pdf 18. https://www.rieti.go.jp/jp/publications/dp/12e079.pdf 19.https://www.ilo.org/safework/areasofwork/workplace-health-promotion-and-well-being/ WCMS_118396/lang--en/index.htm 20. https://www.ilo.org/safework/areasofwork/WCMS_118392/lang--en/index.htm, https://www.ilo.org/ safework/areasofwork/WCMS_118393/lang--en/index.htm, https://www.ilo.org/safework/areasofwork/WCMS_118394/lang--en/index.htm
C
EA
FJ
P D
IS
C
U
SS
IO
N
P
A
PE
R
#1
8-0
5
B. Japanese Non-regular Workers Well-being’s Factors
For non-regular workers “job status” is more strongly correlated with job satisfaction.
Non-regular workers do not benefit from the same advantages as regular-workers. Income, fringe benefits, carrier path, access to formation (employee development programs) and job security are significantly lower, or quasi-absent. Non-regular workers’ material conditions (jobs and earnings) are substantially lower than regular workers. As a consequence, labor market inequalities based on status have proportionally expanded with the increase of non-regular workers and represent a factor of well-being deterioration. Furthermore, non-regular workers’ quality of life measured by indicators such as health status, education and skills, personal security or work-life balance is also negatively impacted by their job status. Labor market determinism is strongly perceived among Japanese non-regular workers, which also may deteriorate their subjective well-being by limiting their resources for future (human capital, social capital and economic capital)21. Indeed, if the unemployment rate is lower in Japan than it is in France, the
fear of unemployment impact negatively Japanese non-regular workers because of a high risk of poverty as observed after the financial crisis in 2008-2009 and the following increase of the poverty rate22.
Since the 1990s, in the economic stagnation context and in response to the rising competitiveness of other East Asian countries, Japanese companies reduced labor costs by using a flexible workforce. Higher contingent workforce utilization generates higher turnover, as a consequence the associated regular workers’ workload also increases. As working time is still different between regular and non-regular workers, it is then difficult to highlight the deterioration of non-regular workers’ well-being by focusing on working time as one major factor of reduced time for sleep, unhealthy diet due to a lack of time and poor physical activity. It is nevertheless possible to consider other factors such as low income, instability or a lack of professional formation to address non-regular workers’ higher risks of health, mental well-being and productivity degradation.
C. Current Debate about the Work Style Reform Law Project
Recently the ongoing labor market structural reforms already targeting work-life balance’s improvement are currently reinforced with more emphasis on highly salient topics such as
work-time efficiency and optimized organizational structures. Recent surveys showing
that shorter working hours increase labor productivity23 support the Japanese government’s
measures to encourage firms to introduce several managerial transformations: human resource performance and time management system focusing on individualized evaluation, a discretionary labor system in high priority sectors such as innovation and finance for company top level employees. Moreover, advanced automation with Artificial Intelligence is expected to
continue changing the way of employment24. The ruling Liberal Democratic Party’s is proposing
21. International Social Survey Program (http://www.issp.org/about-issp/).
22. In 2018, two legal cases of non-regular workers demanding the application of the “equal work equal treatment” right are now opened to Supreme Court referral. Decisions are highly expected.
23. Ministry of Labor, Health, and Welfare report, « Analysis of the Labour Economy ― Challenges for Promoting Innovations and Realizing Work-Life Balance », 2017.
24. Impacts of the introduction of AI on workplaces in “Survey on Status of Responding to Innovations” (2017), and “Survey on Working Style for Responding to Innovations” (2017), The Japan Institute for Labour Policy and Training.
C
EA
FJ
P D
IS
C
U
SS
IO
N
P
A
PE
R
#1
8-0
5
series of labor reform bills (hatarakikata kaikaku) to raise productivity to make Japan more globally competitive, it also wants to solve the problem of excessive overtime, which has led to the well-reported karōshi problem (death from overwork)25.
In the first part of this report, we analyze the labor market transformations and its consequences on well-being at work since the last twenty years. In the second part, we investigate public policies implemented to address several social issues such as child rearing, work-related physical and mental health troubles and equal work opportunity for women. We analyze more precisely the 2003 Act on Advancement of Measures to Support Raising Next-Generation Children, the 2014 Act on Prevention of Karōshi and the 2015 Act on Promotion of Women’s Participation and Advancement in the Workplace. We investigate in the third part several cases study of Japanese firms’ innovative management practices. Growing investments in Company Social Responsibility (CSR) demonstrate that workers’ well-being is more and more associated to company’s sustainable development. Finally, we will discuss the current debate about the labor reform law (hatarakikata kaikaku).
25. Article from The Japan Times « Japan’s labor reform ignores elementary principles », March 10, 2018: https://www.japantimes.co.jp/news/2018/03/10/national/media-national/japans-labor-reform-ignores-elementary-principles/ (…) Current debates highlight the fact that in the face of labor shortages,
companies want laws that reduce their obligation to pay overtime, while workers are afraid that limiting it will reduce their wages, since in many cases they have come to expect overtime, not as the occasional compensation for extra work, but rather as an essential part of their livelihood(..).
C
EA
FJ
P D
IS
C
U
SS
IO
N
P
A
PE
R
#1
8-0
5
Part I: The Japanese Labor Market Dynamics since
the Last Twenty Years and its Consequences on
Well-Being at Work
The first part of this report aims to review Japanese labor market main changes since the last twenty years. Our goal is to reveal how and in which ways those transformations have contributed to deteriorate the sense of well-being among Japanese workers. As we have seen above (report introduction), the well-being question in the workplace is linked with different criteria: job security, wages, working hours, and among them, the working-life balance often viewed as the most important. In comparison with the High Economic Growth Period (1955-1973) and the Bubble Period (1986-1991), Japan has experienced a general worsening in terms of working conditions considering all those criteria. We will look at each of them.
A. Japanese Economy since the 1990s
After the burst of the economic bubble in 1991, the Japanese economy declined for more than a decade, ending the significant growth that had begun since the end of the war. In fact, between 1992 and 1999, the GDP stagnated closely to 1% each year, breaking with previous double-digit rates. This economic stagnation was reinforced by the 1997 financial crisis, which had strong effects on labor market and unemployment rate (Genda, 2001). Thus, the period between 1992 and 2002 where unemployment reached its peak is known as “the lost decade”.
A second period starts from the middle of the 2000s, after an economic rebound, despite a
low growth context. However, the situation has worsened soon because of the global financial
crisis of 2008. The period of recession and stagnation continued until the first two years of the 2010s with a new peak during the period of the Great Tôhoku Earthquake and its consequences on all over the country in March 2011.
A third stage starts with the economic rebound from the beginning of 2012. This year
was also the return to power of the Liberal Democratic Party and the second Abe Shinzô’s government from December. Abe rapidly undertook economic reforms called “Abenomics”
based on monetary easing, fiscal stimulus by public investment and other structural reforms. Some of them are specifically linked with labor laws. Although a slight decline has been noticed with a rebound at 2% of GDP growth in 2013, last years were those of an era of low but persistent growth around 1%.
Until the 1990s, Japan benefited from an economic growth which brought work stability and increasing wages. As a matter of fact, it was during the thirty years period between the end of the 1950s and the late 1980s that the well-known standards of long-term employment relationship and seniority-based promotion system have been adopted by a large number of firms. Nevertheless, from the beginning of the 1990s, a combination of macro-level and micro-level transformations had strong consequences, as we will see more precisely thereafter (Lechevalier, 2011).
The three moments described above alternated between period of crisis and period of economic rebound have been the scene of deep evolutions on employment and working conditions. We will focus on it to spotlight the effects on well-being.
C
EA
FJ
P D
IS
C
U
SS
IO
N
P
A
PE
R
#1
8-0
5
B. The Limit of an Unemployment Rate Analysis
A look at Japan and French situations regarding unemployment during the 1990s gives us a good starting point.
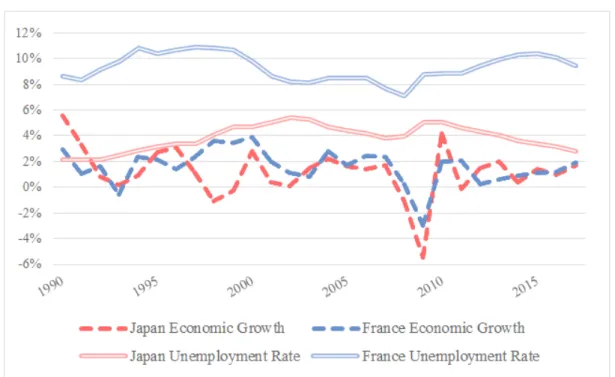
Figure 1: Growth & Unemployment Evolutions in France and Japan between 1990 and 2015
Source: OECD, 2017.
Looking at Japan’s case, unemployment rate has effectively raised from the middle of the 1990s. The increase intensified from 1997 with the Asian countries financial crisis. A peak was reached in 2002 with a rate of 5,4%. However, this increase remains low regarding French situation during the same period. During the 1990s, a better economic climate than Japan did not lead do some employment improvement in France. Even when situation worsened because of the 2008 financial crisis, Japanese growth decreased more deeply than France, but Japan unemployment rate remained relatively low and situation improved quickly while France unemployment rate was reaching a new peak.
Looking at the unemployment rate, Japan demonstrates a strong resilience regarding
economic crises. In February 2018, the rate fell to 2,4%, the lowest since the bubble burst. According to OECD data, Japan ranks second just behind Czech Republic and should reach the first place soon (OECD, 2017a: 8).
C
EA
FJ
P D
IS
C
U
SS
IO
N
P
A
PE
R
#1
8-0
5
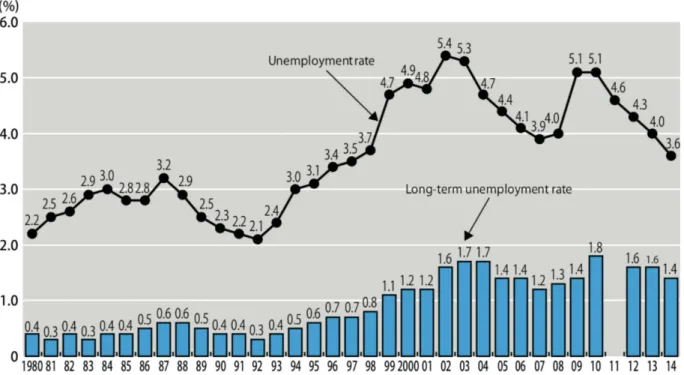
Figure 2: Unemployment rate evolution between 1980 and 2014
Source: Ministry of Internal Affairs and Communications (Statistics Bureau), “Labor Force Survey (労働 力調査)”
A significant part of the recorded decline in the unemployment rate since 2011 comes from hiring in the industrial sector – mostly construction – which traditionally serves as a cyclical adjustment tool. Furthermore, labor force participation in Japan is strongly procyclical i.e. it has been shown women labor supply falls during economic downturns, which substantially reduces the increase in unemployment (Sakurai & Tachibanaki, 1991). However, in 2015,
unemployment is still substantially higher for young people without university education.
Despite of the general amelioration, unemployment rate for people of 19-24 was 6,4% and 5,2% for 25-29, almost twice the national average on the same period.
As we saw above, it is true that Japan has been relatively less affected by unemployment compared to Europe. However, that period of gloom had other type of effects. For example, even if a low rate of unemployment is the sign of a robust economic activity, the fear of unemployment
can remain a factor of stress for part of the population. Job security is the most important issue
for a lot of workers. According to the Research Institute for Advancement of Living Standard26
last report, 26,6% of survey respondents recognized to be concerned with unemployment issue in April 2017 (Rengō, 2017a).
Moreover, other factors have to be considered. First, differences regarding the method used in counting must be taken into account. Second, Japanese firms’ reactions in a time of crisis have specificities. While French firms’ generally use collective redundancies or temporary closing, Japanese firms tend to protect their regular employees by reducing graduate
recruitment (Boyer, 2014). For all these reasons, to over-focus on the issue of unemployment might lead us to believe that situation is improving. Then, we must turn our attention to other issues.
26. The RIALS is a think-tank specialized in labor issues and established by the Rengo, the most influent trade union confederation.
C
EA
FJ
P D
IS
C
U
SS
IO
N
P
A
PE
R
#1
8-0
5
C. Wage Stagnation and Low Labor Productivity
Another way to understand the effect of twenty years of economic difficulties on well-being at work is to focus on the wage evolution. Indeed, according to a survey conducted by national
worker union Rengo in 2017, wage is the second most important concern for work motivation, just after work-content (Rengo, 2017b). In comparison to other OECD major countries, wages have been largely decreasing in the last twenty years as seen on next graph.
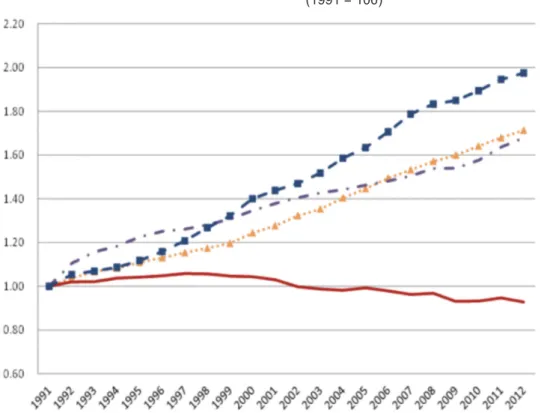
Figure 3: Average Annual Nominal Wage in Selected OECD Countries
(1991 = 100)
Source: Kodama, Inui & Kwon, 2015.
While annual nominal wages in France, Germany or the United States have increased since 1991, Japan wages have progressively declined during the same period. Such a decline
has been deeply felt by workers. Thus, between 1995 and 2005, the feeling of satisfaction related to wages has also decreased from 52% to 39%27. If situation has improved considerably,
especially since the last five years, looking at wage evolution in comparison to productivity growth may offer another interpretation.
27. Cabinet Office Government of Japan, “Public Opinion Survey on People’s Lives (国民生活に関する 世論調査).”
C
EA
FJ
P D
IS
C
U
SS
IO
N
P
A
PE
R
#1
8-0
5
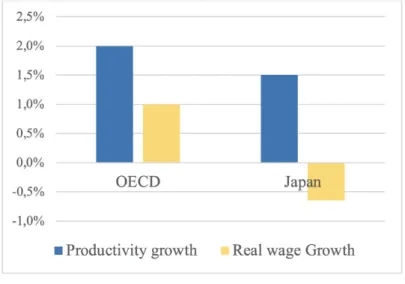
Figure 4: Growth of Productivity and Real Wages between 1990 and 2015
Source: OECD, 2017.
One of the major consequences of low growth economy is the stagnant growth in wages that goes with. While productivity growth was increasing towards 1,5% in average
between 1990 and 2015, wages decreased by 0,68% during the same period. Despite of undeniable improvement of economic result, worker wages are lower than during the 1990s. Japan is the only advanced country which experiments a situation where wages may decrease when demand for labor shrinks (Miyamoto, 2015). Thus, stagnation of wages cannot simply be explained only by the decrease of productivity growth.
There are several ways to understand this phenomenon. A first reaction from firms in an unfavorable economic context is to reduce bonus and overtime payments based on
employees’ individual performance. Proportion of firms who adopted individual performance evaluation system since the 1990s has considerably increased. In 2010, 58% of Japanese
firms have introduced such a payment system, notably in big companies (JILPT, 2010: 107). Bi-annual bonus in Japanese may be the equivalent of several months payment in the same time. As a result, a diminution of bonus has a significant impact on employees’ wage average and thus contributes to the overall decrease that we saw above. This managerial transformation had also impacts on workers’ satisfaction. According to an employee survey conducted by JILPT in 2009, workers often point out individual performance system and procedure to be complicated or that evaluation varies according to evaluator or from a section to another (ibid.: 123).
Several governmental measures have also contributed to reduce households’ budget. First of all, the consumption tax increased from 5% to 8% in March 2014. The government also plans to increase the tax up to 10% in 2019. Since 2011, increasing social insurance costs have become a new burden for many households. Indeed, welfare pension fees increased gradually of 0,177% each year between 2011 and 2017. Moreover, in 2012, child allowance abatement has been dropped out from the inhabitant tax. According to a report released by the Daiwa Institute of Research, the overall reforms related taxes adopted between 2011 and 2020 will have in important impact on households’ budget, and more particularly for highest and lowest income groups28. As an example, a four members household where only one member
28. Estimation of the effect of Consumption Tax Increase on households’ budget, October 2017 Report (消費税増税等の家計への影響試算 2017年10月版) <改訂版> https://www.dir.co.jp/report/research/law-research/tax/20171012_012364.pdf
C
EA
FJ
P D
IS
C
U
SS
IO
N
P
A
PE
R
#1
8-0
5
is working, that earns around three million yens (23 250 €) a year will experience a decrease of 8,3% of its income. For a similar household earning around fifteen million yens (116 350 €) a year, the decrease will reach 8,7% (ibid.: 123).
As we will see hereinbelow, the increasing number of non-regular employees is also a major explanation. Whereas Japan was one of the most egalitarian country at the end of the 1970s, wages inequalities have strongly expanded since the 1990s.
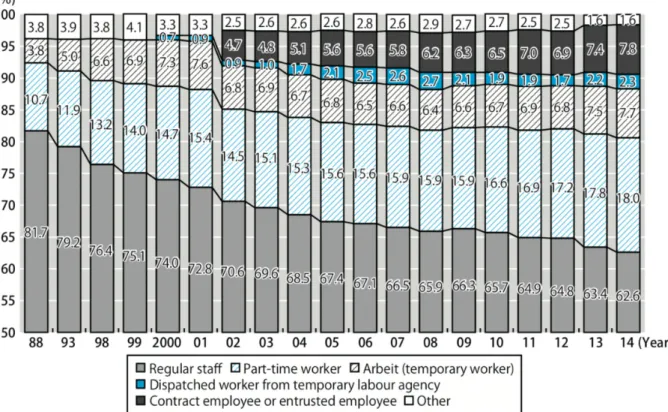
D. Non-regular Employment Increase
The increasing place taken by non-regular employment in labor market represents one of the most important change of the last twenty years. Whereas non-regular employees were only 20% during the middle of the eighties, they accounted for almost 40% in 2017.
Figure 5: The Proportion of Employees by Types of Employment between 1988 et 2014
Source: Japan Institute for Labor Policy and Training,“Labor Situation in Japan and Its Analysis: General Overview 2015/2016 (日本の労働事情と分析 総論版).”
Looking more precisely at the structure of non-regular employment, the major part is occupied by part-time workers (generally called pāto in Japanese) followed by temporary workers (arubaito) and contract employees (keiyaku shain). The increase in part-time category
is the most significant, accounting for 10,7% of the workforce in 1988 and 18% in 2014. We can see the same increase trend in all these categories. It is important to recall that the increase in non-regular employment started before Japanese economy crisis begun. One of the first step is the deregulation of labor market from the middle of the 1980s. In 1985, the government
passed a new act which officially legalizes temporary employment and the establishment of temporary work agency (rôdô haken hô). Legislation became effective one year after but limited temporary work to particular activities. Between 1996 et 2007, other legal deregulations have progressively expand the type of authorized activities. However, temporary work still represents
C
EA
FJ
P D
IS
C
U
SS
IO
N
P
A
PE
R
#1
8-0
5
a small part of non-regular employment with only 2,4% of jobs in 201729.
The development of service sector and the intensification of international competition are generally given as the most important factors to explain the massive increase of non-regular workers in Japan (JILPT, 2016). The low economic growth and Japanese companies’ weak benefits during this period are linked to the diminution of regular employee recruitment we talked about above. In order to reduce costs, many firms chose to protect their employees and strictly limit new recruitment. Numbers of non-regular employees have been recruited for the adjustment, strengthening the duality of the labor market.
Another point is the rise of service-based industries and the decline of agricultural sector. It is obvious in the case of wholesale and retail industries where non-regular employees represent 50% of global employment. In food, beverage and hostel industries, non-regular employees represent 73,3%(ibid.:14). Eventually, the most job-creating industrial sectors are also those where recruitment to non-regular position are the most significant.
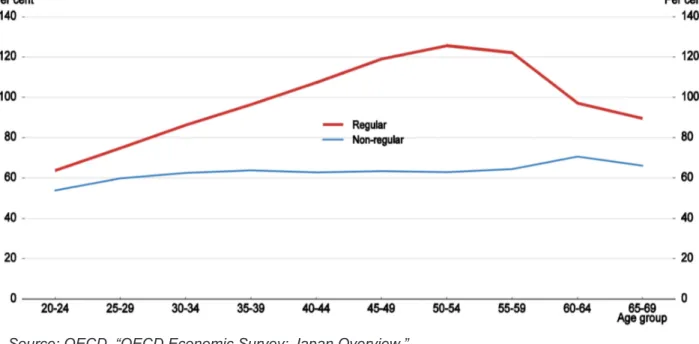
E. The Inequalities between Regular and Non-regular Employees
in Japan
In order to understand the relationship between non-regular employment and well-being, it is necessary to focus on status and wage inequalities between regular and non-regular
workers.
A first issue is job-security. While regular employment provides a strong security for
workers regarding the norm of lifetime employment, non-regular employment often means job insecurity. A comparative study with the United States on job security shows a degradation of job stability for mid-career hires and youth workers in Japan (Kambayashi & Kato, 2017). Moreover, according to the Ministry of Health, Labor and Welfare (MHLW) survey in 2014, only 42,6% of non-regular workers were satisfied regarding the security provide by their positions whereas this part reaches 65,5% for regular employees30.
A second issue is skills training and formation opportunities provide by firms.
According to the 2015 Basic Survey of Human Resources Development, 44,1% of regular employees received at least once opportunities for external education and training, when it was only 20,9% for non-regular employees. This should be considered as a serious issue. Training opportunities are very important as they encourage the use and the development of the worker’s skills. Not only they “contributes to the solution of problems and progress toward goal achievement but [it is a source of satisfaction] in its creative challenging and/or familiar aspects”, which means they are determinant for well-being (Warr, 2007: 84).
The third issue is the important wage inequalities between regular and non-regular employees. In 2015, it still exists a strong disparity between wage average in relation to employment status. Non-regular employees earn around 40% less than regular employee.
Thus, non-regular employment increase since the last twenty years can be seen as one explanation of global wage stagnation during the same period.
29. Japan Staffing Services Association, 2018 (日本人材派遣協会), “派遣の現状|一般社団法人日本人材 派遣協会”.
30. Ministry of Health, Labour and Welfare, “General Survey on Diversified Types of Employment (就業形 態の多様化に関する総合実態調査).”
C
EA
FJ
P D
IS
C
U
SS
IO
N
P
A
PE
R
#1
8-0
5
Figure 6: Wage as a Percentage of the Average Wage of Regular Employees
Source: OECD, “OECD Economic Survey: Japan Overview.”
This significant gap, especially from 30-34 can be explained by the strong use of seniority-based promotion system for regular employees, who can expect a regular increase of their income until the end of their careers. The introduction since the end of the 1990s of individual performance-oriented promotion system did not really influence the trend, mainly because this new system is only related to regular employees.
Thus, a survey conducted in April 2017 by the Japanese Trade Union Federation Rengô revealed that, in relation to the recent amelioration of Japanese economy, regular employees have globally experienced wage growth whereas, in the same time, non-regular workers have shared the opposite situation (Rengō, 2017a).
In 2016, the Japan Institute for Labor Policy and Training (JILPT, 2017) revealed that the level of dissatisfaction regarding workers lifestyle was higher in the case of non-regular workers than for regular workers, the former accounting dissatisfaction level around 50% while the latter remain at 30%. The feeling of dissatisfaction is particularly strong for mid-age males as well as for mid-age spouseless females. The same study gives several reasons: First, mid-age non-regular male workers are more involuntarily engaged at regular job than early-age
non-regular male workers. Second, they are generally engaged on on-sites operations works while female non-regular workers engage on administrative works. Third, the limit of wage increase for non-regular workers constitutes serious difficulties for mid-age male with a family.
All these facts allow us to confirm the presence of strong inequalities regarding the workers status and the difference of advantages linked. While the non-regular employment increase may be a firms’ reaction whom decided to limit economic uncertainty by hiring employees easier to lay off, this increase displays links with the breakdown of well-being at work since the last twenty years. We will show it by looking more precisely at the situation of women and older workers.
C
EA
FJ
P D
IS
C
U
SS
IO
N
P
A
PE
R
#1
8-0
5
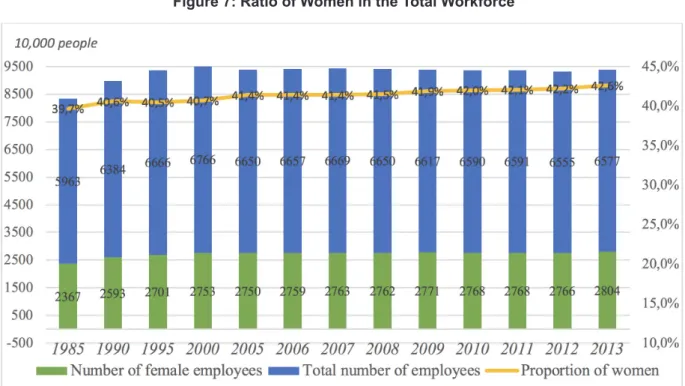
F. Position of Women in the Labor Market
After a long period during which masculine work based on the model of “male bread winner” was the norm, the return of women to the labor market starts truly from the second part of 1980s decade. Contrary to popular thinking, women were present in the labor market until the 1960s. Their gradual disappearance truly began with the early 1970s economic crisis. Until
the middle of the 1980s, male workers wage increase was enough to feed all the family and thus contributed of the rise of the Japanese housewife (sengyô shufu) as female counterpart of Japanese modern family (Thomann, 2005). One key moment is the vote of the Equal Employment Opportunity Act in 1985, as starting point of women return. However, contrary to 1970s economic situation, 1990s economic crisis did not lead to a new disappearance of women. Today, women represent approximatively 40% of the global labor force.
Figure 7: Ratio of Women in the Total Workforce
Source: Ministry of Internal Affairs and Communications (Statistics Bureau), “Labor Force Survey (労働 力調査).”
Industrial sectors where women are particularity numerous are medical, healthcare and welfare sector as well as services, which have been growing since the last decade. It is also
in service and healthcare that we found a growing proportion of non-regular employment. Men and women do not face the same situation. Indeed, in 2003, 15,6% of men were working as part-time or temporary job. They were 21,2% in 2013. At the same time, proportion of women working as non-regular employees increased from 50,6% to 55,8%31.
The « M » shaped curve characterizes women’ behavior on labor market. The hollow is
the result of interruption of career for marriage, childhood and childcare, basically between 30 and 40. This interruption also embodies the changeover to the position of housewife described above. Comparing the same curve of women’ participation into labor force during the 1980s and more recently, we can distinguish a trend of longer participation. As a matter of fact, only 5,7% of women kept their job by using child care leaves after they had their first child between 31. Ibid.
C
EA
FJ
P D
IS
C
U
SS
IO
N
P
A
PE
R
#1
8-0
5
1985 and 1989. The ratio has increased to 17,1% between 2005 and 2009 and proves a kind of expansion of this practice32. This also means the male-bread-winner is not the standard familial
model anymore.
Regarding wages, if the gap between men and women seems to narrow, especially nowadays, women wage remains around 70% of what men earn under the same conditions. A persistent glass ceiling still prevents women to reach managerial position within organizations. In 2014, only 12,4% of women were working in a managing position while they represent 40% of the total labor force (OECD, 2017b).
Eventually, women are doubly penalized. As regular employee, firm’s internal promotion system based on male-bread-winner has been the origin of women departure from the labor market, embodied by the “M-shaped” curve. Related to that, women are the first group targeted by hiring to non-regular position, with all the inequalities given above.
G. Japanese Youngers Workers: Between Anxiety and
Dissatisfaction
The situation of younger workers has deeply changed since the last twenty years. Until the end of the 1980s, the situation on the labor market was good enough to provide hope for the future to the new generation of workers. However, with the start of stronger economic difficulties, people who were trying to join the labor market after graduating from high school or university became the first victim of the crisis. Younger workers who started their career several years after the financial bubble collapsed are known as “the lost generation” (Brinton, 2010). The so-called “recruitment ice-age” refers to the period between 1993 and 2005 during which
it has been harder for a lot of young workers to find job as a regular employee.
For the reasons we gave above, Japanese companies’ retort against economic crisis is first to protect their regular employees. Therefore, the firms prefer “to close their doors” by severely restricting the hiring of new graduate students. Hence, the recruitment of graduate students decreased during almost ten years.
Nevertheless, in the case of Japan, it did not lead to a high unemployment rate among young people, as it was recently experienced in southern European countries after the 2008 financial crisis. The main visible effect of the crisis on younger workers is that many of them could not find a stable job and eventually had to start their career as non-regular employees.
Being hired anyway means they probably got into same positions to do the same tasks as regular employees, but on non-regular status. Therefore, their overall job satisfaction is significantly lower than permanent staff’s (Booth et al., 2002).
C
EA
FJ
P D
IS
C
U
SS
IO
N
P
A
PE
R
#1
8-0
5
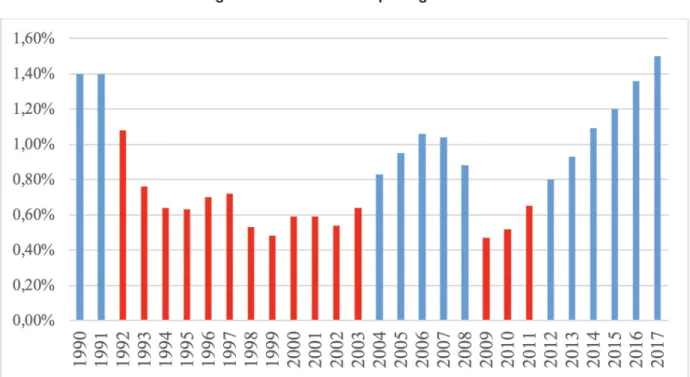
Figure 8: Effective Job Openings Ratio
Source: MHLW “Employment Referrals for General Workers”
While the deregulation of temporary work started from the middle of the 1980s, the 1990s was the golden age of freeters33, an expression used to describe workers who are employed
in non-regular jobs without being a part of categories like housewives and students. Workers who started their careers as freeters have experienced the same type of inequality of wages and welfare as others non-regular workers. However, the contrast is about their struggling to reach a regular position in a company after starting a career as freeter. Genda Yuji uses the notion of “generation effect” to describe the situation faced by young workers who could not get into regular position just after graduating from university due to the “recruitment ice-age”. By unwillingly change from job to one another, these younger workers are not able to get better pays or to improve their qualification for a better job. According to Genda’s research, the main difference with young workers who experimented the same difficulty to find jobs during a period of economic crisis in the US is that, in the case of Japan, the difficulty to reach a stable position remains, even after an economic rebound (Genda, Kondo & Ohta, 2010). Thus, workers who started their career by becoming freeters during the 1990s are living precariously in comparison with the situation of those who could find a stable job during the same period.
Since the last few years, the situation significantly improved toward younger workers regarding opportunities to get a position as a regular employee. Nowadays, it is possible to talk of a clear trend toward the recovery of the demand for new graduates. However, it does not
mean all problems have been solved with the return to a better situation.
33. This expression comes from a combination of two German words: free and arbieter which means worker.
C
EA
FJ
P D
IS
C
U
SS
IO
N
P
A
PE
R
#1
8-0
5
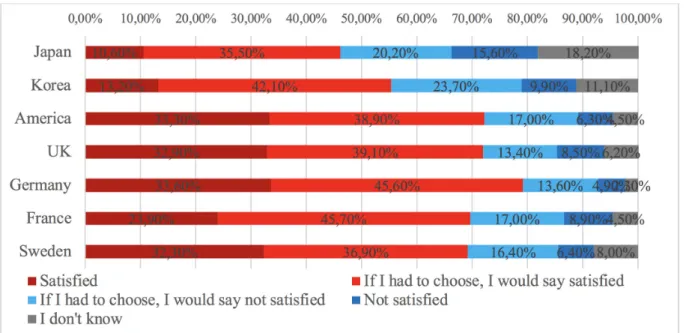
Figure 9: Satisfaction regarding Working Life in 2013
Source: http://www8.cao.go.jp/youth/kenkyu/thinking/h25/pdf/b2_3.pdf
According to a survey conducted by the Prime Minister Cabinet Office in 2013, the level of satisfaction of Japanese younger workers regarding their working life is particularly low, in comparison with other major countries. 35,8% of respondents declared themselves not satisfied with their work environment. The only other country with a such low rate of satisfaction is South Korea with 33,6%.
According to another survey concerning young people aged between 15 and 29 conducted by the Cabinet Office in 2011, their strongest concern regarding working issue was about their ability to earn enough money to live (82,9%) and their capacity to save enough money for
retirement (81,5%). One important result of this survey is that there was almost no difference between regular and non-regular workers. In both cases, the same concern reached more
than 80% of all the answers34.
Thus, a better situation regarding job opportunity is not necessarily related to a better sense of satisfaction for younger workers. Wages are still a real concern for a large part of them, which goes along with the overall decline of wages we described above.
When considering the situation of elderly workers about which we will talk from now, younger workers also have every reason to worry about their future.
H. The Effects of Increasing Elderly Employment
Among the increased number of non-regular employees, elderly employment plays an important role. In comparison with other OECD countries, Japan has the most important rate of elderly workers. Related to the overall aging process, position of aging people in the
labor market has become an important issue. In 2017, 72,7% of men between 60 and 64 were working. For men between 65 and 69, the rate still reaches 49%. Related to a new amendment of the Act on Stabilization of Employment of Elderly People in 2013, mandatory retirement age has been extended from 60 to 65 in a large proportion of firms. Thus, to keep on working
beyond 60 is largely ordinary.
C
EA
FJ
P D
IS
C
U
SS
IO
N
P
A
PE
R
#1
8-0
5
Since 2006, Japan adopted a new law requiring firms to re-employ their former employees after their mandatory retirement around 60. However, instead of being re-hired as regular employee, they continue to work based on a contractual relationship with their companies,
with a more precarious status than before.
This includes the same type of low wages and job insecurity we described for non-regular employee. Therefore, older workers contribute to the increase of non-regular employment. For some of them, re-hiring after mandatory retirement also means to have exactly the same job and work at the same place, whereas their wage has been considerably reduced, generating a strong feeling of frustration. In 2007, a survey released by the MHLW showed a gap of 7% between the wages of 50-54 and 55-59 workers. This gap increases to 30% with 60-64 workers’ wages. According to another survey conducted by the JILPT, this wage gap is a major source
of dissatisfaction for older employees. Indeed, only 2,5% of them were extremely satisfied of their wage and 26,2% generally satisfied, while completely unsatisfied and not very unsatisfied answers reach 60,6%35. As an example of problem related to wage gap, the Supreme Court of
Tokyo recently ruled on two cases concerning the wage gap between regular and non-regular employees working at a transport company. The two employees were former regular workers who lost 25% of their pay before retirement, while work contents did not change.
To prioritize older employee’s employment has also consequences on new graduated students (shinsotsugyôsei) and women hiring. During the 1990s economic crisis, rather than cutting into their workforce, a large number of Japanese firms decided to reduce drastically the traditional graduated students hiring. Hence, a considerable number of young workers did not have the opportunity to reach regular employment, contributing to the birth of what the economist Yûji Genda calls “Employment ice-age”36. Between 1993 and 2005, a lot of graduated students
failed to find a job as a regular employee and contributed to increase non-regular employment. Concerning influences on women hiring, some researches show that when firms re-hire older male employee after retirement, recruitment of part-time female workers decrease37.
Population aging process contributes to the increase of non-regular employment and cultivates inequalities regarding women or young people who are not graduated from the university. Furthermore, even if legal dispositions give the opportunity to senior workers to keep their job after mandatory retirement, it is based on a more precarious status.
I. Working Time, Principal Problem for Regular Employees?
Long working hours are a major issue for regular employees. As we saw previously, wages stagnation and job insecurity impact negatively non-regular employees and women’s well-being. In order to understand factors impacting male regular employees’ well-being,
which still represent the largest proportion of workers in Japan (60%), we have to consider long working time.
The first revision of the Labor Standards Law in 1987 legalized working time at 40 hours a week and 8 hours a day38.
35. Kodama, 2015: 9. 36. Genda, 2018.
37. Kondo, 2016. “Effects of Increased Elderly Employment on Other Workers’ Employment and Elderly’s Earnings in Japan.”
C
EA
FJ
P D
IS
C
U
SS
IO
N
P
A
PE
R
#1
8-0
5
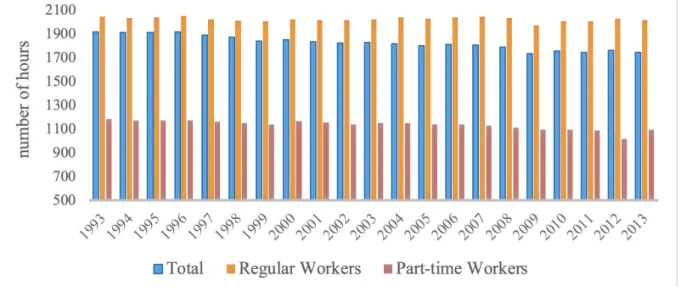
Figure 10: Annual Total of Hours Actually Worked by Regular and Part-time Worker
Source: Compiled from MHLW, Monthly Labor Survey (establishments with five or more workers).
Despite a decrease in the total working hours since the late 1980s, we observe a significant difference between regular and non-regular employees’ working hours. Working hours are quite
higher for regular employees. This phenomenon may be explained by the firms’ tendency
to reduce non-regular workers working hours during period of economic downturn. As shown in the next graph, there is a direct association between the amount of overtime work and the ebb and flow of business conjuncture (Imai, 2011). Japanese companies adjust overtime in response to the business conjuncture. Large firms have the strongest correlation between the amount of overtime and changes in business conjuncture compared to smaller firms, even though overtime is declining and with it the differences among firm sizes (ibid.).
According to a recent MHLW survey, 22,7% of firms had full-time employees who worked more than 80 hours overtime per month39. Under labor accident standards, 80 hours
overtime in a month is known as the “karōshi line.” The industries with the highest proportion of employees crossing this line with excessive overtime were information and communications (44.4%), academic research and specialist and technical services (40.5%), and transportation and postal services (38.4%).
Very long working hours (more than 60 hours a week for a long period) represent more than 8,2% of workers in 2015, according to the Labor Force Survey. The situation is particularly harsh for young employees of 30-39, as this is when internal selection is done to access managerial positions. In 2015, 16% of them were working more than 60 hours a week, twice the national average. Karōjisatsu victims are more represented among the 30-39 years workers
(Kawahito, 2014).
entertainment, health and hygiene of Information and communication related works.
39. The survey, conducted from December 2015 to January 2016, was sent to some 10,000 corporations (of which 1,734 replied) and around 20,000 employees (White Paper on Karōshi, 2017).
C
EA
FJ
P D
IS
C
U
SS
IO
N
P
A
PE
R
#1
8-0
5
Figure 11: Trend of Overtime and Business Conjuncture by Firm Size (Manufacturing) Hours per Month
Source: Monthly Labour Survey, MHLW 2008.
Several problems emerge from a long working hours environment. First, there is a clear relation between long hours and the rise of stress and health risks for workers. According
to a JILT survey released in 2010, 78,6% of respondents who are working more than 60 hours a week feel anxiety, worry or stress related to work. Risk of injury or illness increases also significantly40. The bleakest effect related to long hour working is karōshi, literally death by
overworking, about which we will talk in more detail in this report.
Kuroda (2009) shows that between 1976 and 2006 the daily working hours has increased as a result of the five days working week. He observes that between 1976 and 2006 sleeping time reduced (an average of 7 hours, in comparison with France where the average is 8,5 hours). According to ILO survey, sleep-deprived adults have lowered emotional resilience, greater irritability, increased obesity, and higher risk of cardiovascular disease. Controlling for most other relevant factors, sleeping too little is associated with a 40% increased chance of earlier death41.
Lunchtime also slightly reduced (less than 1 hour; Kuroda, 200942). According to several
recent surveys, almost half of the workers spend 10 to 20 min for lunch (on average 21.6 min for men and 29.1 min for women)43. In Japan, more generally the majority of both men and
women bring their own homemade lunch to work. If the main reason is to save money, by 40. Japan Institute for Labor Policy and Training, “General Survey of the Actual Employment Situation of Japanese People.”
41. https://www.ilo.org/safework/areasofwork/WCMS_118392/lang--en/index.htm 42. https://www.rieti.go.jp/jp/events/09040201/pdf/1-1_Kuroda.pdf
43. 新生銀行「2018年サラリーマンのお小遣い調査」(2018年9月25日アクセス)