MÉMOIRE PRÉSENTÉ À
L'UNIVERSITÉ DU QUÉBEC À TROIS-RIVIÈRES
COMME EXIGENCE PARTIELLE
DE LA MAÎTRISE EN SCIENCES DE L'ENVIRONNEMENT
PAR
LOUIS DESROCHERS
MASQUE ACOUSTIQUE CHEZ LES ESPÈCES VOCALES DES BASSES-TERRES DU SAINT-LAURENT
Université du Québec à Trois-Rivières
Service de la bibliothèque
Avertissement
L’auteur de ce mémoire ou de cette thèse a autorisé l’Université du Québec
à Trois-Rivières à diffuser, à des fins non lucratives, une copie de son
mémoire ou de sa thèse.
Cette diffusion n’entraîne pas une renonciation de la part de l’auteur à ses
droits de propriété intellectuelle, incluant le droit d’auteur, sur ce mémoire
ou cette thèse. Notamment, la reproduction ou la publication de la totalité
ou d’une partie importante de ce mémoire ou de cette thèse requiert son
autorisation.
Je tiens d'abord à remerCIer mon directeur de maîtrise, M. Raphaël Proulx, de m'avoir donné l'opportunité de travailler sur ce merveilleux projet. Merci également pour m'avoir transmis une partie de ton savoir et de m'avoir guidé afm que je devienne un meilleur chercheur. Je tiens également à remercier les membres de mon comité d'orientation, Julie Ruiz et Jean-Claude Bourgeois, pour leurs questions et suggestions face à mon projet et à l'interprétation de mes données.
Je tiens également à remercier tous les membres de la Chaire de recherche du Canada en intégrité écologique (CRIE), Irene Torrecilla Roca, Stéphanie Harnois, Guillaume Rheault, Charles Martin, Caroline Beaulieu, Philippe Massicotte, pour leur aide dans mes travaux de terrain et les discussions entourant mon projet.
Un remerciement spécial aux propriétaires des terres agricoles impliqués dans le projet pour leurs autorisations à installer mon matériel à proximité des plans d'eau présents sur leur terre. Je remercie également Simon Boisvert qui a facilité la mise en contact avec ces propriétaires.
Ce projet a été réalisé grâce au soutien fmancier du Fonds de recherche du Québec en Nature et technologies (FRQNT) et du soutien financier reçu par M. Raphaël Proulx du FRQNT et du Conseil de recherches en sciences naturelles et en génie du Canada (CRSNG).
Ce mémoire de maîtrise est l'aboutissement d'un peu plus de deux années de recherche dans le cadre de la maîtrise en sciences de l'environnement. Les campagnes d'échantillonnage des données libres se sont déroulées entre janvier et avril 2014, alors que la campagne d'échantillonnage des paysages sonores s'est déroulée entre avril et octobre 2014. La réalisation de ces échantillonnages et les analyses qui en découlent se sont déroulées sous la supervision du professeur Raphaël Proulx, titulaire de la Chaire de recherche du Canada en intégrité écologique, à l'Université du Québec à Trois-Rivières. Le présent projet avait pour but de déterminer l'importance des événements de masques acoustiques créés par les bruits humains chez certaines populations animales.
Ce mémoire comprend trois chapitres, une introduction générale et une conclusion écrite en français (chapitres l et III) et un article scientifique découlant de mes principaux résultats (chapitre II). Ce dernier, dont je suis l'auteur principal avec Raphaël Proulx, sera soumis à la revue Landscape and Urban Planning.
Bon nombre d'espèces animales terrestres utilisent l'espace acoustique afin de communiquer des informations importantes à leurs congénères et aux individus d'autres espèces. En présence de bruits de forte intensité, une part de cette communication pourrait être mal perçue par les individus receveurs en raison du masque acoustique. Ce dernier n'est possible que lorsque des bruits externes à la communication sont produits: 1) dans les mêmes fréquences sonores, 2) à une intensité similaire ou supérieure et 3) au même moment que la communication. Ce projet de recherche consiste à établir la probabilité que la communication de différentes espèces animales (anoures, oiseaux et orthoptères) soit masquée par les bruits humains. Pour ce faire, nous avons effectué une analyse spectrale de près de 1000 enregistrements afm d'évaluer le chevauchement entre les distributions de fréquences dominantes des vocalisations animales et celle des bruits humains. Nous avons également réalisé une cartographie des Basses-terres du Saint-Laurent afin de calculer la proportion du territoire où des bruits de fortes intensités peuvent survenir. Finalement, nous avons effectué une campagne d'échantillonnage de 9 milieux sonores distincts, étalés selon un gradient d'urbanisation. Ces enregistrements nous ont permis de calculer le chevauchement journalier entre la phénologie de l'activité vocale des différentes espèces animales et celle des bruits issus des activités humaines. Les résultats de nos travaux suggèrent que les anoures sont les espèces les plus touchées par le phénomène de masque acoustique, alors que les orthoptères sont les moins touchés. À l'échelle des Basses-terres du Saint-Laurent, les probabilités que les chants des différentes espèces soient masqués ne dépassaient pas 5 %. Cependant, en se concentrant uniquement sur les paysages urbains, les anoures ont une probabilité supérieure à 30 % de chanter dans des périodes où leurs chants vont être masqués par les bruits humains. Ce projet pave donc la voie à de nouvelles études portant sur les impacts métaboliques, comportementaux et/ou reproductifs de ces épisodes de masque acoustique chez différentes espèces, plus spécifiquement chez les anoures. Ces derniers étant un groupe taxonomique peu mobile, ils ont peu de chance d'échapper à cette contrainte qui pourrait devenir majeure, principalement en milieu urbain. Finalement, cet outil de mesure du potentiel de masque acoustique pourrait être utilisé lors de campagnes d'évaluation environnementale commandée par des industries pouvant émettre des bruits de fortes intensités telles que les industries minières et gazières.
Mots-clés: Agricole, Anoures, Biophonie, Bruit anthropique, Masque acoustique, Phénologie, Oiseaux, Orthoptères, Urbain.
REMERCIEMENTS ... üi
AVANT-PROPOS ... iv
, , RESUME... v
LISTE DES FIGURES ... viti CHAPITRE 1 IN'TRODUCTION ... 1
1.1 Problématique ... ... ... ... ... ... ... ... ... ... ... 1
1.2 L'onde sonore... 2
1.3 Communication sonore chez les animaux ... ... ... ... ... ... ... 4
1.4 Cadre conceptuel.... ... ... ... ... ... ... ... ... ... ... ... ... ... 6 1.4.1 Ressource spectrale... 6 1.4.2 Ressource spatiale... 8 1.4.3 Ressource temporelle ... 9 1.5 Objectifs et Hypothèses ... Il CHAPITRE II ACOUSTIC MASKING OF SIGNALLIN'G SPECIES OF THE ST-LAWRENCE LOWLANDS... 13
2.1 Abstract... 14
2.2 Introduction.. ... ... ... ... ... ... ... ... ... ... ... ... 14
2.3 Material and methods ... ... ... ... ... ... ... ... ... ... ... ... ... 16
2.3.1 Spectral overlap ... 16 2.3.2 Spatial overlap ... 17 2.3.3 Temporal overlap... 18 2.4 Results ... ... ... ... ... ... ... ... ... ... ... ... ... ... ... ... 19 2.4.1 Spectral overlap ... 19 2.4.2 Spatial overlap ... 20 2.4.3 Temporal overlap ... 20
2.4.4 Probability of acoustic masking... 21
2.6 Conclusion... ... ... ... ... .... ... .... ... ... ... ... ... 24 2.7 Acknowledgement . ... ... ... ... ... ... ... ... .... ... ... ... ... ... 24 2.8 Literature cited... 25 2.9 Tables... 30 2.10 Figure legends... 32 CHAPITRE III CONCLUSION ... 36 3.1 Contextualisation... 36 3.2 Principaux résultats... 36 3.3 Conclusion ... 37 RÉFÉRENCES BffiLIOGRAPHIQUES... 40 ANNEXE A LOCALISATION DES ENREGISTREMENTS ... 45
Figure Page
1.1 Représentation visuelle d'une onde sonore et de ses principales
composantes... 3
1.2 Spectre de fréquences du chant d'accouplement (1) et audiogramme (2)
d'une espèce d'orthoptère (Chorthippus brunneus) ...... 4
1.3 Relation entre le poids d'un organisme et la fréquence d'émission de ses
chants chez les oiseaux passériformes... 7
1.4 Série temporelle du nombre relatif de recherches par mots-clés selon
Google Trends... 10
INTRODUCTION
1.1 Problématique
L'accroissement des populations humaines, surtout concentrées dans les centres urbains, est remarquable via des modifications biogéographiques (p. ex., urbanisation, déforestation, homogénéisation des pratiques agricoles; Meyer et Turner II, 1992), mais également via des modifications des activités humaines (p. ex., augmentation du transport motorisé des marchandises, industrialisation des procédés de transfonnation des ressources). Ces dernières entraînent de profondes modifications au niveau du paysage sonore.
Les bruits humains étant d'intensité plus forte que les sons d'origine faunique, ils peuvent empêcher un individu récepteur de détecter les signaux sonores qui lui sont destinés (Dooling et Popper, 2007). Cet effet, appelé masque acoustique, pourrait avoir plusieurs répercussions sur le comportement, la capacité reproductrice et les coûts métaboliques associés à la production de chants pour les espèces animales vocalement actives (Hu et Cardoso, 2010; Halfwerk et al., 2011).
Le paysage sonore représente l'ensemble des sons émis dans un environnement à un instant donné et varie donc, dans le temps et dans l'espace (Krause et al., 2011; Pijanowski et al., 2011). Il est possible de le décomposer en trois constituantes distinctes: l' anthrophonie, la géophonie et la biophonie (Napoletano, 2004). L'anthrophonie comprend les sons émis par les objets stationnaires et mobiles qui ont été créés par les humains. La géophonie est l'assemblage des sons émanant des éléments géophysiques du paysage, tels que les bruits provenant des cours d'eau, du vent, de la pluie, etc. (Pijanowski et al., 2011).
Finalement, la biophonie est composée des sons émis par les anunaux vocaux (c.-à-d. anoures, oiseaux, orthoptères, etc.) afin d'assurer divers comportements sociaux, tel que la défense des territoires et les processus d'alimentation et de reproduction (Gerhardt et Huber, 2002; Rheindt, 2003). L'analyse des paysages sonores, facilitée par les moyens technologiques actuels, permet donc d'étudier des environnements façonnés à la fois par des processus biotiques et des activités humaines.
1.2 L'onde sonore
Les ondes sonores sont caractérisées de trois composantes distinctes: l'amplitude, la fréquence et la durée (Brumm, 2004). L'amplitude est la mesure de l'ampleur de l'oscillation de l'onde sonore autour de l'axe de propagation, généralement exprimée en décibel (dB; Figure 1.1). On exprime également cette composante comme l'intensité d'un son. La seconde composante, la fréquence, représente le nombre de cycles que l'onde effectue en une seconde et est exprimée en hertz (Hz). Elle se calcule à l'aide de l'équation:
f=l/p (1.1)
où f est la fréquence et p est la longueur d'onde. Ainsi, la fréquence d'une onde augmente lorsque sa longueur d'onde diminue (Séguin et al., 2010). C'est cette dernière qui fait en sorte que certains sons sont perçus comme étant aigus alors que d'autres sont perçus plus graves. Finalement, la durée d'un son désigne la période durant laquelle une source émet un signal sonore.
Figure 1.1
FIIèq 2Hz
t
=
1s
Représentation visuelle d'une onde sonore et de ses principales
composantes.
La propagation de l'onde se fait selon l'amplitude et le temps d'émission alors que le nombre de cycles qu'elle complète est lié à sa fréquence. Source: http://tpe-protheses-auditives.jimdo.coml Il est à noter qu'une onde sonore perd de l'intensité au fur et à mesure qu'elle parcoure une distance dans l'air. Cette perte d'intensité (aussi appelée atténuation) peut être calculée selon :
A = 20
*
l0910C:)
(1.2)où A est l'atténuation du son, rI est la distance initiale de la source par rapport au
receveur et r2 est la distance [male de la source par rapport au receveur (Peterson,
1980). Cette équation permet donc une règle simple; l'intensité d'un son est
diminuée d'environ 6 dB à chaque fois que la distance entre la source et le receveur
est doublée. Cette relation est toutefois variable selon l'environnement physique
dans lequel l'onde sonore se propage (c.-à-d. géométrie, température, humidité ·
1.3 Communication sonore chez les animaux
Chez les différents groupes du règne animal terrestre, la réception d'un signal sonore se fait à l'aide d'une membrane vibrante. Les multiples signaux reçus au même moment doivent ensuite être assemblés afin que l'interprétation du message soit complète. L'efficacité de ce processus d'audition est déterminée par: i) les seuils de détection de l'individu et ii) l'étendue des bandes de fréquences critiques.
Les seuils de détection reflètent la capacité vibratoire des membranes de l'organe auditif, et ce, pour différentes fréquences acoustiques. Chez une espèce donnée, les seuils de détection les plus bas se situent généralement près des fréquences dominantes émises pour la communication (Okanoya et Dooling, 1987) et se détériorent plus ou moins rapidement de part et d'autre de ces fréquences de communication (Figure 1.2).
Song spectrum
Auditory threshold
Frequency
(kHz)
Figure 1.2 Spectre de fréquences du chant d'accouplement (1) et audiogramme (2) d'une espèce d'orthoptère (Chorthippus
brunneus).
Les axes verticaux représentent respectivement l'intensité relative à l'intensité maximale du chant et l'intensité minimale (en dB) afm qu'un son soit perceptible par l'espèce. Source: Meyer et Elsner (1996).
La capacité de discriminer un signal acoustique du bruit de fond dépend du ratio du bruit sur le signal (signal-to-noise ratio; SNR) dans les bandes de fréquences excitées. Le SNR est calculé comme suit:
SNR = S - B (1.3)
où S est l'amplitude maximale du signal et B est l'amplitude du bruit ambiant (Towsey et al., 2014). Ainsi, un signal émis à une amplitude inférieure à celle du bruit ambiant ne serait pas perçu par l'organe auditif du receveur. De plus, afm d'interpréter correctement un signal, une valeur minimale de SNR doit être atteinte, une valeur avoisinant 20 dB pour les humains (Dooling et Popper, 2007). Autrement, le message transmis ne sera pas perçu par l'individu receveur.
L'étendue des bandes de fréquences critiques définit la résolution avec laquelle un signal acoustique sera interprété. Fusionnant l'énergie contenue dans toutes les fréquences qu'elles couvrent, ces dernières transmettent l'information comme s'il ne s'agissait que d'une seu1e et même fréquence (Fletcher, 1940). Ainsi, des bandes de fréquences critiques étroites offriront une meilleure résolution auditive; il sera plus facile de discriminer les informations contenues dans des signaux émis à des longueurs d'onde similaires (Ehret et Capranica, 1980). Ces bandes sont également plus étroites pour les basses fréquences que pour les fréquences élevées, mais les variations dans la taille des bandes de fréquences critiques diffèrent d'une espèce à l'autre en fonction de l'excitabilité du nerf auditif (W ollerman, 1999).
Ainsi, si deux individus ont des seuils de détection similaires, celui qUi possède les bandes de fréquences critiques les plus étroites percevra des différences plus subtiles dans les signaux sonores. Ces deux mécanismes font en sorte que le message contenu dans un même paysage acoustique peut être perçu de façons différentes par des individus d'espèces différentes.
1.4 Cadre conceptuel
Un masque acoustique sur le chant d'une espèce survient lorsque l'émission de certains sons: i) occupe le même spectre de fréquences que celui utilisé par l'espèce pour communiquer (ressource spectrale), ii) est d'intensité assez élevée pour couvrir partiellement ou totalement le chant de l'espèce (ressource spatiale) et iii) est temporellement associée aux périodes de chant de l'espèce (ressource temporelle; Patterson et Green, 1978; Brumm and Slabbekoorn 2005; Slabbekoorn
et al., 2010). Le masque acoustique, créé par les bruits d'origine humaine, a été étudié dans les environnements aquatiques (Kuehne et al., 2013), mais également dans les environnements terrestres: chez les oiseaux (Hu et Cardoso, 2009; Francis
et al., 2011), les anoures (Sun et Narins, 2005; Bee et Swanson, 2007) et les orthoptères (Morley et al., 2014).
1.4.1 Ressource spectrale
Il est possible de considérer l'espace sonore utilisé par une espèce comme sa niche acoustique (Krause, 1987). L'unicité de cette dernière permettra à une espèce d'avoir une communication adéquate afin de remplir toutes les fonctions qui lui
sont associées, et ce, à l'échelle d'une population ou d'une communauté.
Les différentes espèces ont donc évolué afin d'utiliser une part différente de la ressource spectrale et ainsi diminuer les conflits interspécifiques (Duellman et Pyles, 1983; Wollerman, 1999; Sueur, 2002).
De façon générale, on peut observer un patron entre la taille des individus et les fréquences dominantes de leur chant; les individus de petite taille utilisant des fréquences plus élevées que ceux de plus grandes tailles. Cette relation est due à la taille des organes émetteurs qui est proportionnelle à la taille du corps, mais inversement proportionnelle aux fréquences des chants (Figure 1.3). La taille de l'organe vocal et les fréquences émises par ce dernier varient donc selon:
ii) la taille des espèces d'un même groupe taxonomiques (Ryan et Brenowitz, 1985)
et iii) les groupes taxonomiques auxquels elles appartiennent (Napoletano, 2004;
Krause, 2011; Gage et Axel, 2014) .
-
N:x::
-'" " - ' ~ c: Q) :::lW
u... Figure 1.3 6•
••
•• • fc-7204 W-O.24 5 • • r--0.77(p< 0.001) ••
• s
•
4
•
• 3•
• • • •2
• O~---~--~--~--~--~--~---L--~--~ 5 t) 20 50 100 500 'K>OO 9 Body weightRelation entre le poids d'un organisme et la fréquence
d'émission de ses chants chez les oiseaux passériformes. Source: Wallschlager (1980).
Les espèces sont donc affectées par le masque acoustique à différents degrés
selon la proportion de chevauchement entre les distributions des fréquences
dominantes de leur chant et celles des bruits anthropiques. Les sons d'origines
humaines étant concentrés dans les basses fréquences, les grosses espèces auraient
une plus grande probabilité d'être masquées (Skiba, 2000; Goodwin and Shriver
20 Il). Au niveau taxonomique, l'effet de masque acoustique sera potentiellement
plus important chez les populations d'anoures; leurs fréquences dominantes étant
Afin de limiter le masque acoustique sur le plan de la ressource spectrale,
bon nombre d'oiseaux ont tendance à moins utiliser les fréquences qui sont en
conflit avec le bruit ambiant: i) en augmentant certaines de leurs fréquences de
chant (Roca et al., 2016), ii) en diminuant l'étendue de leur registre (Hu et Cardoso,
2010) ou iii) en choisissant les chants de leur répertoire qui interfèrent le moins
avec ce dernier (Slabbekoom et den Boer-Visser, 2006; Wood et al., 2006).
Cependant, les travaux qui ont cherché à démo~trer ces mécanismes d'évitement
dans les chants d'espèces d'anoure se sont montrés infructueux (Lengagne, 2008),
à l'exception de deux espèces d'anoures retrouvées en Ontario et au Québec
(Cunnington et Fahrig, 2010).
1.4.2 Ressource spatiale
Lorsque les paysages naturels sont soumis à l'urbanisation, le paysage sonore,
auparavant dominé par les composantes biotiques et géophysiques, devient dominé
par les composantes anthropiques (Matsinos et al., 2008). Bien que la majorité de
l'énergie contenue dans les bruits humains se retrouve dans les basses fréquences,
une partie est également contenue dans les fréquences plus élevées (Nemeth et
Brumm, 2010). Ainsi, le spectre de fréquences du paysage sonore entier est soumis
à une intensité plus élevée qui diminue le SNR des individus récepteurs.
En réponse à cette intensité plus élevée, bon nombre d'organismes ont
tendance à augmenter l'amplitude de leur chant. Cette adaptation, nommée l'effet
Lombard, est perceptible tant chez les humains que chez différentes espèces
animales (Potash, 1972; Brumm et Todt, 2002). L'ampleur de cette adaptation est
régulée par la plasticité de l'appareil vocal. L'effet Lombard est également plus
efficace que le changement de fréquences d'émission des chants afm qu'un
message soit interprété correctement par une espèce donnée, et ce, à la même
distance que s'il n'y avait pas de bruits (Nemeth et Brumm, 2010). Cependant, en
présence de bruits de très forte intensité, l'effet Lombard à lui seul n'est plus suffisant afm d'obtenir un SNR adéquat pour une bonne communication.
En ce sens, une étude de Paton et al. (2012) a déterminé que le seuil de tolérance des espèces sensibles au bruit se situe à 50 décibels. Au-delà de ce seuil, certaines espèces auront tendance à se déplacer ou à ne pas s'établir dans ces milieux afin de se soustraire au bruit.
1.4.3 Ressource temporelle
Les différents groupes chanteurs, c'est-à-dire les anoures, les oiseaux et les orthoptères, se partagent la ressource sonore de façon à diminuer le chevauchement entre leur période d'accouplement. Les différentes espèces présentes dans la communauté ont tendance à chanter à des moments différents de l'année (Weber et Theberge, 1977; Garant, 2004). Les inventaires traditionnels s'appuyant sur les chants pour estimer l'abondance et la diversité des espèces chanteuses en sont un bon exemple; ces derniers étant effectués à des dates différentes selon les groupes taxonomiques ou les espèces à l'étude (Environnement et Changement Climatique Canada, 2011; Gouvernement du Québec, 2014).
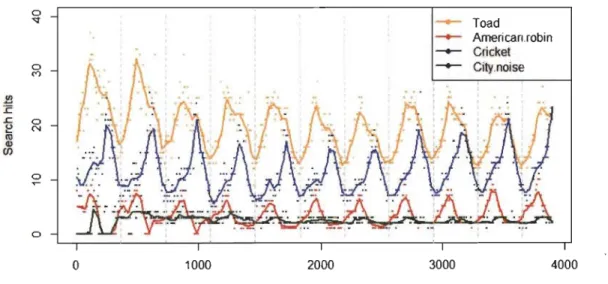
L'évolution de l'utilisation de certains mots-clés associés à des processus naturels comptabilisée par Google Trends peut être considérée comme un bon indicateur de leur phénologie (Proulx et al., 2014). Ainsi, il est possible de constater que l'intérêt porté aux crapauds (<< toads »), aux grillons (<< cricket ») et aux merles d'Amérique (<< american robin ») fluctue de manière saisonnière, et ce, en synchronisme avec les périodes de reproduction de ces différents groupes (Figure 1.4). Par ailleurs, les bruits anthropiques (<< city noise ») ne semblent pas être soumis à cette variation selon les saisons (Figure 1.4), même si aucune évidence n'a été trouvée lors de cette revue de littérature.
0 <q - Toad - American.robin - Cricket 0 C") - City.noise .B :c ..c 0 ~ N tIl Q.l Cf) 0 ~ 0 0 1000 2000 3000 4000
Days (since 1 january 2004)
Figure 1.4 Série temporelle du nombre relatif de recherches par mots-clés selon Google Trends.
Nombre de recherches entre 2004 et 2014 aux États-Unis pour les termes crapauds (<< toads
»,
en jaune), merle d'Amérique (<< american robin»,
en rouge), grillons (<< crickets»,
en bleu) et bruit urbain (<< city noise»,
en vert). Les lignes pointillées verticales représentent le 1 er janvier de chaque année.Plusieurs études ont également noté des variations quotidiennes dans l'activité sonore chez différents groupes taxonomiques (Sueur, 2002; Fuller et al., 2007). Ces variations prennent souvent la forme de chorales complexes, par exemple, à l'aurore et au crépuscule pour les oiseaux. Ces dernières sont possiblement dues à une réserve énergétique adéquate à ce moment de la journée, mais également à une grande portée des chants lors de ces périodes (Warren et al., 2006). Ces chorales permettent également aux individus de limiter la compétition intra et interspécifique; ils peuvent espacer de façon régulière leur chant afin de chanter lorsqu'aucun autre individu ne chante (Gerhardt et Huber, 2002; Vargas-Salinas et al., 2014). Des mécanismes similaires pourraient donc être utilisés par les animaux afin de se soustraire au masque acoustique; certains individus choisissant de chanter dans des périodes où le bruit ambiant est d'intensité moindre (Sun et Narins, 2005; Slabbekoorn et Ripmeester, 2008). Fuller et al. (2007) ont d'ailleurs
montré que les chorales matinales étaient plus hâtives et duraient moins longtemps
lorsque les bruits d'origine humaine augmentaient en intensité durant le jour.
D'autres stratégies temporelles pourraient être utilisées afm d'augmenter la perception et la distinction de signaux sonores face au bruit de fond (Penna et
Hamilton-West, 2006). En émettant sur de plus longues périodes ou en augmentant
la rythmique de son chant, un individu pourrait augmenter l'information contenue
dans son signal (Penna et Hamilton-West, 2006; Sun et Narins, 2005).
Cette stratégie diminuerait la dégradation du message dans l'environnement en
créant une distinction plus grande entre le signal et le bruit ambiant (Feng et Schul,
2006; Patricelli et Blickley, 2006). Des travaux ont d'ailleurs démontré que la
complexité individuelle des chants d'oiseaux était plus grande au début de la saison
de reproduction, C.-à-d. lorsque beaucoup d'individus et d'espèces sont actifs et
qu'ils créent un bruit de fond constant.
1.5 Objectifs et Hypothèses
La présente revue de littérature a permis de constater que la nature et
l'intensité des mécanismes de compensation et d'évitement utilisées par différentes
espèces afin de se soustraire au masque acoustique est variable. Par ailleurs, aucune
étude ne semble avoir tenté de déterminer si les événements de masques
acoustiques sont rares ou communs. Une telle analyse de la situation pourrait venir
renforcer l'intérêt porté aux adaptations comportementales et aux coûts
métaboliques supplémentaires que les espèces vocales pourraient devoir fournir si
les événements de masque acoustique s'avéraient être récurrents.
La probabilité qu'un chant soit masqué correspond au produit de la
probabilité d'un chevauchement entre les composantes spectrales" spatiales et
temporelles du chant et des bruits anthropiques. Le présent projet évaluera les
différentes probabilités de chevauchement (spectral, spatial et temporel), et ce, à
seront évalués à l'aide de données libres d'accès alors que le chevauchement temporel, évalué à l'échelle journalière, sera effectué à partir d'enregistrements faits dans trois paysages distincts : urbain, périurbain et rural.
Nous posons l'hypothèse que la probabilité de masque acoustique sera la plus élevée pour les anoures, mais qu'elle sera insuffisante pour que cet effet soit perçu comme une contrainte majeure chez les populations des espèces vocales des Basses-terres du Saint-Laurent.
ACOUSTIC MASKING OF SIGNALLING SPECIES OF THE ST -LAWRENCE LOWLANDS
Manuscrit soumis à la revue Landscape and Urban Planning.
Louis Desrochers
*,
Raphaël ProulxCanada Research Chair in Ecological Integrity, Département des Sciences de
l'Environnement, Université du Québec à Trois-Rivières, C.P. 500, Trois-Rivières,
Québec, G9A 5R7 (Canada)
*
Corresponding author: louis.desrocherS@ugtr.caKeywords: Anthrophony; Acoustic masking; Bioacoustic, Biophony; Phenology;
2.1 Abstract
How much of the acoustic resource shared by vocalizing animal species is masked by human-induced noise has become a central question in the emerging field of
soundscape ecology. The goal of our study was to evaluate the joint probability that
masking could occur for anuran, bird or stridulating orthopteran species along the
spectral, spatial and temporal dimensions of the acoustic space. We evaluated acoustic
overlap in the dominant frequencies, absolute amplitudes (emitter-receiver distances)
and time-series (temporal match-mismatch) of human- and animal-induced sounds in three landscape settings: urban, peri-urban and rural. Acoustic overlap was evaluated at the day scale during the active signaling period of each taxon. Our results suggest that acoustic masking is unlikely for a vast majority of species in the three taxonomic groups. However, in urban contexts, acoustic masking could be a selective force when coupled to other factors that covary with the amount of noise produced by human activities, such as habitat loss and degradation.
2.2 Introduction
Communication in the animal kingdom is used by individuals to attract females during the reproductive stage, defend terri tories and signal food supply to conspecifics (Gerhardt and Huber 2002, Bradbury and Verenchamps 2011). Communication can be
achieved with visual, olfactory or acoustic signaIs (Endler 1993, Rekwot et al. 2001).
In noisy environments, acoustic communication can be masked, thus forcing individuals
to invest energy into compensatory mechanisms, such as shifting caU frequencies
(Slabbekoom and Peet 2003, Lengagne 2008), vocalizing louder (Cynx et al. 1998,
Brumm 2004, Penna and Hamilton-West 2006), or moving away from the noise source
(Francis et al. 2011, Goutte et al. 2013). Previous studies have reported examples of
signaling adaptations to acoustic masking in anurans (Cunnington and Fahrig 2010), birds (Wood and Yezerinac 2006, Hu and Cardoso 2010) and insects (Shieh et al. 2012, Morley et al. 2014). However, it is not c1ear if a majority of species in these three
meta-analysis by Roca et al. (2016) showed that on1y smaU-bodied bird speCles
increased their dominant frequencies when exposed to anthropogenic noise, whereas
anurans were less prone to such shifts.
To estimate the global importance of acoustic masking events, it is important to
know the probability of spectral, spatial and temporal overlap between human-induced
and anirnal-induced sounds. Acoustic masking events can only occur if the
communication signal is emitted: i) in the same frequency (spectral overlap), ii) close enough to the noise source (spatial overlap) and iii) concurrently to human-induced sounds (temporal overlap) (Patterson and Green 1978, Brumm and S1abbekoorn 2005,
Slabbekoorn et al. 2010). Human-induced sounds generaUy have low dominant
frequency and, as such, should not impact every signaling organisms equaUy
(Slabbekoorn and Peet 2003, Hu and Cardoso 2010). Anurans caUs could be more
susceptible to acoustic masking due to their spectral overlap with human-induced sounds (e.g., Cunnington and Fahrig 2010). Hu and Cardoso (2009) similarly argued that birds singing at high frequency should predominate in urban ecosystems because their signaling frequency is out of the range ofhuman-induced sounds.
Acoustic masking can be particularly important in urban settings because species did not coevolve for a long time with human-induced sounds (Feng and Schul 2007).
Although, data on the intensity level and the frequency spectrum of urban sounds are
relatively easy to obtain (see Wood and Yezerinac 2006, Wei et al. 2016), little is known of the amount of temporal overlap between human-induced sounds and animal-induced sounds. Studies that explored the temporal patterns of vocal organisms were conducted
in natural ecosystems (e.g., Krause et al. 2011, Rodriguez et al. 2014) or did not
explicitly consider the anthrophony component of the soundscape (e.g., Gage and Axel 2014, Gage et al. 2015). Hence, bird and anuran individuals exchanging acoustic signaIs
close to a noise source, and at low frequencies, may avoid acoustic masking by
The aim of the present study was to evaluate the joint probability that acoustic masking could occur for anuran, bird or stridulating orthopteran species along the spectral, spatial and temporal dimensions of the acoustic space. We evaluated acoustic overlap in the dominant frequencies, absolute amplitudes (i.e., emitter-receiver
distances) and acoustic patterns (i.e., temporal match-mismatch) of human- and
animal-induced sounds in three soundscape contexts: urban, peri-urban and agricultural. We paid a particular attention to the daily temporal overlap between human-induced
sounds (anthrophony) and animal-induced sounds (biophony), for which no estimates
currentlyexist.
2.3 Material and methods
To estimate the likelihood of an acoustic masking event, we evaluated
independently the probability of spectral, spatial and temporal overlap between human-induced sounds (anthrophony) and animal-human-induced sounds (biophony). We estimated the probability that species of a given taxonomie group t could experience an acoustic masking event when exposed to anthrophony with the following equation:
(2.1)
where AM is the acoustic masking, SpeO is the spectral overlap probability, SpaO is the spatial overlap probability, TO is the temporal overlap probability.
2.3.1 Spectral overlap
We retrieved a total of 973 audio files from online sound libraries
(http://www .freesound.org, http://www. grsites.com, http://www.LaSonothegue.org,
http://www.soundbible.com, http://www.sound-fishing.net, http://www.
universal-soundbank.com), covering a range of anthrophony sounds (e.g., cars, airplanes,
machinery, railroad crossings, church bell, etc.). Similarly, we extracted audio files
from species identification guides (Macaulay Library [Lab of Ornithology,
Canada, http://www.natureinstruct.org], Frog and Toad caUs [USGS, http://www.umesc.usgs.govl), including 24 anuran caUs (9 species), 511 bird songs (225 species), and 282 orthopteran stridulations (40 species) of species inhabiting the St-Lawrence 10wlands, fonning the regional pool. From each audio file, we extracted the dominant frequency, i.e. the 0.2 kHz band with the highest relative amplitude in the frequency spectrum, using the function "fbands" of the package "Seewave" (Sueur et al. 2008) in R (R Core Team 2016). Then, for each taxonomic group, we assembled 1000 communities containing a fixed number of species randomly chosen from our species pool. Communities were composed of 3 anuran species, 18 bird species and 5 orthopteran species, each species being represented by one randomly chosen audio file. The above species richness values are close to the maximum number of species of a taxonomic group that can be heard vocalizing simultaneously within the study region (Desrochers and Proulx, personal observations). FinaUy, we calculated the spectral overlap between the distribution of dominant anthrophony frequencies and the distribution of dominant biophony frequencies within each simulated acoustic community using the equation proposed by Pianka (1973):
(2.2)
where 0 is the overlap probability, p is the relative frequency of the kth acoustic frequency band in the b distribution of biophony sounds and in the a distribution of anthrophony sounds. We retrieved the mean and the standard deviation of spectral overlaps for each taxonomic group.
2.3.2 Spatial overlap
To estimate the proportion of the territory sustaining levels of anthrophony above an intensity threshold, we determined three coarse land-coyer categories within the St-Lawrence lowlands (Fig. 1): rural, urban and highway. The rural and urban land-cover layers were delineated using the zoning map provided by the Commission de protection du territoire agricole of Québec. We superimposed on this map aU the major
roads and highways and applied the noise attenuation curves of Dooling and Popper (2007) to create 50 dB buffer strips. We set the noise intensity threshold to 50 dB since it represents a behavioural benchmark for many noise-sensitive birds (paton et al. 2012, McClure et al. 2013). By this approach, we assumed that any acoustic community within a metropolitan area or along major traffic roads would experience a 100% probability of spatial overlap. At the scale of the St-Lawrence lowlands, we estimated the probability of spatial acoustic overlap as the proportion of the territory occupied by urban and highway land-covers.
2.3.3 Temporal overlap
To evaluate the probability of temporal acoustic overlap between anthrophony and biophony sounds, we recorded the soundscape at 9 sites near Trois-Rivières (Québec, Canada). Sites were distributed along an urbanization gradient as follows: 2 rural sites, 4 peri-urban sites and 3 urban sites. Urban sites were positioned near major roads and industrial zones. The peri-urban sites were positioned at the margin of urban and rural zones, whereas rural sites were near farms and croplands. Three key landscape elements had to be present in the immediate vicinity of each site: i) wetland ecosystems for anurans, ii) trees and shrubs for birds, and iii) herbaceous open-fields for orthopterans.
AlI 9 sites were recorded simultaneously every one or two weeks, from early April until early October 2014, for a total of 21 visits. At each visit of a site, the soundscape was ,recorded for 24 hours using a Zoom Handy H2N microphone (Zoom Corporation, Japan) in .WAV format at a sampling rate of 44.1 kHz. We resampled 30 seconds every 5 minutes of a 24 h recording without impacting our ability to detect daily temporal acoustic patterns (see Provo st 2010). From those 30-second audio-clips, we summed the absolute amplitudes obtained using the function "spec" in the package "Seewave" (Sueur et al. 2008) in four non-overlapping frequency bands, one for each acoustic typology: anthrophony (0.5 - 1 kHz), anuran biophony (1 - 3 kHz), bird biophony (3 - 5 kHz), orthopteran biophony (5 - 10 kHz). Those bands were determined on the basis of the distributions of anthrophony and biophony dominant frequencies (Fig. 1).
Finally, we ca1culated the temporal overlap between anthrophony and biophony using equation 2, where p is the amplitude of the kth period of the day in the b biophony phenology and in the a anthrophony phenology. Only data from a specific period of the year were analysed for each taxon; from April15th to July 1 st for anurans, from May 1 st
to July 1 st for birds and from July 1 st to October 1 st for orthopterans. At last, we retrieved the mean and the standard deviation of daily temporal overlaps for each landscape category (i.e., rural, peri-urban, urban).
We evaluated if acoustic typologies (i.e., anthrophony, anuran biophony, bird biophony or orthopteran biophony), used for the temporal overlap analysis, matched an expert-based classification of the sounds heard. To do so, we listened 432 30-second audio-clips using a time stratified sampling protocol (i.e. one clip at night, one during the daylight period, two at dawn and two at dusk, per recording day and site). One listener (L. Desrochers) c1assified the sounds heard into four acoustic typologies (anthrophony, anuran biophony, bird biophony or orthopteran biophony) using a 0 to 2 categorical scale; where 0 is an absence of sound, 1 is the presence of weak/punctual sounds and 2 is the presence of medium to loud/continuous sounds. We then fitted separate linear mixed-effect models; each having the summed signaIs' amplitudes (on a log scale) of one acoustic typology as dependent variable and the site as random intercept term. Expert-based scores of the four acoustic typologies were used as the independent variables in each model.
2.4 Results
2.4.1 Spectral overlap
The frequency spectrum of anuran caUs showed a large spectral overlap with human-induced sounds, while the spectrum of orthopteran stridulations bare1y overlapped (Fig. 1). The probability of a spectral overlap between human- and animal-induced sounds was 32%, 26% and 7%, for anuran, bird and orthopteran species, respectively (Table 1).
2.4.2 Spatial overlap
We assumed that a single, yet conservative, noise intensity threshold of 50 dB could be applied equaHy to aH singing animal species of the St-Lawrence lowlands. On this basis, we estimated that about 18% of the region could be impacted by repetitive events of high intensity noise (Fig. 2, Table 1). This figure should be representative of other regions with comparable population density (e.g., ranging from about 20 habitants per Km2 in rural areas up to 1000 habitants per Km2 in metropolitan areas). Along those lines, our approach assumes that the probability of spatial overlap within metropolitan areas, or along highways, is 100%.
2.4.3 Temporaloverlap
We evaluated if acoustic typologies (i.e., anthrophony, anuran biophony, bird biophony or orthopteran biophony), estimated by summing signaIs' amplitudes in predefmed frequency bands, matched an expert-based classification of sounds heard in more than 400 audio-clips. For a given acoustic typology, positive model coefficients consistently indicated a strong association between the prevalence of high intensity sounds, as classified by a human hear, and signaIs' absolute amplitudes (Table 2). The modeHing exercise also revealed a negative relationship between the anthrophony heard and bird biophony, suggesting that birds were singing most intensively when anthrophony was low and vice versa. Conditional determination coefficients (R 2) were aH above 0.5 in three out of four models.
Daily temporal overlap between human-induced sounds and animal vocalizations in peri-urban areas was 87%, 69% and 74% for anuran, bird and orthopteran species respectively (Fig. 3, Table 1). However, we detected substantial differences in temporal overlap between the different landscape categories in anurans (n = 105, F = 26.345,
P value = 5.97e-1o) and birds (n = 79, F = 16.197, P value = 1.38e-06), but not
orthopterans (n = 79, F = 0.504, p value = 0.61). For the former two taxonomic groups,
2.4.4 Probability of acoustic mas king
The probability of acoustic masking calculated using equation 1 was highest for
anuran species with a probability of 5% (Table 1). On the other side, orthopteran species
had the lowest probability of experiencing an acoustic masking event with a probability
of 0.9%. If we assume a spatial overlap of 100% in metropolitan areas, or along
highways, the probability of acoustic masking reaches 27.8%, 17.8% and 5.0% for
anurans, birds and orthopterans, respectively (Table 1).
2.5 Discussion
An increasing number of studies have raised concems about the impact of
human-induced sounds and acoustic masking events on animal communication and, more
generalIy, on animal behavior (Brumm and Slabbekoom 2005, Warren et al. 2006,
Morley et al. 2014, Roca et al. 2016). The present study takes a broader perspective and
asks whether these examples should be considered the rule or the exception. Our results
suggest that acoustic masking per se is unlikely for a majority of species in the three
taxonomic groups and landscape contexts studied. The likelihood of an acoustic masking
event can be significantly increased in urbanized landscapes, especially among anuran
and bird species.
Anurans had a higher probability of experiencing acoustic masking events because
their mating calls overlapped more with human-induced sounds, especially for the
spectral and temporal components. Anurans show a high degree of site fidelity (e.g.,
Berven and Grudzien, 1990, Eigenbrod et al. 2008) and, as such, may not have the
possibility to move away from the noise source, especially in urban areas. However, a
recent meta-analysis revealed that, on average, anuran species exposed to anthropogenic
noise did not shift their calI frequencies out of the noise range (Roca et al. 2016).
A study of the effect of traffic noise on three anuran species showed that traffic noise
had no effect on mate attraction (Cunnington and Fahrig 2013). Thus so far, the sum of
for anurans than acoustic masking effects (Bouchard et al. 2009, Colino-Rabanal and
Lizana 2012, Cosentino et al. 2014).
Temporal overlap between anthrophony and biophony increased along the urbanisation gradient for both birds and anurans. This result is in contradiction with the hypothesis that species could avoid acoustic masking by vocalizing in periods of
low anthrophony (Ficken et al. 1974, Nordt and Klenke 2013). On the other hand,
the observed relationship could be due to change in species composition along the
urbanisation gradient (Clergeau et al. 1998, Garaffa et al. 2009). Urban bird
communities have been found to sing mostly during daytime (Kloubek and Capek 2005),
when human-induced sounds are at their peak. Moreover, daily periods of intense
anthrophony could be extended in urban ecosystems, thus increasing the probability of
temporal overlap independently of other factors. Acknowledging that long concomitant
periods oflow anthrophony and low biophony (e.g. between 2 and 5 am) also contribute
to increase temporal overlap, the 86% probability we calculated for anurans should be
considered a conservative estimate.
Differences in the likelihood of acoustic masking between taxonomic groups were driven by the degree of spectral overlap between anthrophony and biophony. Orthopterans and birds are known to signal at higher frequencies (Meyer and Eisner
1996, Pijanowski et al. 2011) and, for this reason, did not overlap much with
human-induced sounds on the spectral dimension. However, our approach might have
underestimated spectral overlap because of the narrow frequency range of
human-induced sounds used in the simulations (0.5-1 kHz). Previous studies have placed the
upper bound of the anthrophony frequency band at 2 kHz (Skiba 2000), 3 kHz (Goodwin
and Shriver 20 Il) or even 4 kHz (Wood and Yezerinac 2006). While these broader bands may encompass the full range of sounds and frequencies emitted in an urban
context, they do not consider the shape of the signal's power spectrum (i.e., where
energy is most concentrated). Here, we sampled 973 human-induced sounds and
extracted from each audio file the dominant frequency, which by definition contains the
bulk of the energy in the signal. Our approach has the addition al advantage of
As for the other taxa, we note that Napoletano (2004) used frequency bands similar to ours to characterise the signaling frequencies ofbird and orthopteran species.
We defmed spatial overlap as the proportion of a landscape that is continuously subjected to high intensity noise levels. To estimate the probability of spatial overlap, we used an intensity threshold of 50 dB that we then applied to aIl major roads and urban areas of the St-Lawrence lowlands. A simple mIe of thumb would have put the acoustic masking intensity threshold near 60 dB for anurans since they are known to produce sounds over 80 dB (Gerhard 1975, Narins and Hurley 1982) and to have a signal to noise ratio of about 20 dB (J oermann 1988). In bird studies, the threshold for acoustic masking is generally set at 60 dB (e.g., Dooling and Popper 2007). Yet, we expected that our choice of threshold value would yield more conservative estimates of spatial overlap. To give an example, 50 dB is the acoustic intensity of a medium-sized creek at a distance of 15m, or of a wind breeze blowing through trees (Kariel 1990).
We approached acoustic masking under the general assumption that spatial, spectral and temporal overlaps could be estimated independently of each other. However, in real situations, we know by experience that the level of anthrophony is generally higher during the day. We also know that bird songs detection and identification can become challenging in noisy environments (e.g., Martin and Proulx 2016). We detected a similar confounding pattern in the statistical validation of the four acoustic typologies derived from frequency bands: anthrophony (0.5 - 1 kHz), anuran biophony (1 - 3 kHz), bird biophony (3 - 5 kHz), and orthopteran biophony (5 - 10 kHz). While each acoustic typology correlated positively to our expert-based classification of 432 audio-clips, a negative correlation was detected between the level of anthrophony heard and bird biophony. The latter correlation suggests that when signal amplitudes in the 3 - 5 kHz frequency band were low, the amount of anthrophony heard in an audio-clip was high.
Another assumption of our approach was that every speCles had an equal probability of overlapping with human-induced noise (see the Spectral overlap section).
Although many bird species systematically avoid urban areas (Jukomaki and Suhonen
1998, Melles et al. 2003), it seems reasonable to consider the possibility that no
ecosystem in the St-Lawrence Iowlands is safeguarded from human-induced sounds.
2.6 Conclusion
What is the likeIihood that a given individual from' a regional species pool will
experience an event of acoustic masking? Answering this fundamental question is needed to comprehend the impact of human-induced sounds on vocalizing species and to
prioritize conservation efforts. We herein provided conservative estimates of acoustic
masking for three taxonomic groups, which suggest that human-induced sounds are not
of major concem in a majority of cases. Other factors that covary with the amount of
noise produced by human activities, like habitat loss and alteration, could be more
important drivers of species extirpation in urban settings.
We also highlighted that aIl taxonomie groups do not have the same Iikelihood of
acoustic masking, even in urbanized areas. This fmding is key if we are to prioritize
research efforts, especially on anurans. Studies of their acoustic adaptation mechanisms
are still sparse and only few species have aIready been considered (Roca et al. 2016).
Moreover, more efforts should be devoted to eharacterise the noise intensity treshold at
which different animal speeies experience noise deterrence effects. The methodologieal approach and the broader perspective proposed in this study would benefit other
research fields in biology, if only for prioritizing conservation efforts.
2.7 Acknowledgement
The authors acknowledge the fmancial support provided by the Fonds de
recherche du Québec - Nature et technologies (FRQNT) to L.D., the fmancial support
provided by the N atural Sciences and Engineering Research Council of Canada (NSERC) to R.P. and the grants from the "Groupe de recherche interuniversitaire en
2.8 Literature cited
Berven, K. A. and T. A. Grudzien. (1990). Dispersal in the wood frog (Rana sylvatica): implications for genetic population structure. Evolution 44(8): 2047-2056.
Bouchard, J., A. T. Ford, F. E. Eigenbrod and L. Fahrig. (2009). Behavioral responses of northem leopard frogs (Rana pipiens) to roads and traffic: implications for population persistence. Ecology and Society 14(2): 23.
Bradbury, J. W. and S. L. Verenchamps. (2011). Principles of animal communication. 2nd ed. Sunderland (MA): Sinauer Associates.
Brumm, H. (2004). The impact of environmental noise on song amplitude in a territorial bird. Journal of Animal Ecology 73: 434-440.
Brumm, H. and H. Slabbekoom. (2005) Acoustic communication in noise. Advances in the study ofbehavior 35: 151-209.
Clergeau, P., J.-P. L. Savard, G. Mennechez and G. Falardeau. (1998). Bird abundance and diversity along an urban-rural gradient: a comparaive study between two cities on different continents. The Condor 100(3): 413-425.
Colino-Rabanal, V. J. and M. Lizana. (2012). Herpetofauna and roads: a review. Basic and Applied Herpetology 26: 5-31.
Cosentino, B. 1., D. M. Marsh, K. S. Jones, 1. 1. Apodaca, C. Bates, 1. Beach, K. H. Beard, K. Becklin, 1. M. Bell, C. Crockett, G. Fawson, 1. Fjelsted, E. A. Forys, K. S. Genet, M. Grover, J. HoImes, K. Indeck, N. E. Karraker, E. S. Kilpatrick, T. A. Langen, S. G. Mugel, A. Molina, 1. R. Vonesh, R. 1. Weaver and A. Willey. (2014). Citizen science reveals widespread negative effects of roads on amphibian distributions. Biological Conservation 180: 31-38.
Cunnington, G. M. and L. Fahrig. (2010). Plasticity in the vocalizations of anurans in
response to traffic noise. Acta Oecologica 36: 463-470.
Cunnington, G. M. and L. Fahrig. (2013). Mate attraction by male anurans in the presence oftraffic noise. Animal Conservation 16(3): 275-285.
Cynx, J., R. Lewis, B. Travel and H. Tse. (1998). Amplitude regulation ofvocalizations in noise by a songbird, Taeniopygia guttata. Animal Behaviour 56: 107-113. Dooling, R. J. and A. N. Popper. (2007). The effects of highway noise on birds.
Sacramento: The Califomia Department of Transportation, Division of
Eigenbrod, F., S. J. Hecnar and L. Fahrig. (2008). The relative effects ofroad traffic and
forest coyer on anuran populations. Biological Conservation 141: 35-46.
Endler, J. A. (1993). Sorne general comments on the evolution and design of
animal communication systems. Philosophical Transactions: Biological Sciences
340(1292): 215-225.
Feng, A. S. and 1. Schul. (2007). Sound processing in real-world environments:
In Narins, P. M., A. S. Feng, R. R. Fay and A. N. Popper, editors. Hearing and
sound communication in amphibians. New York, NY, USA: Springer.
Ficken, R. W., M. S. Ficken and J. P. Hailman. (1974). Temporal pattern shifts to avoid
acoustic interference in singing birds. Science 183(4126): 762-763.
Francis, C. D., C. P. Ortega and A. Cruz. (2011). Noise pollution filters bird
communities based on vocal frequency. PLoS ONE 6(11): e27052.
Gage, S. H. and A. C. Axel. (2014). Visualization of temporal change in soundscape
power of a Michigan lake habitat over a 4-year period. Ecological Infonnatics
21: 100-109.
Gage, S. H., W. Joo, E. P. Kasten, 1. Fox, and S. Biswas. (2015). Acoustic observations
in agricultural landscapes. In S. K. Hamilton, J. E. Doll, and G. P. Robertson,
editors. The ecology of agricultural landscapes: long-term research on the path to
sustainability. New York, NY, USA:Oxford University Press.
Garaffa, P.
L
,
J. Filloy and M. I. Bellocq. (2009). Bird community responses alongurban-rural gradients: Does the size of the urbanized area matter. Landscape and
Urban Planning 90: 33-41.
Gerhardt, H. C. (1975). Sound pressure levels and radiation patterns of the vocalizations
of sorne North American frogs and toads. Journal of Comparative Physiology
102: 1-12.
Gerhardt, H. C. and F. Huber. (2002). Acoustic communication in insects and anurans:
common problems and diverse solutions. Chicago, IL, USA: Chicago University
Press.
Goodwin, S. E. and G. W. Shriver. (2011). Effects oftraffic noise on occupancy patterns
offorest birds. Conservation Biology 25(2): 406-411.
Goutte, S., A. Dubois and F. Legendre. (2013). The importance of ambient sound level
Hu, Y. and G. C. Cardoso. (2009). Are bird species that vocalize at higher frequencies preadapted to inhabit noisy urban areas? Behavioral Ecology 20: 1268-1273. Hu, Y. and G. C. Cardoso. (2010). Which birds adjust the frequency ofvocalizations in
urban noise. Animal Behaviour 79: 863-867.
Joermann, G. (1988). Masked threshold of auditory midbrain neurons in the frog Rana
ridibunda. Hearing Research 35: 191-200.
Jokimaki, J. and J. Suhonen. (1998). Distribution and habitat selection ofwintering birds
in urban environments. Landscape and Urban Planning 39: 253-263.
Kariel, H. G. (1990). Factors affecting response to noise in outdoor recreational
environments. Le Géographe Canadien 34(2): 142-149.
Kloubek, B. and M. Capek. (2005). Seasonal and diel budgets of songs: a study of savi' s
warbler (Locustella luscinioides). Journal ofOmithology 146: 206-214.
Krause, B., S. H. Gage and W. Joo. (2011). Measuring and interpreting the temporal variability in the soundscape at four places in Sequoia National Park. Landscape Ecology 26: 1247-1256.
Lengagne, T. (2008). Traffic noise affects communication behaviour in a breeding anuran, Hyla arborea. Biological Conservation 141: 2023-2031.
Martin, C. A. and R. Proulx. (2016). Habitat geometry, a step toward general bird community assembly rules in mature forests. Forest Ecology and Management 361: 163-169.
McClure, C. J. W., H. E. Ware, J. Carlisle, G. Kaltenecker and J. R. Barber. (2013). An experimental investigation into the effects of traffic noise on distributions of birds: avoiding the phantom road. Proceedings of the Royal Society B 280: 20132290.
Melles, S., S. Glenn and K. Martin. (2003). Urban bird diversity and landscape complexity: species-environment associations along a multiscale habitat gradient. Conservation Ecology 7(1): 5.
Meyer, J. and N. Eisner. (1996). How well are frequency sensitivities of grasshopper ears tuned to species-specific song spectra? The Journal of Experimental Biology 199: 1631-1642.
Morley, E. L., G. Jones and A. N. Radford. (2014). The importance of invertebrates when considering the impacts of anthropogenic noise. Proceedings of the royal society B 281: 20132683.
Napoletano, B. M. (2004). Measurement, quantification and interpretation of acoustic signaIs within an ecological context. MS Thesis. Michigan State University, Department of Zoology. East Lansing, Michigan, USA.
Narins, P. M. and D. D. Hurley. (1982). The re1ationship between caU intensity and fonction in the Puerto rican coqui (Anura: Leptodactylidae). Herpetologica 38(2): 287-295.
Nordt, A. and R. Klenke. (2013). Sleepless in town - drivers of the temporal shift in
dawn song in urban european blackbirds. PLoS ONE 8(8): e71476.
Paton, D., F. Romero, 1. Cuenca and J. C. Escudero. (2012). Tolerance to noise in 91 bird species from 27 urban gardens of Iberian Peninsula. Landscape and Urban Planning 104: 1-8.
Patterson, R. D. and D. M. Green. (1978). Auditory masking. In E. C. Carterette and M. P. Friedman, editors. (1978). Handbook of perception IV: Hearing. New York, NY, USA: Academic Press.
Penna, M. and C. Hamilton-West. (2006). Susceptibility of evoked vocal response to nOIse exposure in a frog of the temperate austral forest. Animal Behaviour 74: 45-56.
Pianka, E. R. (1973). The structure of lizard communities. Annual Review of Ecology and Systematics 4: 53-74.
Pijanowski, B. C., L. 1. Villanueva-Rivera, S. L. Dumyahn, A. Farina, B. L. Krause,
B. M. Napoletano, S. H. Gage and N. Pieretti. (2011). Soundscape ecology: the science of sound in the landscape. BioScience 61 (3): 203-216.
Provost, M-C. (2010). Dynamique de la biodiversité dans la Serra do Itajai, Brésil:
une approche bioacoustique de la conservation. MS Thesis. Université de
Montréal. Montréal, Canada.
Quantum GIS Development Team. (2014). Quantum GIS Geographic information
system, Version 2.2.0. Open source geospatial foundation project.
http://ggis.osgeo.org
R Core Team, (2016). R: A language and environment for statistical computing.
Rekwot, P. 1., D. Ogwu, E. O. Oyedipe and V. O. Sekoni. (2001). The roles of
pheromones and biostimulation in animal reproduction. Animal Reproduction
Science 65: 151-170.
Roca, 1. T., L. Desrochers, M. Giacomazzo, A Bertolo, P. Bolduc, R. Deschesnes, C. A
Martin, V. Rainville, G. Rheault and R. Proulx. (2016). Shifting song frequencies
in response to anthropogenic noise: a meta-analysis on birds and anurans.
Behavioral Ecology 27(3): 685-694.
Rodriguez, A, A Gasc, S. Pavoine, P. Grandcolas, P. Gaucher and J. Sueur. (2014).
Temporal and spatial variability of animal sound within a neotropical forest.
Ecological informatics 21: 133-143.
Shieh, B.-S., S.-H. Liang and Y.-W. Chiu. (2015). Acoustic and temporal partitioning
of cicada assemblage in city and mountain environments. PLoS ONE 10(1):
e0116794.
Skiba, R. (2000). Possible "rain calI" selection in the chaffinch (Fringilla coelebs)
by noise intensity - an investigation of a hypothesis. Journal fiir Ornithologie
141: 160-167.
Slabbekoorn, H. and M. Peet. (2003). Birds sing at a higher pitch in urban noise. Nature
424: 267.
Slabbekoorn, H., N. Bouton, J. van Opzeeland, A Coers, C. ten Cate and A. N. Popper.
(2010). A noisy spring: the impact of globally rising underwater sound levels on
fish. Trends in Ecology and Evolution 25: 419-427.
Sueur, J., Aubin, T., Simonis, C., (2008). Seewave: a free modular tool for sound
analysis and synthesis. Bioacoustics 18: 213-226.
Warren, P. S., M. Katti, M. Ermann and A. Brazel. (2006). Urban bioacoustics: it's not
just noise. Animal Behaviour 71: 491-502.
Wei, W., T. Van Renterghem, B. De Coensel and D. Botteldooren. (2016). Dynamic
noise mapping: A map-based interpolation between noise measurements with high
temporal resolution. Applied Acoustics 101: 127-140.
Wood, W. E., S. M. Yezerinac. (2006). Song sparrow (Melospiza melodia) song varies
2.9 Tables
Table 1: Spectral, spatial and temporal probability (± 1 SE) of acoustic overlap for anuran, bird and orthopteran species of the St-Lawrence lowlands. Acoustic masking is
defmed as the cross-product of spectral, spatial and temporal probabilities of acoustic overlap between human- and animal-induced sounds.
Overlap Anurans Birds Orthopterans
Spectral 0.320 (0.008) 0.259 (0.005) 0.068 (0.004)
Spatial 0.180 0.l80 0.l80
Temporalt 0.866 (0.022) 0.689 (0.027) 0.738 (0.017) Acoustic masking 0.050 (0.0025) 0.032 (0.0019) 0.009 (0.0007) Acoustic masking* 0.278 (0.0140) 0.178 (0.0104) 0.050 (0.0040)
t Overlap probability of peri-urban landscapes.
:j: Acoustic masking calculated using a spatial overlap value of 1.000, value that we assumed in urban areas and along major roads.
Table 2: Coefficient estimates (± 95% confidence interval) of four separate mixed-effect models, one for each acoustic typology (frequency band): anthrophony (0.5 - 1 kHz), anuran biophony (1 - 3 kHz), bird biophony (3 - 5 kHz), orthopteran biophony (5 - 10 kHz). Signal amplitudes were automatically extracted for each frequency band in a subset of 432 audio-clips. Sounds heard in these audio-clips were classified by one human listener into four categories and scored on a semi-quantitative scale of intensity:
o -
absent, 1 - weaklpunctual and 2 - highlcontinuous. AlI predictor variables (sound categories) were used to fit models, but only coefficients with confidence intervals not overlapping zero are reported. The sound intensity level "absent" was set as the reference category.Category Anthrophony Anuran biophony Bird biophony Orthopteran biophony (R2 = 0.60t) (R2 = 0.54t) (R2 = 0.50t) (R2 = 0.25t) Intercept 21.542 (0.546) 22.765 (0.748) 22.900 (0.814) 21.996 (0.432) Anthrophony heard Weak: -1.131 (0.440) High 0.931 (0.220) -1.074 (0.496) Anuran heard: Weak: High 1.237 (0.326) Bird heard: Weak: High 0.738 (0.406) Orthoptera heard: Weak: High 0.487 (0.276) t Conditional R2.
2.10 Figure legends
Figure 1: Dominant frequency distribution of 157 human-induced sounds (Anthrophony), 24 anuran caUs (9 species), 511 bird songs (225 species), and 2820rthopteran stridulations (40 species). The samples were representative of the type of human activities and the pool of vocalizing species heard in the St-Lawrence lowlands (Québec, Canada). The horizontal dashed lines (0.5 kHz, 1 kHz, 3 kHz, 5 kHz and 10 kHz) delineate the four frequency bands used to extract temporal acoustic patterns of anthrophony and biophony.
Figure 2: Map of urban and highway areas (in grey) within the St-Lawrence lowlands (in red) that are exposed to sustained levels of human-induced noise above the 50 dB threshold. AlI the rural areas (in green) were assumed to be exposed to human-induced noise weaker than the intensity threshold. There are three major urban centers along the St-Lawrence River (in blue): Montréal, Trois-Rivières and Québec cities.
Figure 3: Mean daily temporal overlap (± 1 SD) between the anthrophony (0.5 - 1 kHz) time-series and those of anuran biophony (1 - 3 kHz), bird biophony (3 - 5 kHz) or orthopteran biophony (5 - 10 kHz), in different landscape categories along an urbanization gradient. The numbers in parentheses represent the total of temporal overlaps available in each landscape category.
>-N
UT""" C IDa ::::JT""" C'"&00
...
C(O CU CE-.:t
o
"'ON...
en
Figure 1 1 1 1 1 1 1 1 1 1 1 ---~---~---_. o o,
---~---o 1 ______ • _ _ _ _ _ _ _ _ __ 1_ _ _ _ _ _ _ _ _ _ _ _ _ _ _____ L ______ .. o Anthrophony 1 1 1 1 -'__ :::--1--:::::::-[:-:::::
Anuran Bi'rd OrthopteraSounds classes
Legend
D St-Lawrence lowlands • Urban and Highway areas • Rural areas
D
Lakes and Rivers.
...
\.Figure 2
o
50 100 kmo