HAL Id: tel-02175189
https://tel.archives-ouvertes.fr/tel-02175189
Submitted on 5 Jul 2019
HAL is a multi-disciplinary open access archive for the deposit and dissemination of sci-entific research documents, whether they are pub-lished or not. The documents may come from teaching and research institutions in France or abroad, or from public or private research centers.
L’archive ouverte pluridisciplinaire HAL, est destinée au dépôt et à la diffusion de documents scientifiques de niveau recherche, publiés ou non, émanant des établissements d’enseignement et de recherche français ou étrangers, des laboratoires publics ou privés.
Politique budgétaire et développement inclusif : quelle
contribution de la décentralisation en Côte d’Ivoire ?
Tiangboho Sanogo
To cite this version:
Tiangboho Sanogo. Politique budgétaire et développement inclusif : quelle contribution de la décen-tralisation en Côte d’Ivoire ?. Economies et finances. Université Clermont Auvergne, 2018. Français. �NNT : 2018CLFAD007�. �tel-02175189�
1
Université Clermont Auvergne, Clermont-Ferrand, France
Faculté des Sciences Économiques et de Gestion
École Doctorale des Sciences Économiques, Juridiques et de Gestion
Centre d’Études et de Recherches sur le Développement International
(CERDI)
Titre : Politique Budgétaire et Développement Inclusif : Quelle contribution de la Décentralisation en Côte d’Ivoire ?
Title: Fiscal Policy and Inclusive Growth: How can Decentralization contribute in Côte d’Ivoire?
Thèse Nouveau Régime
Pour l’obtention du titre de Docteur ès Sciences Économiques
Par
Tiangboho Sanogo
Sous la direction de Monsieur Jean François BRUN et Monsieur Zié Ballo
Composition du Jury
Michel Normandin Professeur, HEC Montréal, Canada Rapporteur
Antonio Savoia Senior Lecturer, the University of Manchester, United Kingdom Rapporteur
Jean-François Brun Maître de Conférence HDR, Université Clermont Auvergne, CERDI Directeur
Zié Ballo Professeur, Université Félix Houphouët Boigny, Côte d’Ivoire Directeur
Mary Françoise Renard Professeur, Université Clermont Auvergne, CERDI Suffragant
2
L’Université Clermont Auvergne n’entend donner aucune approbation ou improbation aux opinions émises dans cette thèse. Ces opinions doivent être considérées comme propres à leur auteur.
3
A feu mon père. Voilà papa, notre projet est enfin terminé. Merci infiniment pour tout. A mes frères, mes sœurs ainsi qu'à mes autres proches qui me sont chers.
4
REMERCIEMENTS
/
Acknowledgements
La rédaction de ce projet apparait à priori comme un travail individuel, cependant, la réalisation de cette thèse n’aurait été possible sans le concours de nombreuses personnes à qui je voudrais ici exprimer toute ma gratitude.
Je remercie très sincèrement mes directeurs de thèse Messieurs Jean-François Brun et Zié Ballo qui ont dirigé mes travaux durant ces années de thèse. Je veux leur exprimer ma profonde gratitude pour l’encadrement de qualité, les conseils et la rigueur scientifique dont j’ai bénéficié tout au long de cette thèse. J’ai apprécié la confiance qu’ils m’ont accordé en me laissant l’autonomie nécessaire à la rédaction de cette thèse.
Mes remerciements s'adressent ensuite à l'ensemble du corps professoral du CERDI pour la formation dispensée au cours de toutes les années que j'y ai passées. Je voudrais aussi exprimer ma reconnaissance au personnel administratif notamment à Martine Bouchut et Chantal Brige-Ukpong, pour leur soutien sans lequel la réalisation de cette thèse aurait été bien plus difficile. Je voudrais aussi remercier tous les membres du jury pour avoir accepté d’en faire partie et de me faire l’honneur d’assister à cette soutenance, notamment les rapporteurs, Messieurs Michel
Normandin et Antonio Savoiaet la présidente de Jury, Madame Mary-Françoise Renard.
Mes remerciements s’adressent également à tous mes camarades et devanciers du CERDI notamment à Sekou Keita et René Tapsoba pour leur soutien et leur disponibilité.
Je n’oublie pas aussi mes compatriotes, notamment mes amis de l’Association Ivoirienne en Auvergne, que j’ai par ailleurs eu l’honneur de présider.
Je rends un hommage particulier à ma famille et plus particulièrement à ma mère Konaté Tienourougo et à mon épouse Siata Bamba pour leur soutien indéfectible et leur patience. Je n’oublie pas également la joie et l’abnégation qu’à apporter la naissance de notre fille Neila.
5
TABLE
OF
CONTENTS
Summary ... 7
GENERAL INTRODUCTION ... 8
PART I: FISCAL DECENTRALIZATION, ACCESS TO PUBLIC SERVICES, AND INEQUALITIES ... 17
CHAPTER 1: DOES FISCAL DECENTRLIZATION ENHANCE CITIZENS’ ACCESS TO PUBLIC SERVICES AND REDUCE POVERTY? EVIDENCE FROM CÔTE D’IVOIRE ... 18
Abstract ... 19
1. Introduction ... 20
2. Background ... 24
2.1 Fiscal decentralization in Côte d’Ivoire ... 24
2.2 Public service delivery and poverty trends in Côte d’Ivoire ... 28
3. Empirical analysis ... 31
3.1 Data ... 31
3.2 Model specification ... 35
4. Empirical results and implications ... 38
5. Conclusion ... 53
CHAPTER 2 : L’AUTONOMIE FINANCIERE DES COLLECTIVITES TERRITORIALES CONTRIBUE-T-ELLE A REDUIRE LES INEGALITES DE REVENU EN CÔTE D’IVOIRE ? .... 60
Abstract ... 61
1. Introduction ... 63
2. Cadre institutionnel de la décentralisation en Côte d’Ivoire ... 67
2.1 Evolution du cadre institutionnel ... 67
2.2 La gestion pratique des ressources transférées aux CT ... 69
2.3 L’évolution des réformes de la clé de répartition de l’impôt rétrocédé ... 73
3 . Faits stylisés : La ville de Daloa ... 78
4 Méthodologie... 83
4.1 Données et mesures des principales variables ... 83
4.2 Modèle et procédure d'estimation ... 89
4.3 Stratégie d’identification ... 91
5 Résultats ... 94
6 Conclusion ... 101
Annexes ... 103
PART II: FISCAL DECENTRALIZATION AND DOMESTIC REVENUE MOBILIZATION ... 107
CHAPTER 3: EFFECT OF CENTRAL TRANSFERS ON MUNICIPALITIES’OWN REVENUE MOBILIZATION: DO CONFLICT AND LOCAL REVENUE MANAGEMENT MATTER? ... 108
6
1. Introduction ... 110
2. Intergovernmental transfers and local revenue mobilization in the literature ... 112
3. Fiscal decentralization in Côte d’Ivoire ... 116
3.1 Overview of Côte d’Ivoire ... 116
3.2 Structure of local revenue in Côte d’Ivoire ... 117
3.3 Transfers from central government and municipality own revenue ... 121
4. Empirical analysis ... 125
4.1 Data ... 125
4.2 Summary and Descriptive statistics... 127
4.3 Choice of estimator and econometric specification ... 129
5. Main results ... 132
5.1 Estimation results ... 132
5.2 GFE patterns and robustness ... 140
6. Conclusion ... 142
CHAPTER 4: CAN DECENTRALIZING PROPERTY TAX RESPONSIBILITIES TO SUBNATIONAL GOVERNMENTS INCREASE CITIZENS COMPLIANCE? ... 147
Abstract ... 148
1. Introduction ... 149
2. Literature Review ... 154
3. Property tax base and assessing property in Côte d’Ivoire ... 156
4. Stylized facts ... 159
5. Data and Statistical Analysis ... 162
5.1 The Data ... 162 5.2 Statistical Analysis ... 163 6. Econometric Analysis ... 167 6.1 Econometric Model ... 167 6.2 Empirical Results ... 169 7. Conclusion ... 180 GENERAL CONCLUSION ... 186 Bibliography ... 191
7
Summary
An effective and efficient public-sector reform enhances government capability to raise domestic revenue for prioritized spending. It also contributes to strengthening the government capacity to manage public resources more effectively and deliver public services. In pursuing these objectives, fiscal decentralization, the devolution of taxing and spending powers to lower levels of government, has become a key public-sector reform in many countries. Given such high stakes, a growing economic literature is focusing on how to better understand the challenges developing countries face in implementing fiscal decentralization reforms. The present thesis adds to this effort through four contributions shedding light on specific issues related to fiscal decentralization.
Chapter 1 analyses whether and how municipal revenue mobilization could enhance citizens’ access to public services and reduce poverty. The results indicate that increasing municipal-raised revenues improve access to public services and reduce poverty. This effect works mainly through enhancing access to education than on access to health, especially in less ethnically diverse localities and in urban zones. Chapter 2 investigates the effect of municipal revenue autonomy on inequalities within sub-national governments. We conclude that higher local revenue autonomy reduces income inequalities within localities, which effect differs between the type of revenue and jurisdiction considered. Chapter 3 analyzes the impact of the transfers from central government to municipalities on the revenue mobilization by municipalities. Our results show that increasing central transfers to subnational government boost revenue mobilization by municipalities for both tax revenue and non-tax revenue. The effect of transfers is found to be higher for tax revenue than for non-tax revenue. Finally, we examine whether the relationship between government responsiveness and property tax compliance differs according to the level of government in chapter 4. The results conclude that responsiveness by municipalities is found to have a greater correlation with property tax compliance than those by central governments. The results of our analysis bear important policy implications to strengthen public sector, especially in sub-Saharan Africa.
Keywords: fiscal decentralization, local tax and non-tax revenues, multidimensional poverty, local development, sub-national governments, inequalities, poverty, Côte d’Ivoire.
8
GENERAL INTRODUCTION
The performance of public sector remains a major concern for inclusive growth, especially for developing countries. Indeed, effective and efficient public-sector reform enhances government capability to raise domestic revenue for prioritized spending. It also contributes to strengthening the government capacity to manage public resources more effectively and deliver public services. In pursuing these objectives, fiscal decentralization defined as the devolution of taxing and spending powers to lower levels of government, has become a key public-sector reform in many countries. According to the World Bank, fiscal decentralization contributes at boosting government efficiency both in public service delivery and domestic revenue mobilization (World Bank, 2000). Many developing countries have implemented fiscal decentralization reforms with an explicit objective of increasing public sector efficiency. Countries have been devolving further responsibilities of revenue mobilization to subnational governments and providing them with more spending powers.
Although reasons for decentralization remain ultimately country-specific, supported by dissatisfaction with the results of centralized economic planning, there are two main rationales justifying the transfer of revenue and expenditure responsibilities to lower tiers of governments. First, the allocative efficiency, to which decentralization brings decision-making closer to citizens and thus helps alleviating the informational asymmetry (Hayek, 1945; Oates, 1993). This fosters higher accountability from policymakers and increases compliance from taxpayers. The combination of these effects would lead to a better match between citizens' preferences and public policies and enhances local own revenue mobilization.
Second, the productive efficiency, to which the benefits of decentralization stem from inter-jurisdictional competition that triggers higher responsiveness to local needs, increasing efficiency of public services on the supply side (Tiebout, 1959). Based on the mobility of
9
citizens across jurisdictions and the resulting electoral pressures, decentralization lead to higher accountability of local governments in service delivery (Bardhan & Mookherjee, 2005). Most developing countries carried out reforms to involve subnational governments in public service provision.
However, in these countries, the level of literacy and political awareness among citizens is often too limited to apply sufficient political pressure, and local authorities are likely to be under pressure from elites and prone to corruption. Fiscal decentralization can also induce significant challenges for macroeconomic management. First, the devolution of substantial spending powers to subnational governments may hamper the central government’s ability to contain public spending through fiscal consolidation processes. Second, the assignment of revenue raising responsibilities across distinct levels of governments may deprive the central government of tax tools for macroeconomic management. Therefore, the most frequently observed in developing countries is an incomplete implementation of fiscal decentralization reforms, where there is a substantial gap between countries “announcement” of embarking and the real implementation of the process. In many countries, the devolution of responsibilities is complemented by intergovernmental transfers to bridge the gap between revenue and expenditure assignments.
One key resulting challenge is to design an efficient fiscal decentralization system that enhances accountability in the public service delivery process. Countries are struggling to increase the access to public services without increasing income inequalities both between and within subnational governments. This is complicated by the sharing responsibility in delivering public service by different levels of governments. Responsibilities in raising local taxes and delivering services such as education, health, roads and drinking water have been devolved to municipalities, though the central government still plays the leading role in ensuring citizens’ access to services.
10
A second challenge remains to design a solid system of intergovernmental transfers that consistently bridges the gap between tax and spending responsibilities without discouraging tax effort by subnational governments.
The third challenge facing countries in fiscal decentralization process is to define an appropriate local tax bases that ensure a considerable revenue autonomy to local governments, which prevents at the same time, distortive tax competition and accounts for macro fiscal imbalances. This thesis discusses under what conditions, considering the specificities of developing countries, improved public-sector performance through fiscal decentralization can help deal with these three challenges. The most important pillars of fiscal decentralization which are revenue and expenditure devolution to subnational governments are considered. The dissertation explores factors affecting the reform of fiscal decentralization process in Côte d’Ivoire to inform policymaking in developing countries.
The thesis is divided into two parts and each part consists of two chapters.
We first explore how increasing tax raising and spending responsibilities to subnational governments could boost access to public service and reduce income inequalities. The second part assesses how fiscal decentralization in developing countries can promote additional own-revenue mobilization by subnational governments taking Côte d’Ivoire country case studies.
The first part of this thesis comprises two chapters focusing on the distributional effect of fiscal decentralization. The first chapter analyses whether and how municipal revenue mobilization could enhance citizens’ access to public services and reduce poverty. While the chapter 2 deals with the internal income inequalities of fiscal decentralization.
The first chapter provides answers to the question of whether fiscal decentralization enhance citizens’ access to public services and reduce poverty. The effectiveness of fiscal decentralization in improving public service delivery and reducing poverty is much debated.
11
The empirical literature has mostly focused on poverty reduction using cross-country analysis. This chapter analyses whether, and how, the devolution of revenue raising responsibilities to Côte d’Ivoire’ municipalities enhances access to public services and contributes to reducing poverty. Local revenue sources that reflect municipalities’ autonomy in decision-making are considered to measure revenue decentralization. An adjusted multidimensional poverty index for access to public services and a headcount poverty index are also calculated at the local level using the Household Living Standard Survey. The empirical analysis uses a grouped fixed effect approach, combined with a two-stage least squares methodology with panel corrected standard errors clustered by departments to address both time-varying heterogeneity and local revenue endogeneity.
Our study finds that increased local revenue positively affects access to public services and reduces poverty. However, there is evidence that revenue decentralization has a more robust effect on access to public service, than on poverty. This effect seems to work mainly through enhanced access to education more than access to health, water, and sanitation services. Interestingly, our results indicate that municipalities are more likely to improve access to public services in less ethnically diverse localities and in urban zones. The study shows that the conflict has compounded the existing problems of access to public services with no statistically significant effect on poverty.
Do greater municipal revenue autonomy lead to lower inequality in the income distribution within localities in Côte d’Ivoire? This is the question discussed in chapter 2.
In the theory of fiscal federalism, there is a relative consensus on the leading role of central government in conducting the distributional function (Musgrave 1970; Oates 1972). Based on the assumption of taxpayers mobility, different redistributive policies under the responsibilities of subnational governments may lead to disruptive tax competition between jurisdictions and
12
induce substantial loss of efficiency (Prud’homme, 1995). However, in developing countries such as Côte d’Ivoire, the inter-jurisdictional mobility is constrained, so that fiscal decentralization can lead to greater equality in income distribution (R M Bird & Vaillancourt, 2008). For example, Meloche (2012) finds that fiscal decentralization reduces inequalities at subnational level.
This chapter first, compares the tax raising responsibilities allocated by legislation of fiscal decentralization in Côte d’Ivoire with the real practice. Second, an analysis of the impact of revenue autonomy on the income inequalities is undertaken, using three indices: An adjusted Gini index, the coefficient of variation, and the Theil index for the 58 departments in Côte d’Ivoire.
The chapter concludes that the scope for local governments is highly constrained contrary to the predispositions of the legislation, so that there is a large vertical fiscal imbalance. This important gap between the institutional framework and the real conduct of fiscal decentralization highlights a need for clarification of the roles and responsibilities. The empirical results show also that higher local revenue autonomy reduces income inequalities within localities. The impact differs between the type of revenue and the region considered. Higher local tax revenue seems to reduce inequalities while the effect of non-tax revenue remains mitigated. The conflict is found to have worsened the inequalities in the northern area compared to the southern regions.
In the second part of the thesis, the chapter 3 deals with the intergovernmental relationship, the effects of central grants on local own revenue mobilization. The main determinants of property tax compliance, which appears as the main source of local own revenue is investigated in Chapter 4.
13
The third chapter analyzes the effect of transfers from central government to municipalities on the revenue mobilization by municipalities in Côte d’Ivoire over the period 2001-2014. In the recent years, a growing literature has highlighted the potential (dis)incentive effect of transfers from central government to local governments on local revenue mobilization. The dependence of local governments on central transfers has led to a number of effects which have been analyzed in the literature (E. Caldeira & Rota-Graziosi, 2014; Cyan, Martinez-Vazquez, & Vulovic, 2013; B. Knight, 2002). Local governments may be discouraged from collecting their own revenue, thus reducing their financial autonomy and accountability to citizens. Transfers are often tied to specific projects, with limited decision-making responsibilities for local authorities (Rajaraman & Vasishtha, 2000). However, central transfers can also stimulate local revenue mobilization when the distributional formula includes local tax effort as a determinant of the amount of transfers (Bahl, 1999). In Côte d’Ivoire, where the process of fiscal decentralization started in the 1980s, transfers represent nearly 80 percent of total local revenue in some municipalities (DDLD, 2014). This dependence on central transfers may have increased with the conflict that the country experienced from 2001 to 2008. Moreover, the conflict may have eroded the local tax base and affected the capacity of municipalities to raise taxes. The purpose of this chapter is to look at the impact of central transfers on revenue mobilization by municipalities in Côte d’Ivoire, and to explore the channels through which they operate. The hypothesis is that the effect of transfers differs between the collection of municipal tax revenue from the mobilization of municipal non-tax revenue.
The analysis is based on a new carefully-constructed dataset covering the conflict and post conflict periods. A two-stage least squares estimator is combined with the Grouped Fixed Effects estimator to address a potential endogeneity bias and to allow for unobserved heterogeneity varying over time. The results show that central transfers contribute to boosting revenue mobilization by municipalities for both tax revenue and non-tax revenue. The effect of
14
transfers is found to be higher for tax revenue than for non-tax revenue. The conflict eroded the capacity of municipalities to raise revenue.
The fourth chapter investigates factors determining property tax compliance behavior in Côte d’Ivoire municipalities. Property taxes are considered to have a great potential to finance equitable development and reduce governments’ dependence from international aids, especially in developing countries (Ali, Fjeldstad and Sjursen, 2014; IMF, 2017). Raising property taxes remains also part of fiscal consolidation efforts to create fiscal space and constitutes a priority for most Sub-Saharan African (SSA) countries (IMF, 2017). Despite the recognition of this untapped resource available, few countries have yet significantly raised property taxes (Norregaard, 2013). One explanation is that effective implementation of a property tax requires a sizable up-front investment in administrative infrastructure and strong technical capacity. However, many studies recently conclude that low property tax efforts in these countries are explained by widespread tax avoidance and evasion (Ali et al., 2014; Keen et al., 2015). Therefore, explaining determinants for successful property tax reform and ultimately finding ways for strengthening compliance has become a greater priority. According to Timmons and Garfias, (2015), a central challenge, therefore, is to create conditions for increasing citizens’ compliance with property tax. Against this backdrop, previous studies explaining tax compliance mainly focus on the nature of the fiscal contract, the economic deterrence, and the political legitimacy theories by considering all taxes mostly in developed countries. Only a few has empirically tested how government responsiveness shapes citizens' compliance toward property taxation in developing countries. In addition, the literature does not investigate whether it makes sense to distinguish the effect of subnational governments’ responsiveness from those of central governments on property tax compliance. This issue is important in most sub-Saharan African countries such as Côte d’Ivoire for many reasons. One is that, although property tax has many characteristics of being an adequate local tax, its collection is under the
15
responsibility of the central government, leading to a confusion about responsibilities. Therefore, the first important question the chapter investigates is whether increasing the role of municipalities in property tax collection would boost property tax compliance1. Second, as
Timmons and Garfias (2015) argue, the simplification of tax system determines the relationship between citizens’ compliance with tax and governments.
Thus, the chapter examines whether the effect of government’s responsiveness on property tax compliance attitudes differs according to the level of government considered. It also estimates the impact of citizens understanding of tax system on property tax compliance attitude.
Using the fifth round of Afrobarometer survey data for Côte d’Ivoire, and a multilevel mixed-effects logit model, the chapter examines whether the effect of government responsiveness on property tax compliance, differs between central government and municipalities. The chapter also investigates the role played by the quality of institutional environment in exacerbating or in alleviating such effect, and analyses the impact of citizens understanding of property tax system on their compliance attitude with its taxation.
First, the chapter concludes that increased public service provision (fiscal contract) boosts property tax compliance for public services provided both by central government and municipalities. Second, citizens’ trust in municipalities and central tax administration increases the likelihood of citizens having compliant attitude with property taxation. However, individual’s satisfaction with service provision by municipalities is found to have a greater effect on property tax compliance than those of services provided by central governments. Third, the study suggests that citizen understanding of tax system increases the likelihood of their compliance with property tax. This highlights the need for strengthening awareness of property tax and simplifying property tax system. Fourth, the effect of corruption is found to be more important for municipalities than central government consistently with the literature of
16
fiscal federalism to which, local authorities are likely to be under pressure from elites and prone to corruption.
Ultimately, although decentralizing property tax responsibilities to municipalities might increase citizens’ compliance, it, therefore, remains crucial to address the issue of corruption that might occur from property-owned local elites.
17
PART I: FISCAL DECENTRALIZATION, ACCESS TO PUBLIC
SERVICES, AND INEQUALITIES
18
CHAPTER 1
2: DOES FISCAL DECENTRLIZATION ENHANCE
CITIZENS’ ACCESS TO PUBLIC SERVICES AND REDUCE POVERTY?
EVIDENCE FROM CÔTE D’IVOIRE
19
Abstract
Fiscal decentralization has been implemented in many countries with an explicit objective of improving public service delivery and reduce poverty. However, its effectiveness in achieving these goals are much debated and the empirical literature has mostly focused on poverty reduction using cross-country analysis.
This chapter analyses whether, and how, the devolution of revenue raising responsibilities to Côte d’Ivoire’ municipalities enhances access to public services and contributes to reducing poverty. Local revenue sources that reflect municipalities’ autonomy in decision-making are considered to measure revenue decentralization. An adjusted multidimensional poverty index for access to public services and a headcount poverty index are also calculated at the local level using the Household Living Standard Survey. The empirical analysis uses a grouped fixed effect approach, combined with a two-stage least squares methodology with panel corrected standard errors clustered by département to address both time-varying heterogeneity and local revenue endogeneity.
Our study finds that increased local revenue positively affects access to public services and reduces poverty. However, there is evidence that revenue decentralization has a more robust effect on access to public service, than on poverty. This effect seems to work mainly through enhancing access to education more than access to health, water, and sanitation services. Interestingly, our results indicatethat municipalities are more likely to improve access to public services in less ethnically diverse localities and in urban zones. The study shows that the conflict has compounded the existing problems of access to public services with no statistically significant effect on poverty.
Keywords— fiscal decentralization, local tax and non-tax revenues, multidimensional poverty, Local development, Côte d’Ivoire
20
1. Introduction
Over the past decades, fiscal decentralization has been implemented by an increasing number of African countries, with an explicit objective of improving public service delivery, becoming thus a key public-sector reform (Gradstein, 2017; Kis-Katos & Sjahrir, 2017; Ramírez, Díaz, & Bedoya, 2017; Rodríguez-Pose & Ezcurra, 2010)3. This interest has stemmed largely from a
belief that decentralizing revenue raising and spending decisions to sub-national governments enhance accountability in the service delivery process (Hayek, 1945; Oates, 1993; Tiebout, 1959). However, in these countries, where the level of literacy and political awareness among citizens is often too limited to apply sufficient political pressure (Bardhan & Mookherjee, 2005), local authorities are likely to be under pressure from elites (R. Bird & Rodriguez, 1999) and prone to corruption (Prud’homme 1995). In sub-Saharan Africa, there is little empirical evidence on the effects of fiscal decentralization on poverty and the delivery of public services
such as education and health, especially focusing on one country4.
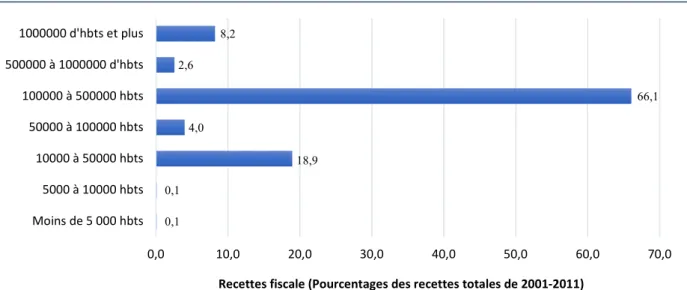
This chapter contributes to the literature by analyzing whether revenue decentralization, measured as the ratio of municipal own revenues to total revenues, improves the access to public services and reduces poverty in Côte d’Ivoire conflict setting, over the period 2001-2011.
The issue is particularly relevant for Côte d’Ivoire, where 35% of the population are deprived of basic services (Alkire & Santos, 2014) and where marked income disparities exist among regions5. The country is an interesting case study for three main reasons. One, responsibilities
in raising local taxes and delivering services such as education, health, roads and drinking water have been devolved to municipalities, though the central government still plays a crucial role
3Although the implementation of fiscal decentralization reforms often remains incomplete (Joanis, 2014) and there
is a difference between countries “announcement” of embarking and the real implementation of the process.
4 The term poverty refers only to monetary poverty in this paper.
5 While there are municipalities where internally collected revenues represent almost 90% of their total revenue,
21
in ensuring citizens’ access to services. Second, the country has a large ethnic diversity of different culture and preferences, which heterogeneity might be of interest for fiscal decentralization reforms. In addition, the relationship between fiscal decentralization and poverty is particularly ambiguous in a fragile context such as Côte d’Ivoire, as the conflict, that the country experienced, has compounded the existing problems of access to public services and has potentially increased the role of local authorities in most affected areas.
In the theoretical literature, the overall effects of decentralization on public service delivery and poverty are ambiguous. One strand of this literature argues that the benefits of decentralization stem from inter-jurisdictional competition that should result in higher responsiveness to local needs (Tiebout, 1959). Through this idea, based on the mobility of citizens across local jurisdictions and the resulting electoral pressures, decentralization enhances accountability of local governments in the service delivery (Bardhan & Mookherjee, 2005). In developing countries, this mechanism might not work because citizen’s mobility is often limited (Bardhan, 2002a). Decentralization is also claimed to improve service provision efficiency by providing informational advantages to local governments (Hayek, 1945; Oates, 1993). Local government ‘autonomy can relieve potential grievances, reduce the risk of violence and then create a better environment for local development (Tranchant, 2007), particularly in the countries of high ethnic heterogeneity or regional identities (Faguet 2014). Numerous other studies have stressed the benefits from decentralization regarding access to public services and poverty reduction (Hindriks, Peralta, & Weber, 2008; Weingast, 2014), but for a country to gain from improved efficiency, the local democracy must function effectively and local authorities must have substantial revenue autonomy and power in allocating resources (Oates, 1993). In developing countries, however, there are strong reasons to believe that such presumptions are violated (Smoke, 2001).
22
Against these advantages, Prud’homme (1995) and Treisman (1997), among others, suggest that decentralization may worsen delivery of public services. Tax decentralization might increase inequality among regions due to the different tax potential of regions and the competition between jurisdictions that could result in reduced tax rates to attract investments and subsequent loss of efficiency in the delivery of public services (Treisman, 2000). Local elites’ capture in the decision-making process (Bardhan & Mookherjee, 2000) might increase income inequality since local revenue collection favors a minority of high-income individuals (Martinez-Vazquez & McNab, 2003). Heterogeneity of the population in developing countries is mostly based on income, rather than difference in tastes. The priorities are therefore to satisfy the population’s basic needs, which are better managed by central government (Prud’homme 1995).
The empirical evidence on the effects of fiscal decentralization and poverty reduction and access to public services delivery are also inconclusive. While Gonçalves (2014) finds that local citizens’ participation in service provision contributes to improving infant mortality and reducing poverty in Brazilian municipalities, Galiani, Gertler, & Schargrodsky (2008) suggest that it increases inequalities in the provision of education services in Argentina. One potential explanation is that local elites can capture public resources to their preferred uses (Reinikka & Svensson, 2004) and thus limit the scope of local populations monitoring initiatives (Olken, 2007). Similarly, Francis & James (2003) conclude that decentralization in Uganda failed to reduce poverty because of local governments capture by local elites. Local institutions decision making accounts for cultural values and therefore helps to reduce rural poverty in Burkina Faso (Donnelly-Roark, Ouedraogo, & Ye, 2001). In India, active involvement of local authorities allows a better targeting of beneficiaries for poverty eradication programs in Kerala (Heller, Harilal, & Chaudhuri, 2007). Many research find a positive effect of fiscal decentralization on poverty and access to public services (Emilie Caldeira, Martial, & Rota-Graziozi, 2012;
23
Cavalieri & Ferrante, 2016; Faguet & Sánchez, 2008), while others report opposite results (Bahiigwa, Rigby, & Woodhouse, 2005).
Local heterogeneity is found to play a key role in these mixed evidences (R. M. Bird & Vaillancourt, 2006). For example, Alesina, Baqir, & Easterly (1999) find ethnic diversity reduces the performance of city government in delivering public services in America. And regional heterogeneity of preferences increases the positive effect of decentralization on the delivery of public services (Besley & Coate, 2003).Despite this critical importance of country context, few studies using country-level data have analyzed this relationship, especially in sub-Saharan Africa, ignoring thus the institutional arrangements that govern the design and implementation of decentralization (Ramírez et al., 2017; von Braun & Grote, 2000).
This study analyses how revenue decentralization to municipalities affects access to public services and poverty in Côte d’Ivoire. Local revenue sources that reflect municipalities’ autonomy in decision-making are considered. Contrary to Ramírez et al., (2017), who leave aside monetary poverty, this chapter considers both access to public service, measured using an adjusted multidimensional poverty index (MPIa) and a headcount poverty index (HPIn) calculated as the ratio of population living with less than US $ 1 a day to total population of each locality. The chapter assesses also whether the effects of revenue decentralization vary between local governments according to their internal heterogeneity, defined as the degree of ethnic fractionalization and polarization. The analysis accounts for the potential effects of conflict, which might affect the ability of local governments to raise revenue and provide public services.
The original contribution of this chapter to the literature is twofold. First, the study focuses on one developing country which allows to properly control for country-specific heterogeneity than cross-country studies. The second contribution comes from the improved empirical approach using the Grouped Fixed Effect (GFE) method for estimations and an innovative
24
construction of instruments for endogeneity. The GFE estimator allows controlling for unobservable individual heterogeneity, which may vary or not over time, that cannot be accounted for by the standard fixed effects approach used in previous studies on the effects of decentralization (Bartolucci et al., 2015). A two-stage least squares method is combined with the GFE to properly address the potential endogeneity of local revenues.
The empirical analysis uses a local revenue dataset spanning 11 years (2001-2011) for 115 municipalities aggregated in 35 départements. The overall result shows that local revenues have a positive and significant effect on access to public services which are consistent with the findings in Colombia by Ramírez et al., (2017) and contradict those in Uganda by Bahiigwa, Rigby, & Woodhouse (2005). However, there is evidence that revenue decentralization has a more robust effect on access to public service, rather than poverty. This effect seems to work mainly by increasing access to education more than to health, water, and sanitation services. The results indicate that municipalities are more likely to improve access to public services in less ethnically diverse localities and in rural zones. This study provides evidence that effect of the conflict has been statistically limited.
The remainder of the chapter is organized as follows. Section 2 describes the fiscal decentralization process, and the poverty in Côte d’Ivoire with its regional distribution. Section 3 presents the data and the model specification. The results and the robustness checks are discussed in section 4. Section 5 concludes and provides some policy implications.
2. Background
2.1 Fiscal decentralization in Côte d’Ivoire
The revenue structure of local government in Côte d’Ivoire is largely inherited from the colonial period. The implementation started with law No. 55-1489 of 18 November 1955 which established municipalities in Abidjan, Bouaké and Grand Bassam for which local authorities
25
did not have financial autonomy. The real commitment of the central government to implement decentralization especially the financial autonomy of municipalities, started with Law No. 80-1162 of 17 October 1980. This law defined a specific status and electoral regime for municipalities and created 37 municipality councils in addition to Abidjan. The government has spread the reform to other regions by transferring expenditure and revenue raising responsibilities to local authorities with the aim of improving the delivery of public services. In 2000, a new constitution was adopted, which lays out the principle of administration and financial autonomy of local authorities. This Constitution subdivides the country into a multi-tiered system with 19 regions sub-divided into 58 départements governed by départements councils, and 197 municipalities. Since 2011, although the number of municipalities has remained unchanged, the central government has reorganized the country into 14 districts (with full autonomy for Abidjan and Yamoussoukro), 31 regions, 95 départements, and 197 municipalities, each with an elected mayor.
The Ministry of Interior manages the decentralization process through the Directorate in charge of decentralization and local development (DDLD). The Ministry of Economy and Finance collaborates with the DDLD to define the amounts of transfers from central to local governments and their allocation. These administrations interact with municipalities organized in the association the Union of Côte d’Ivoire for cities and municipalities. The relationship between central and local governments is organized through a trusteeship system with two levels, by which the central administration approves decisions and helps municipalities. In the process of strengthening the fiscal autonomy of municipalities and grassroots participation in the decision-making process, more than 35 legislative decrees and laws have been passed to assign expenditure execution responsibilities, and revenue raising functions to municipalities. These responsibilities are often related to the provision of important public
26
services such as health and education facilities, water and sanitation, local urbanization, and include large sources of revenue.
Local own revenue has two main components: non-tax revenue collected exclusively by local tax administration, and tax revenue collected on behalf of local governments by central government through the General Tax Directorate. Although this local non-tax revenue is smaller than local tax revenue, this revenue remains a key element for increasing accountability and tax compliance at the local level. Local non-tax revenue is likely to be used to improve the population’s access to public services as the local authorities have full autonomy in managing this revenue, in contrast to local tax revenue which is often earmarked6.
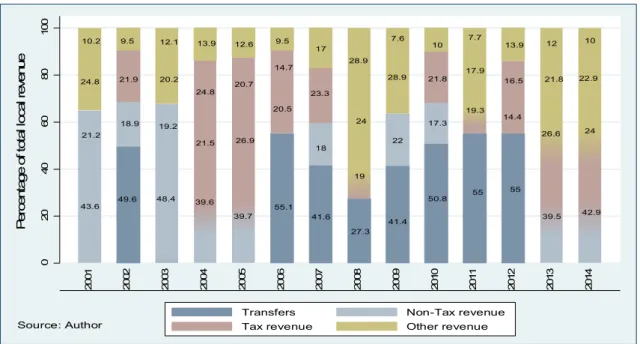
Figure 1 shows the composition of total municipality revenue over the period 2001-2014. Over this period, transfers from the central government contributed on average more than 35% of total municipal revenue. This share decreased slightly in the three-year period leading up to the
2010 national election7. During the same period, municipalities collected a small part of their
total revenue, on average less than 20%. However, tax revenue represents on average 25% of total municipality revenue, and remained relatively constant in absolute terms up to 2014. Combining these two components, local own revenue contributed 45% of total revenue. This is relatively low compared to other developing countries such as Benin, where municipalities’ own revenue contributed 69% of total revenue over the period 2003 to 2008 (E. Caldeira & Rota-Graziosi, 2014).
6 This analysis focuses on the municipal level because there is no recent data on revenue covering all levels of
sub-governments in the country (districts, regions, départements, and municipalities).
7 This trend suggests a possible reassignment of resources to election expenditure since the allocation criteria of
27
Figure 1: Composition of municipality revenue in Côte d'Ivoire 2001-2014
Figure 2 presents the structure of local non-tax revenue aggregated for the period 2002 to 2007. Small business revenues and licenses contributes the highest share of local non-tax revenue at more than 26%, while revenue from rental lease account only 5.36%. The figure shows also that market fees (25.5%) combined with flat tax (24%) represent almost half of municipality non-tax revenue. As noted above, municipalities are supposed to use their own revenues to improve access to public services and thus reduce poverty since they are involved in the provision of diverse public services such as health and education facilities, water and sanitation, local urbanization, and construction.
43.6 21.2 24.8 10.2 49.6 18.9 21.9 9.5 48.4 19.2 20.2 12.1 39.6 21.5 24.8 13.9 39.7 26.9 20.7 12.6 55.1 20.5 14.7 9.5 41.6 18 23.3 17 27.3 19 24 28.9 41.4 22 28.9 7.6 50.8 17.3 21.8 10 55 19.3 17.9 7.7 55 14.4 16.5 13.9 39.5 26.6 21.8 12 42.9 24 22.9 10 0 20 40 60 80 10 0 P er ce nt ag e of to ta l l oc a l r ev e nu e 20 01 20 02 20 03 20 04 20 05 20 06 20 07 20 08 20 09 20 10 20 11 20 12 20 13 20 14
Transfers Non-Tax revenue Tax revenue Other revenue Source: Author 5.36 6.12 13.24 24.00 25.05 26.24 0 5 10 15 20 25 30 P e rc en ta ge o f L o ca l N on -T a x R ev e nu e
Rental lease Service fees Civil registration Flat tax Market fees Small business revenue
28 Source: By author with Côte d’Ivoire data from the Ministry of Interior.
Figure 2 : Structure of local non-tax revenue Côte d'Ivoire, 2002-2007.
2.2
Public service delivery and poverty trends in Côte d’Ivoire
In this sub-section, poverty trends are analyzed through both the poverty and the access to public services using respectively the poverty headcount ratio and the multidimensional poverty index (MPI) recently developed by Alkire & Santos (2010).
Three decades after starting its decentralization process, Côte d’Ivoire remains one of the poorest countries in the world, ranked 171 out of 188 countries according to the 2016 Human Development Index. Following its independence from France in 1960, the country enjoyed a period of economic growth and political stability driven by agriculture exports, mainly coffee and cocoa. At end of the 1970s, the country experienced an economic downturn due to an unexpected drop in the world prices of these export goods. This economic crisis increased the incidence of poverty up to the 1990s (Bargain, Donni, & Kwenda, 2014). To improve the population access to basic public services, especially in rural areas and thereby reduce regional disparities, the Ivorian government has undertaken a process of fiscal decentralization by involving municipalities in tax raising responsibilities and public services delivery. This shift of responsibilities was followed by a fall in poverty by 3.2% over the period 1995-1998. Unfortunately, the expected results from fiscal decentralization have been limited, due, to three main reasons. First, like in many developing countries, the central government has been reluctant to provide municipalities with considerable responsibilities of tax raising. Second, the administrative capacity of municipalities is very limited in some areas. The third reason is that
29
the country experienced several episodes of conflict8, which compounded the existing problems
of access to public services and of poverty.
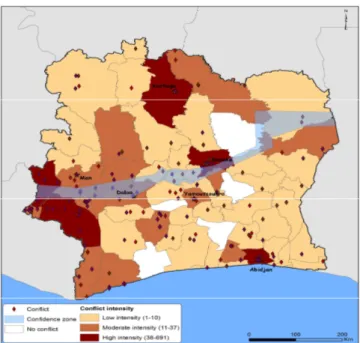
Since the last three decades, the share of the population living under the poverty line has increased significantly. Figure 3 shows the evolution of poverty headcount ratio in percentage of total population from 1985 to 2015. The poverty rate increased from 10.1% in 1985 to 48.9% in 2015 (HLSS, 2015). Access to public services also remains limited in the country. The multidimensional poverty rate, assessing the privation of citizen in several dimensions of public services, increased from 31.8% in 2008 to 34.4% in 2011 (Alkire & Santos, 2014). There is also a widespread disparity between municipalities in access to public services (Figure 4), and a geographical variation regarding local revenue autonomy (Figure 5)9. In urban area, on
average 75% of the population has access to education, health, and sanitation, while this figure is only 30% in rural areas. The water distribution, education, and health services are poor, especially in the northern and western regions. A possible explanation is a significant populations displacement across the country, as highlighted by Furst et al.(2010). In particular, the conflict-ridden areas in the north and the west, such as the region of Tonpki (Man) and the Savannah (Korhogo), remain the poorest areas (Figure 4). Minoiu & Shemyakina (2014) report that 70% of professional health workers and 80% of government-paid teachers abandoned their post in the north during the 2002-2007 conflict. This spatial distribution of access to public services could be explained by the low population density in these areas which implies higher transportation costs to access to public services and technology. The poorer regions in the country seem to have less revenue autonomy. Figure 6 shows the distribution of conflict events
8 Since 1999, Côte d’Ivoire has experienced the 1999 “coup d’etat”, the 2002 political conflict and the
post-electoral conflict of 2010/2011. This period was characterized by sporadic events with different intensity and location (Dabalen et al, 2012).
9 “Hight autonomy” refers to localities those own revenue is higher than 50% of total revenue, the others are
30
by département. Reported violence against civilians and battles were located mostly in the northern and western départements and in Abidjan.
Note: The poverty line in CFAF-75,000 per capita annually in 1985, 101, 340 in 1993, 144, 800 in 1995 and 162, 800 in 1998
Source: Author with data from the World Bank
Figure 3: Poverty Headcount Ratio at national poverty line (% of population)
10,1 34,6 36,4 40,2 42,7 48,9 0 20 40 60 1995 1993 1998 2002 2008 2015
Poverty headcount index
Figure 5: Local Own Revenue distribution pattern (As % of Total Local Revenue), 2010-2013
Source: Author with Côte d’Ivoire data from the Ministry of Interior (DGDDL).
Figure 4: AdjustedMultidimensional Poverty Index distribution pattern in Côte d’Ivoire, 2008
(HLSS-31
3. Empirical analysis
3.1 Data
First, local government revenue and expenditures dataset is constructed from the administrative account of municipalities produced by the Ivorian Ministry of Interior and the Ministry of Economy. This dataset provides information on own revenue, transfers from central government, and local expenditure for 115 municipalities over the period 2001-2011. Following Grisorio & Prota (2015), the study measures the degree of revenue decentralization as the ratio of own revenues raised and/or controlled by the municipalities (tax and/or non-tax) to the total revenues.This reflects local revenue autonomy and allows an approximation of municipalities’ autonomy in decision-making. A high value for this measure indicates a high
Figure 6: The distribution of violence against civilians and the confidence zone
Data sources: Authors based on ACLED
Note:
Figure 4: The Adjusted Multidimensional Poverty Index (MPIa) is calculated by multiplying the incidence of poverty by the average intensity of poverty across the poor; as a result, it reflects both the share of people in poverty and the degree by which they are deprived. See more details in the following section. Darker shades indicate a lower poverty index reported as a ratio of the number of multidimensional poor to the total local population. Figure 5: The local own revenue is calculated as the share of revenue collected by local governments over the total local revenue (It is the mean of four years after conflict, 2010, 2011, 2012 and 2013). Darker shades indicate a higher autonomy of internal revenue collection.
Figure 6: The map depicts conflict regions; dark shades indicate more intensity conflict such as violence against civilians, battles, and riots reported in ACLED. The blue part indicates the confidence zone which divided the country into two parts. In the legend, the “No conflict” category stands for no reported incidents and is treated as zero exposure to conflict.
32
degree of fiscal decentralization, since local authorities have decision-making autonomy in using this revenue10 .
The second source is the 2002 and 2008 Household Living Standard Surveys for Côte d’Ivoire
from which the social and demographic indicators are calculated. The HLSS11 is a national
survey which provides information on different dimensions of household living conditions. Its design ensures representativeness for the 57 Côte d’Ivoire départements. Approximately 10,800 households in 2002 and 13,657 households in 2008 were surveyed in the country (HLSS, 2002, 2008).
Additionally, information on the geographical distribution of the population from the National Statistical Institute is used to calculate the density of population and the share of urban population.
Third, conflicts indicators are calculated using data from the Armed Conflict Location and Event Dataset (ACLED) (Raleigh et al., 2010). ACLED contains information on the exact dates and locations of political violence and type of events weighted with a fatality index12. The
fatality index measures the intensity of events and represents the number of deaths due to each event. The fatality index varies from one to ten, with ten for the highest incidence of violence, and one for the lowest.
10 Another measure of fiscal decentralization is “vertical imbalance” calculated as the ratio of transfers from central
government to municipalities’ total revenue. It represents the degree to which the local government depends on transfers from central government. A high value of this measure indicates little local financial autonomy.
11 The surveys provide information on household access to several facilities like running water, electricity, health,
and education infrastructures. They contain data about whether households own certain durable goods such as fridge, computer, car, etc.
12 The conflict events selected are battles (violence against civilians, remote violence, and rioting), protests
33
These three data sources are combined and aggregated at the départements level13 to construct
a panel spanning 11 years (2001-2011) for 35 départements of the 57 départements in Côte d’Ivoire.
How are the dependent variables computed?
Two dependent variables are used: The headcount poverty index (HPIn) calculated as ratio of
population living with less than US $ 1 a day to total population of each département14. Access
to public services is measured using the multidimensional poverty index (MPI) method developed by Alkire & Santos (2010), which captures a set of direct deprivations experienced by a person or a household at the same time. The MPI basic dimensions are adjusted (MPIa) by using different indicators relevant for each dimension to properly capture those for which municipalities intervene in terms of public service delivery (Table 1). Based on the Alkire-Foster (AF) dual cut-off methodology, the weights are assigned to household for each of the deprivations and those weights are summed up to generate the weighted deprivations matrix for each household (Alkire & Foster, 2011; Alkire & Santos, 2014). A household is considered as deprived of access to public service (in the case of this study) if it has more than 30% of the weighted sum of the considered dimensions of deprivation (i.e. deprived in some combination of two to six indicators following Alkire & Santos (2010)). Thus, the ratio of people who are deprived of public services to total population is calculated for each département. By construction, this indicator has the advantage of being the product of the Headcount (H) (percentage of people whose weighted deprivation lies above the cut-off), and the Average intensity of deprivation (A), which reflects the sum of deprivation for only the
13 The data are aggregated at départements level because the 2008 HLSS is not available at the municipal level
like the first data source. The data are aggregated at départements level because the 2008 HLSS is not available at the municipal level like the first data source.
14 To allow comparison between the two censuses, the data are corrected for inflation using the national prices
34
multidimensionally poor households within each département, and thereby the average intensity of poverty for these households.
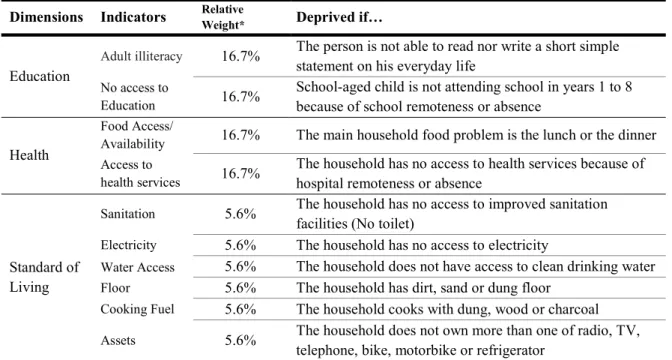
Table 1 presents the dimensions, indicators, and weights used to compute the MPIa.
There are several reasons for the choice of the dimensions used to calculate MPIa in this analysis. First, local fiscal policies can significantly influence the access to public services for local citizens. Since the 2001 law on decentralization, there has been an ongoing shift of responsibility to local governments for education, water, and sanitation, and health services.
Table 1: Dimensions and indicators used for the MPIa
Dimensions Indicators Relative Weight* Deprived if…
Education
Adult illiteracy 16.7% The person is not able to read nor write a short simple statement on his everyday life
No access to
Education 16.7%
School-aged child is not attending school in years 1 to 8 because of school remoteness or absence
Health
Food Access/
Availability 16.7% The main household food problem is the lunch or the dinner
Access to
health services 16.7%
The household has no access to health services because of hospital remoteness or absence
Standard of Living
Sanitation 5.6% The household has no access to improved sanitation
facilities (No toilet)
Electricity 5.6% The household has no access to electricity
Water Access 5.6% The household does not have access to clean drinking water
Floor 5.6% The household has dirt, sand or dung floor
Cooking Fuel 5.6% The household cooks with dung, wood or charcoal
Assets 5.6% The household does not own more than one of radio, TV,
telephone, bike, motorbike or refrigerator *The weighting between the dimensions follows the UNDP’s MPI convention
Source: Author
Second, it is easier to interpret, and is well suited for analyzing the access to basic services at local level. The limited number of dimensions simplifies comparison with the HPIn. Third, the HLSS surveys in Côte d’Ivoire are well documented for the chosen indicators and allow using both the individual and the household as units, which makes the index more accurate than those using only households as units of observation.
35
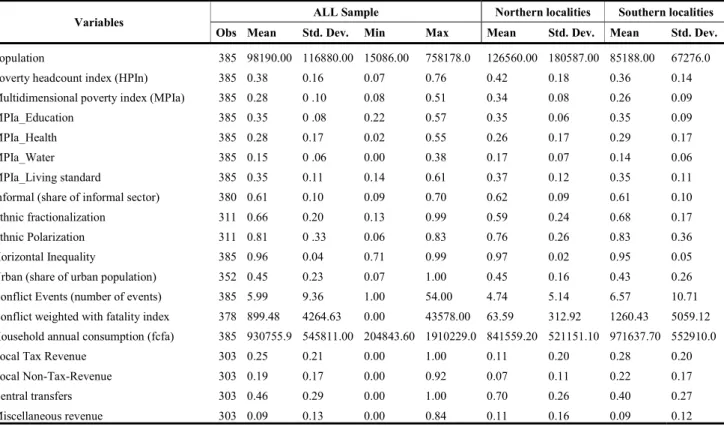
The 2002 HLSS is used for the period 2001-2006 while the 2008 HLSS covers the sub-period 2007-2011. The variables constructed from the survey data are thus considered fixed for the periods around the household survey. The main reason is that HLSS is collected only every six to seven years and data from each survey are published within 12 months of the end of field work. To deal with this data scarcity, the study follows Kis-Katos & Sjahrir (2017) in considering changes in socio-economic variables as probably limited to be considered and not instantaneous from one year to the next, especially for the main dimensions considered in this study such adult illiteracy, school-aged child not attending school in years 1 to 8, access to health services. For example, Deaton (1997) shows that some living standards do not vary in short-term from one year or two to the next. Using HLSS data from Côte d’Ivoire, he concludes that when the time between surveys is longer, reported expenditures do not increase proportionately. This hypothesis might raise a concern from a potential persistence of dependent variables. Sensibility tests of the results are undertaken in robustness section. Table A1 provides descriptive statistics for all variables (north and south), and Table A3 shows more information on the sources and definitions of these data.
3.2 Model specification
The previous studies commonly use cross-country data and consider the heterogeneous characteristics as time invariant by using a standard fixed effect approach. One drawback of this method is that the estimates of parameters may be subject to substantial bias in the context
that unobserved heterogeneity is not constant over time (B. Knight, 2002)15. To deal with this
problem and account for both varying and unvarying heterogeneity between départements, this analysis uses the Grouped Fixed Effect (GFE) approach proposed by Bonhomme & Manresa
15For example Knight (2002) by analyzing the impact of Federal Grants on US State Government Spending, argues
that some aspects of US states’ demands, such as attitudes towards public transport, are unobservable. He finds that a fixed effect may mitigate, but not eliminate this problem.
36
(2015). The main motivation for using the GFE method comes from the conflict that the country experienced, which was characterized by a series of events with different intensity and location, as shown by Dabalen et al (2012). As the départements are affected differently by conflict and have different revenue potential, their revenue performance trends could follow different paths based on their specific unobserved characteristics. Such shocks may induce time-varying unobservable individual characteristics that cannot be accounted by the standard fixed effects approach (Bartolucci et al., 2015). More evidence about the consistency of this method and the presence of time-varying effects is given in Appendix B. The empirical model has the following form:
log (𝑃𝑜𝑣_𝑚𝑝𝑖𝑎) = 𝜆 + θ log(𝐹𝐷) + 𝜃 𝐻𝑒𝑡𝑒𝑟𝑜 + θ log(𝐹𝐷) ∗ 𝐻𝑒𝑡𝑒𝑟𝑜 + 𝜃 𝑥 +
𝛼 + 𝜂 + 𝜀 (1)
𝑃𝑜𝑣_𝑚𝑝𝑖𝑎 is the dependent variables log (𝑝𝑜𝑣𝑒𝑟𝑡𝑦) or the log (𝑀𝑃𝐼𝑎) representing
respectively the log of the poverty headcount ratio and the adjusted multidimensional poverty index of département at time . The contribution of education and health in MPI is also used as a dependent variable. It represents the number of habitants who do not have sufficient income or food to meet some defined minimum living conditions over the total population of département at time . The interest variable log(𝐹𝐷) is the log of the ratio of own revenues to total revenues of département at time . 𝐻𝑒𝑡𝑒𝑟𝑜 represents the local heterogeneity approximated by two variables: Ethnic fractionalization and ethnic polarization as they measure the extent of cultural diversity and thus local taste16. Ethnic fractionalization measures the
probability that two randomly selected individuals in a départements will not belong to the
16The five major ethnic groups are considered: Akan, Krou, Mande North, Mande South and Voltaic. The higher
these indices, the stronger the heterogeneity of local demand. Ethnic fractionalization and Ethnic Polarization are calculated based on the 2002 and 2008 surveys and considered fixed for the periods around the household survey. The motivations holding his hypothesis are explained above.
i
t
i
t
37
same ethnic group. Following José G. Montalvo & Reynal-Querol, (2005), ethnic fractionalization is calculated as:
Fractionalization = ∑ ɸ (1 − ɸ );
Ethnic polarization measures how far the distribution of the ethnic groups is from a bipolar distribution17. It is calculated as:
Polarization = 4 ∑ ɸ (1 − ɸ ); Where ɸ is the share of population belonging to ethnic
group 𝑘, 𝐾 equals total number of ethnic groups for the two equations. These variables are assumed to play a key role in the effect of local revenue autonomy on access to basic services and poverty.
Consistent with existing literature, control variables include transfers from central government, economic, demographic and social characteristics, represented by 𝑥 . The group-specific unobservable effects 𝛼 is modified to consider the département-specific fixed effect 𝜂 as well18. The conflict effects are measured through the number of conflict events in each
département and these numbers are weighted by the fatality index. Conflict variables are expected to negatively affect the dependent variables.
Before discussing the empirical results, it is necessary to address some issues concerning the estimation strategy. First, there are reasons to consider local own revenue as an endogenous variable that can induce a bias in estimations. Départements with a high access to services or a low-income poverty rate may have higher potential to increase their revenue collection. The resulting reverse causality from this relation may bias the estimation results. Moreover, the internal effectiveness of each département in terms of implementing programs and technical staff training are unobservable in the models. This unobservable heterogeneity may be correlated with both the variables of interest and the dependent variables. To address these
17 The purpose of the ethnic polarization index is to record how far the distribution of the ethnic groups is from the
bipolar distribution. See more in José G. Montalvo & Reynal-Querol (2005).
38
issues, model (1) is estimated using a two-stage least squares (2SLS) methodology with panel corrected standard errors clustered by département. An instrumental variable for local revenue autonomy is constructed following a method proposed by Martinez-Vasquez, Vulovic, & Liu, (2011)19. The value of the local revenue autonomy ratio instrumental variable is, calculated as:
𝐿𝑅𝐴_𝐼𝑉 =
∑ ∑ 𝑂𝑤𝑛𝑟𝑒𝑣 𝑖 ≠ 𝑗 (2)
Where 𝐿𝑅𝐴_𝐼𝑉 is the value of the instrumental variable for départements 𝑖 in year 𝑡. 𝑑 is the distance between the largest cities in départements 𝑖 and département 𝑗, and 𝑂𝑤𝑛𝑟𝑒𝑣 is the ratio of local own revenues to total revenues of département 𝑗 in year 𝑡. This instrument is the weighted average of the own revenue ratio for all other départements in the corresponding year,
and the weights are the inverse of the distance between the two départements.There are two
principles hypotheses holding the use of this instrument as argued by Martinez-Vasquez et al., (2011). First, the poverty rate or access to basic services in one département relative to others generally should not influence the local revenue mobilization of other départements, so the dependent variable should not be correlated with the instrument. Second, the design of the own revenue raising system in a département should be affected by the design of the own revenue raising system in a neighboring département. The lagged variables of Local Revenue Autonomy (LRA) are also used as instruments under the hypothesis of an intertemporal dependence of local revenue mobilization.
4. Empirical results and implications
Table 2 shows the estimation results of equations 1 concerning the effect of local revenue autonomy on MPIa or HPIn. As defined above, a negative (positive) sign of a coefficient