HAL Id: hal-00317587
https://hal.archives-ouvertes.fr/hal-00317587
Submitted on 30 Mar 2005
HAL is a multi-disciplinary open access
archive for the deposit and dissemination of
sci-entific research documents, whether they are
pub-lished or not. The documents may come from
teaching and research institutions in France or
abroad, or from public or private research centers.
L’archive ouverte pluridisciplinaire HAL, est
destinée au dépôt et à la diffusion de documents
scientifiques de niveau recherche, publiés ou non,
émanant des établissements d’enseignement et de
recherche français ou étrangers, des laboratoires
publics ou privés.
Wavelet transforms of meteorological parameters and
gravity waves
Z. Can, Z. Aslan, O. Oguz, A. H. Siddiqi
To cite this version:
Z. Can, Z. Aslan, O. Oguz, A. H. Siddiqi. Wavelet transforms of meteorological parameters and gravity
waves. Annales Geophysicae, European Geosciences Union, 2005, 23 (3), pp.659-663. �hal-00317587�
SRef-ID: 1432-0576/ag/2005-23-659 © European Geosciences Union 2005
Annales
Geophysicae
Wavelet transforms of meteorological parameters and gravity waves
Z. Can1, Z. Aslan2, O. Oguz2, and A. H. Siddiqi31Yildiz Technical University, Faculty of Science and Letters, Dept. of Physics, Istanbul, Turkey 2Faculty of Engineering and Design, Istanbul Commerce University, Istanbul, Turkey
3King Fahd University of Petroleum and Minerals, Department of Mathematical Sciences, Dhahran, Saudi Arabia
Received: 15 September 2004 – Revised: 21 December 2004 – Accepted: 13 January 2005 – Published: 30 March 2005
Abstract. The main purpose of this paper is to analyze some
characteristics of gravity waves (GWs), and seasonal varia-tions of atmospheric waves over Istanbul by using wavelet techniques. Daily radiosonda data of Istanbul in the tro-posphere and lower stratosphere (1000 hPa–30 hPa) between 1993 and 1997 have been considered. Wavelet analysis based on a computer simulation of data is generally close to the real data when Daubechies wavelet series are used. Daily, monthly, seasonal and annual variations of pressure heights, air temperature and deviations from mean values have been analyzed. Variations show the effects of gravity waves for different pressure levels in the troposphere. These waves lead to the meso-scale wave-form structures in spring, au-tumn and winter. As a result of this study, wavelet series and transforms for data construction, definition of some disconti-nuities and the local effects on the signal have been compared with the results of previous studies. The most similar struc-ture between temperastruc-ture, turbulence parameters and geo-potential height deviations has been defined at the 500-hPa pressure level.
Keywords. Atmospheric composition and structure
(pres-sure, density and temperature) – Meteorology and atmo-spheric dynamics (convective processes; turbulence)
1 Introduction
Dynamics and thermodynamics of the lower atmosphere de-termine its physical conditions. Wind, temperature and hu-midity profiles have a crucial role in the growing and propa-gation of turbulence and internal gravity waves. Many exper-imental campaigns have been carried out to study the charac-teristics and effects of gravity waves in the lower, middle and upper atmosphere over the last decades (Isaac et al., 2004).
The wavelet transform was applied to the analysis of characteristics of thermal and velocity fields of coherent
Correspondence to: Z. Can
structures from turbulence data taken within and above a de-ciduous forest by Gao and Li (1993). This study demon-strates the usefulness of wavelet analysis in decomposing structures at different scales, hidden in time series data. The wavelet technique is a useful tool for analyzing time series with many different time scales or changes in variance. A practical step-by-step guide to wavelet analysis is given with examples taken from time series of the El Ni˜no-Southern Os-cillation (ENSO) (Torrence and Compo, 1998).
Wavelet methods have been applied to the study of the sta-ble atmospheric boundary layer under non-stationary condi-tions by Terradellas et al. (2001). Wavelet analysis is a useful tool to determine the dominant modes of the signal, as well as its evolution in time. It also provides easier detection of short duration events in large series.
Zink and Vincent (2001) described a technique to detect gravity wave packets in high-resolution radiosonde sound-ings of horizontal wind and temperature. A strong seasonal cycle in the total wave variance was found with a maximum in winter.
A calendar of the negative and positive phases of the North Sea-Caspian Pattern (NCP) for the period 1958–1998 was used to analyze the implication of the NCP upper level tele-connections on the regional climate of the eastern Mediter-ranean basin (Kutiel et al., 2002). The maximum impact of the NCP on mean air temperature was detected in the con-tinental Anatolian Plateau, where the mean seasonal differ-ences are around 3.5◦C. This influence decreases westwards and southwards.
A sudden temperature rise in the lower thermosphere can support surface waves propagating horizontally with energy concentrated near the sudden temperature rise (Ding et al., 2003). The energy distribution is shifted toward the lower at-mosphere when compared with wave modes without winds. The descent of energy distribution makes the energy atten-uation caused by viscosity and thermal conductivity drops down. This leads to the rise of attenuation distances.
The purpose of the present study is to understand the characteristics of lower atmospheric turbulent structure and
660 Z. Can et al.: Wavelet transforms of meteorological parameters and gravity waves
Table 1. Seasonal average values of pressure height deviations
be-tween 1000 and 300 hPa pressure levels.
300 hPa(dh) spring summer autumn winter annual 1993 125.86 95.04 115.76 115.37 124.30 1994 120.76 79.67 64.57 105.08 99.72 1995 130.42 58.27 136.63 172.43 78.49 1996 119.6 76.32 121.79 169.92 105.13 1997 129.79 84.60 106.32 90.82 133.62 mean 125.29 78.78 109.01 130.72 108.25 500 hPa(dh) 1993 87.81 57.75 70.05 79.27 84.76 1994 80.05 53.15 42.37 73.13 66.93 1995 80.76 35.37 85.48 66.22 70.78 1996 79.73 51.75 76.73 66.54 69.62 1997 91.69 51.88 72.72 55.51 87.11 mean 84.01 49.98 69.47 68.13 75.84 700 hPa(dh) 1993 60.26 32.57 45.06 54.63 58.99 1994 54.03 40.10 28.46 54.09 47.60 1995 47.19 25.54 49.91 46.93 45.10 1996 54.20 33.41 50.40 44.8 47.53 1997 56.87 53.84 46.90 41.63 51.69 mean 54.51 37.09 44.15 48.42 50.18 850 hPa(dh) 1993 48.93 25.77 32.42 46.16 42.38 1994 38.56 30.20 37.31 50.58 40.09 1995 36.89 23.70 41.83 50.52 40.60 1996 44.22 25.31 39.61 43.88 40.81 1997 47.11 28.5 38.70 48.65 39.72 mean 43.14 26.70 37.97 47.96 40.72 1000 hPa(dh) 1993 40.28 29.72 43.53 44.78 43.10 1994 35.62 27.65 30.44 56.37 34.86 1995 38.13 26.11 42.27 61.21 44.75 1996 38.93 28.20 39.46 53.90 42.47 1997 49.37 30.68 43.39 67.25 45.99 mean 40.47 28.47 39.82 56.70 42.23
internal gravity waves in the vicinity of Istanbul. The main objectives of this paper are listed below:
1. To define the variation of gravity wave characteristics in a time domain.
2. To apply 1-D-wavelet analysis and wavelet packets and to explain discontinuities in the daily variations of air temperature, pressure heights, thermal conductivity and viscosity.
3. To analyze seasonal variations of gravity waves by con-sidering radiosonda data and to compare the results with the large-scale effects such as La-Ni˜na and El-Ni˜no.
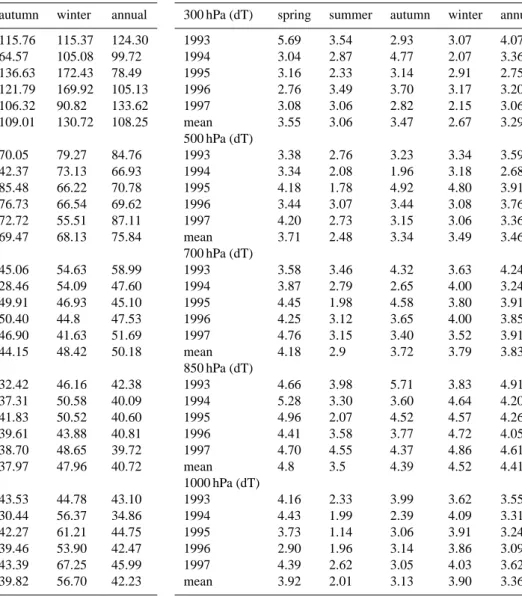
Table 2. Seasonal average values of temperature deviations
be-tween 1000 and 300 hPa pressure levels.
300 hPa (dT) spring summer autumn winter annual
1993 5.69 3.54 2.93 3.07 4.07 1994 3.04 2.87 4.77 2.07 3.36 1995 3.16 2.33 3.14 2.91 2.75 1996 2.76 3.49 3.70 3.17 3.20 1997 3.08 3.06 2.82 2.15 3.06 mean 3.55 3.06 3.47 2.67 3.29 500 hPa (dT) 1993 3.38 2.76 3.23 3.34 3.59 1994 3.34 2.08 1.96 3.18 2.68 1995 4.18 1.78 4.92 4.80 3.91 1996 3.44 3.07 3.44 3.08 3.76 1997 4.20 2.73 3.15 3.06 3.36 mean 3.71 2.48 3.34 3.49 3.46 700 hPa (dT) 1993 3.58 3.46 4.32 3.63 4.24 1994 3.87 2.79 2.65 4.00 3.24 1995 4.45 1.98 4.58 3.80 3.91 1996 4.25 3.12 3.65 4.00 3.85 1997 4.76 3.15 3.40 3.52 3.91 mean 4.18 2.9 3.72 3.79 3.83 850 hPa (dT) 1993 4.66 3.98 5.71 3.83 4.91 1994 5.28 3.30 3.60 4.64 4.20 1995 4.96 2.07 4.52 4.57 4.26 1996 4.41 3.58 3.77 4.72 4.05 1997 4.70 4.55 4.37 4.86 4.61 mean 4.8 3.5 4.39 4.52 4.41 1000 hPa (dT) 1993 4.16 2.33 3.99 3.62 3.55 1994 4.43 1.99 2.39 4.09 3.31 1995 3.73 1.14 3.06 3.91 3.24 1996 2.90 1.96 3.14 3.86 3.09 1997 4.39 2.62 3.05 4.03 3.62 mean 3.92 2.01 3.13 3.90 3.36
2 Material and methodology
2.1 Description of study area and data
The air temperature and pressure height observations us-ing the radiosonda soundus-ing system at 00:00 GMT, between 1993 and 1997 at Goztepe (Istanbul: 40◦550N, 29◦050E),
have been analyzed. The study area (G¨oztepe Observatory) is at the transient region of two continents: Europe and Asia. It is under the effects of land-air-sea interactions. This con-trast and temperature differences trigger a thermal turbulent structure of the atmospheric boundary layer.
Time variation of daily pressure height and standard de-viations of air temperature and pressure heights up to the 300-hPa pressure level have been analyzed in this paper. Standard deviations have been presented in the following sections.
2.2 Tools and methodology
MATLAB and SPSS packet programs were used as a tool for the main objectives of this study (Aslan and Oguz, 1998; Aslan et al., 1997; Can et al., 2002).
2.3 Continuous 1-D-wavelet
The wavelet analysis is a great improvement in the analysis of atmospheric data, especially in studying the displacement characteristics of a moving structure (Meyer, 2000; Terradel-las et al., 2001) . The guide includes a comperative study of the windowed Fourier transform, the choice of an appropri-ate wavelet basis function, edge effects due to finite-length time series and the relationship between wavelet appropriate wavelet basis function, scale and Fourier frequency (Tokgo-zlu et al., 2002).
If function f(t) is continuous, has null moments, decreases quickly towards zero when x tends towards infinity, or when it is null outside a segment of R, it is a likely candidate to become a wavelet. The family of shifts and dilations allows all finite energy signals to be reconstructed using the details in all scales. This property allows only continuous analy-sis. In the toolbox, the wavelet is usually associated with a scaling function. Wavelets, even db2, db3,. . ., are defined by functional equations. The solution is numerical and accom-plished by using a fairly simple algorithm. A 1-D analysis is based on one scaling function and one wavelet. A 2-D anal-ysis (on a square or rectangular grid) is based on one scaling function and three wavelets. All the functions decay quickly to zero.
In the following sections f (t ) will be considered as pres-sure height or air temperature deviations from mean values. Let f (t ) be a function of time and that
∞
Z
−∞
|f (t )|2dt < ∞ (1a)
The Fourier transform F of f (t) is defined as
F (w) =
∞
Z
−∞
f (t )eiwtdt . (1b)
A function ψ (t) satisfying the following condition is called a continuous wavelet (Can et al., 2004):
∞ Z −∞ |ψ (t )|2dt =1 (2a) and ∞ Z −∞ |ψ (t )|dt =0 . (2b)
Higher order moments may be zero, that is,
∞
Z
−∞
tkψ (t )dt =0 for k =0, . . ., N − 1 .
2.4 Viscosity coefficients and thermal conductivity Usually the viscosity µiand thermal conductivity λiare
tem-perature dependent and are expressed in the following form:
λi =AiTbi, (3)
where Ai and bi are parameters determined from fitting the
experimental results. The coefficients of viscosity µ and thermal conductivity λ are computed from Dal Garno and Smith (1962):
µ =3.34 × 10⁻⁷To0.71, (4)
λ =6.71 × 10⁻⁴To0.71. (5)
3 Analysis
3.1 Analysis of pressure heights 3.1.1 Statistical analysis
Statistical analysis of pressure height (h) with deviations at all levels is presented in Table 1. Maximum deviations (dh) are recorded at 1000 hPa, 850 hPa and 300 hPa pressure lev-els in winter. Maximum pressure deviations are observed at 700 hPa and 500 hPa pressure levels in spring and minimum deviations are observed at all levels in summer. Maximum annual deviations for 300 hPa, 500 hPa and 1000 hPa pres-sure levels are observed in 1997 and for 700 and 850 hPa in 1993.
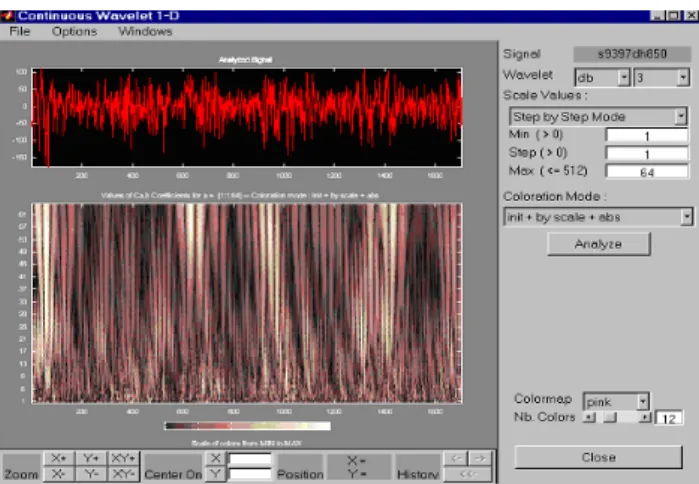
3.1.2 Wavelet analysis
In order to illustrate the relationship between small, meso and large-scale fluctuations on air pressure and temperature, time series of five years’ worth of data were analyzed by us-ing Continuous 1-D dB-level 3 wavelet.
Large-scale effects on pressure deviations at the 850-hPa pressure level have been observed at the beginning of the first, third, fourth and fifth years (Fig. 1). Generally, the peak appears in the wavelet series of pressure disturbance in win-ter. Table 1 shows that amplitudes at the 500-hPa pressure level are almost two times greater than the values observed at the 850-hPa pressure level. The deviations (higher am-plitudes) of pressure values at 300 hPa are higher than the deviation values recorded at lower layers.
3.2 Analysis of air temperature 3.2.1 Statistical analysis
Monthly maximum temperature deviations have been ob-served in spring or autumn between 1000 hPa and 300 hPa pressure levels (Table 2). If we compare the annual mean deviation values of monthly mean temperatures, the maxi-mum values are observed between 850 and 300 hPa in 1993. For the 1000-hPa pressure level the maximum value is ob-served in 1994. Minimum temperature deviations, in the
662 Z. Can et al.: Wavelet transforms of meteorological parameters and gravity waves
Fig. 1. Continuous wavelet 1-D analysis of the 850-hPa pressure
height deviations (Istanbul, 1993–1997).
Fig. 2. Continuous wavelet 1-D analysis of air temperature
devia-tions at the 850-hPa pressure level (Istanbul, 1993–1997).
other words weak gravity waves, have been observed be-tween the 1000–500-hPa pressure levels in summer.
3.2.2 Wavelet analysis
Lower positive deviations have been observed at the 850-hPa pressure level (Fig. 2). Air temperature series generally show a similar pattern in this period. Their wavelet transform modulus show a main peak at the 500-hPa pressure level, in the first period of 1995. Smaller deviations between 1994 and 1996 have been recorded at the 700-hPa pressure level. Large-scale effects are more effective on dT variations at this level in the second part of the period. Generally, small-scale fluctuations play a more important role on dT values at the 500-hPa pressure level in 1993.
3.2.3 Analysis of thermal conductivity and coefficients of viscosity
Daily variations of thermal conductivity and viscosity coef-ficients at the 850-hPa pressure height in 1997 are analyzed (Fig. 3). Conductivity values increase at the beginning of
Thermal Conductivity, 850hPa, 1997
0.034 0.035 0.036 0.037 0.038 0.039 1 51 101 151 201 251 301 351 Day (1997) Thermal Conductivity
Fig. 3. Daily variation of thermal conductivity (850 hPa, 1997).
Table 3. El Ni˜no and La Ni˜na years in the observation period.
Year Average SOI Following Label Year 1993 −1.08 1993–1994 SE (Stronger El Ni˜no) 1994 −1.43 1994–1995 SE (Stronger El Ni˜no) 1995 0.0 1995–1996 N (Neither) 1996 0.47 1996–1997 N (Neither) 1997 −1.67 1997–1998 SE (Stronger El Ni˜no)
spring. They show a slightly decreasing trend in the first part of summer when energy distribution decreases.
3.3 Connections with El Ni˜no and La Ni˜na
Table 3 shows El Ni˜no and La Ni˜na years in the observation period (World Climate News, 2003).
Small standard deviation of pressure heights correspond to weak gravity waves with low amplitudes. In 1995 (nei-ther El-Ni˜no, nor La-Ni˜na) the lowest amplitudes of gravity waves have been observed in summer. Strong El-Ni˜no effects increase the amplitudes of gravity waves in summer.
Higher temperature deviations have been observed in El-Ni˜no years (1993–1994, 1997) at the 300-, 850-, 1000-hPa pressure levels. In 1995 and 1996 (neither El-Ni˜no nor La-Ni˜na) lower temperature values have been observed in these pressure levels.
Large-scale effects play an important role in temperature variation. It is concluded that higher temperature and pres-sure deviations from mean values at lower layers (in the vicinity of 850 hPa pressure level), are observed in strong El Ni˜no Years (1993, 1994 and 1997).
4 Results and conclusion
This is a case study which analyses daily variations of temperature and pressure deviations in the troposphere be-tween 1993 and 1997. Wavelet analysis explains the sudden changes in parameters. It is also a useful tool for energy dis-tribution analysis in the atmosphere.
The pressure height deviations increase above the 500-hPa pressure level in the observation period. Between 1995 and
1996 (Neutral Period: neither El-Ni˜no nor La-Ni˜na) the low-est deviations were observed around the 850-hPa pressure levels. Similar structures between temperature, turbulence parameters and geo-potential height deviations have been de-fined at all pressure levels.
Acknowledgements. The authors thank O. T¨uz¨un and O. Tascan for their support on this study. The authors acknowledge for their support from Istanbul Commerce University, Yildiz Technical Uni-versity. The study has been supported by research foundation of Yildiz Technical University with project No. 21-01-01-02, 2001– 2004. The authors also thank the referees for their valuable critics.
Topical Editor O. Boucher thanks P. Charton for his help in evaluating this paper.
References
Aslan, Z. and Oguz, O.: Time Variation of Gravity Waves in the Lower Atmosphere, IC/IR/92/22, Internal Report, 1998. Aslan, Z., Okcu, D., and Kartal, S.: Harmonic analysis
precipita-tion, pressure and temperature over Turkey, Il Nuovo CIMENTO, 20-4 , 595–605, 1997.
Can, Z., Aslan, Z., and Oguz, O.: The variations of temperature, pressure and wind speed values: Effects on gravity waves, Il Nuovo Cimento, 25 C, 2, 137–145, 2002.
Can, Z., Aslan, Z., and Oguz, O.: One-Dimensional Wavelet and Reanalysis of Gravity Waves, Theme Issue of the AJSE on Wavelet and Fractal Methods in Science and Engineering, Part II, 29:2C, 2004.
Dal Garno, A. and Smith, F. J.: The thermal conductivity and vis-cosity of atomic oxygen, Planet. Space Sci., 9, 1–6, 1962.
Ding, F., Wan, W., and Yuan, H.: The Influence of Background Winds and Attenuation on the Propagation of Atmospheric Grav-ity Waves, J. Atmos. Sol. Terr. Phys., 65, 857–869, 2003. Gao, W. and Li, B. L.: Wavelet Analysis of Coherent Structures at
the Atmosphere-Forest Interface, J. Appl. Meteorol., 32, 1717– 1725, 1993.
Isaac, M., Renuka, G., and Venugopal, C.: Wavelet Analysis of Long Period Oscillations in Geomagnetic Field Over the Mag-netic Equator, J. Atmos. Sol. Terr. Phys., 66, 919–925, 2004. Kutiel, H., Maheras, P., T¨urkes, M., and Paz, S.: North Sea-Caspian
Pattern (NCP) – an upper level atmospheric tele-connection af-fecting the eastern Mediterranean-Implications on the Regional Climate, Theoretical Applied Climatology, 72, 173–192, 2002. Meyer, Y.: The Role of Oscillation in Some Nonlinear Problems,
School on Mathematical Problems in Image Processing, ICTP, SMR1237/4, 4–22 September, 2000.
Terradellas, E., Modales, G., Cuxart, J., and Yague, C.: Wavelet Methods: Application to the Study of the Stable Atmospheric Boundary Layer Under Non-Stationary Conditions, Dyn. At-mos., 34, 2–4, 225–244, 2001.
Tokgozlu, A., Siddiqi, H., and Aslan, Z.: De Noising and Analysis of Flight Measurements, Current Trends in industrial and Ap-plied Mathematics, edited by: Manchanda, P., Ahmad, K., and Siddiqi, A. H., Anamaya Publishers, New Delhi, 47–67, 2002. Torrence, C. and Compo, G. P.: A Practical Guide to Wavelet
Anal-ysis, Bulletin of the American Meteorological Society, 79, 1, 61– 78, 1998.
WMO: World Climate News, 23, 5, Switzerland, 2003.
Zink, F. and Vincent, R. A.: Wavelet Analysis of Stratospheric Gravity Wave Packets over Macquarie Island 1. Wave Parame-ters, J. Geophys. Res., 106, 10 275–10 288, 2001.