HAL Id: insu-01857502
https://hal-insu.archives-ouvertes.fr/insu-01857502
Submitted on 22 Nov 2020
HAL is a multi-disciplinary open access
archive for the deposit and dissemination of
sci-entific research documents, whether they are
pub-lished or not. The documents may come from
teaching and research institutions in France or
abroad, or from public or private research centers.
L’archive ouverte pluridisciplinaire HAL, est
destinée au dépôt et à la diffusion de documents
scientifiques de niveau recherche, publiés ou non,
émanant des établissements d’enseignement et de
recherche français ou étrangers, des laboratoires
publics ou privés.
New method of enhancement using wavelet transforms
applied to SODISM telescope
Amro Alasta, Abdulrazag Algamudi, Rami Qahwaji, Stanley Ipson, Alain
Hauchecorne, Mustapha Meftah
To cite this version:
Amro Alasta, Abdulrazag Algamudi, Rami Qahwaji, Stanley Ipson, Alain Hauchecorne, et al.. New
method of enhancement using wavelet transforms applied to SODISM telescope. Advances in Space
Research, Elsevier, 2019, 63 (1), pp.606-616. �10.1016/j.asr.2018.08.002�. �insu-01857502�
1
New method of Enhancement using
Wavelet Transforms applied to SODISM Telescope
Amro F. Alasta
1Abdulrazag Algamudi
1Rami Qahwaji
1Stanley Ipson
1Alain Hauchecorne
2Mustapha Meftah
2 1S
CHOOL OFE
LECTRICALE
NGINEERING ANDC
OMPUTERS
CIENCEU
NIVERSITY OFB
RADFORD,
U
NITEDK
INGDOM2
F
RENCHN
ATIONALC
ENTRE FORS
CIENTIFICR
ESEARCH,
LATMOS,
U
NIVERSITÉP
ARISS
ACLAY
Abstract: PICARD is a space-based observatory hosting the Solar Diameter Imager and Surface Mapper (SODISM) telescope, which has continuously observed the Sun from July 2010 and up to March 2014. In order to study the fine structure of the solar surface, it is helpful to apply techniques that enhance the images so as to improve the visibility of solar features such as sunspots or faculae. The objective of this work is to develop an innovative technique to enhance the quality of the SODISM images in the five wavelengths monitored by the telescope at 215.0 nm, 393.37 nm, 535.7 nm, 607.1 nm and 782.2 nm. An enhancement technique using interpolation of the high-frequency sub-bands obtained by Discrete Wavelet Transforms (DWT) and the input image is applied to the SODISM images. The input images are decomposed by the DWT as well as Stationary Wavelet Transform (SWT) into four separate sub-bands in horizontal and vertical directions namely, low-low (LL), low-high (LH), high-low (HL) and high–high (HH) frequencies. The DWT high frequency sub-bands are interpolated by a factor 2. The estimated high frequency sub-bands (edges) are enhanced by introducing an intermediate stage using a stationary Wavelet Transform (SWT), and then all these sub-bands and input image are combined and interpolated with half of the interpolation factor α/2, used to interpolate the high-frequency sub-bands, in order to reach the required size for IDWT processing. Quantitative and visual results show the superiority of the proposed technique over a bicubic image resolution enhancement technique. In addition, filling factors for sunspots are calculated from SODISM images and results are presented in this work.
Keywords—SODISM low-resolution images, interpolation, DWT, IDWT, Enhanced image, filling factor.
1. Introduction
The enhancement of images is an important processing issue in many image and video-processing applications, such as medical imaging, astronomy, and satellite surveillance [1].
Because of the image capturing conditions, images may appear blurred and be candidates for improvement before visual assessment. This is the case for the Solar Diameter Imager and Surface Mapper (SODISM) onboard the PICARD Satellite [2]. The aim of this manuscript is to improve the quality of PICARD/SODISM images (blind corrections), so that the resulting images become more suitable than the original ones for extraction of features such as sunspots. SODISM is a high-resolution radio-imaging telescope with a Ritchey-Chrétien configuration. SODISM is an 11-cm diameter telescope with a charge coupled device (CCD) at its focal plane. The CCD is anti-reflective (AR) coated. The CCD detector array has 2048×2048 pixels of 13.5µmpitch. The focal length is 2,626mm. Focal length and CCD format lead to a Field of view(FOV) of 36×36 arcmin, and a plate scale of ∼1.06 arcsec per pixel
[3][4].
2
To improve the visibility of features in an image both contrast and resolution enhancement techniques are used, and the latter are of most interest here. Alternative techniques such as bicubic interpolation, which are commonly used to increase the number of pixels in an image, tend to smooth edges and fine detail in the final result [5]. This enhancement technique uses DWT to decompose the input image into different sub-bands. Then, the high-frequency sub-band images and the input low resolution image are interpolated, followed by combining all these images to generate a new resolution enhanced image. Comparisons are made between the benchmark, bicubic enhanced and resolution enhanced images visually and quantitatively using both pixel differences and segmented features, namely sunspot filling factors. This paper is arranged as follows: Section 2 summarizes some related work, Section 3 describes the proposed enhancement method and Sections 4 and 5 present the assessment methods and some experimental results respectively. Conclusions of this study are presented in Section 6. 2. Related work
The SODISM instrument acquired the first image of the Sun at 607.1 nm on July 22, 2010 during the commissioning phase. It was a raw image at level L0, with no correction of instrumental factors [6]. Gradually, the quality of the SODISM images has deteriorated due to the harsh space environment. The pictures are becoming more and more blurred. One of the goals is to improve the quality of the SODISM images with a blind correction method.
In 2017, Alasta et al. [7] used the following automated method to detect sunspot; noise was removed from images by applying Wavelet Kuwahara and A Trous filters. Moreover, brightness outliers were also removed from noisy pixels, and a Bandpass filter was applied to display sunspots on a normalized background. Finally, the threshold was run to obtain a masked image that determined the sunspot location.
In 2015, Qahwaji et al. [8] used a method to detect photospheric solar features (sunspots) and calculated their filling factors, using a Wavelet Harr filter to remove noise from the image, a band pass filter to detect sunspots and Gaussian smoothing to remove isolated noisy pixels on SODSIM band at 535.7 nm images taken between 5th August 2010 to 4th January 2014.
Meftah et al. [9] applied morphological operations (a top-hat operation followed by a bottom-hat operation), and a contrast enhancement technique, which is used before for detecting sunspots using Otsu thresholding. They also focused on solar metrology and could not find any direct link, when analyzing PICARD’s data, between solar activity and fluctuations in solar oblateness and solar radius.
Lefebvre et al. [10] develop a method apply on MIRESOL (Mesures et Identifications des REgions actives au limbe SOLaire) instrument, which has aperture close to SODSIM. This method based on analysis Singular Spectrum Analysis (SSA) of two signals, the first signal called radius and coming from the analysis of the distance between the center and the inflexion points of the limb profiles and the second signal called intensity which reflects concerning intensity, the method detect features without remove centre-to-limb darkness. In this work, we chose to explore applying size increasing techniques to SODISM in order to improve the visibility and measurements made on solar features such as sunspots. The main deficiency of an image after being increased in size by applying interpolation techniques is the smoothing caused by interpolation [11].
The simplest interpolation methods used, nearest neighbour, bilinear, and bicubic, for example, each has its own advantages and disadvantage. The first is quickest but results in significant jagged distortion of edges. The second results in smoother edges, yet has a somewhat blurred appearance. Finally, although the third is slowest, it produces smooth but sharpest edges [5][12].
Bicubic interpolation is often chosen over bilinear interpolation or nearest neighbor when speed is not an issue. In the exam ples in the related literature [13][11], bicubic interpolation gives better results than the other techniques. However, in order to
3
increase the quality of the enhanced image, preserving the sharpness of edges by means of a resolution enhancement technique is essential. In this paper, a Discrete Wavelet Transform (DWT) based approach has been employed in order to preserve the sharpness of edges of the image. Related work that describes different schemes available in resolution enhancement is as follows.
Demirel et al [14] propose a technique, which uses a Dual-Tree Complex Wavelet Transform (DT-CWT) to decompose satellite images into different sub-band images. The benchmark image is interpolated with half of the interpolation factor used for interpolation of the high-frequency sub-band images, after that, they used the inverse transform (IDT-CWT) to generate a super-resolved image of combined images. Y. Piao et al [15] use inter-sub-band correlation in the wavelet domain to enhance image resolution, and their method utilizes the correlation of sub-bands with different sampling phases in the Discrete Wavelet Transform (DWT).
Li and Orchard [16] developed a novel edge-directed interpolation algorithm which demonstrated significant improvements over linear interpolation on the visual quality of their interpolated images. In [17], C. B. Atkins et al. created a new method for optimal image scaling called Resolution Synthesis (RS), with a simple derivation to illustrate that RS generates the minimum mean-squared error (MMSE) estimate of the high-resolution image, given the low resolution (LR) image. Temizel and Vlachos [18] provide an approach, which estimates local edge orientation from a wavelet decomposition of the available LR image; this information is used to control Cycle Spinning (CS) parameters. No work of this type has previously been applied to SODISM images of the Sun.
Interpolation is the technique that estimates a new pixel value from the neighboring pixels in the original image [19]. However, the computational burden increases as the order of interpolation factor increases [20], a problem that may be resolved by interpolating the image in a sub-sampled wavelet domain. The 2-D DWT of an image is performed by applying the 1-D DWT first along the rows of the image before down-sampling, and then repeating along the columns of the results as shown in the filter band approach of Figure 1. This operation decomposes the original image into four lower resolution sub-bands referred to as low-low (LL), low-high (LH), high-low (HL), and high-high (HH) as shown in Figure 2. The latter three sub-bands occupy the upper frequency spectrum of the original image and the resolution enhancement technique is applied here in this application [21].
Figure 1: Applying the LL, LH, HL, and HH sub-band DWT three times on the lowest sub-band starting from the input image
A transformation related to the DWT, which is also used in the present application as well as in many other image processing applications, is the stationary wavelet transform (SWT) [21] [22], Here, the low and high frequency sub-bands of the SWT are not down sampled and have the same size as the input image.
3. Proposed resolution Enhancement Method
Resolution improvement of SODISM images is done in the wavelet domain; the wavelet coefficients are estimated in order to improve sharpness and observation of the resulting inverse transformed image. Image resolution enhancement using a Discrete Wavelet Transform method has been found to give better results than interpolation techniques both visually and using
4
quantitative measures including filling factors calculated for solar features defined as the proportion of the solar disk covered by the detected feature [9]. Conventional image resolution enhancement methods, such as bilinear and bicubic interpolation methods may generate false information and blurred images because they do not utilize any information relevant to edges in th e original image [15]. Wavelet-based methods can provide a way of doing this, enhancing the image resolution by estimating high frequency information from the given image. They are based on the idea that the image to be enhanced is a low-frequency sub-band among wavelet-transformed sub-sub-bands and the target is to estimate the corresponding high-frequency sub-sub-bands so that an inverse wavelet transform can then be performed to obtain a resolution-enhanced image. The input image to be enhanced is regarded as a low- frequency sub-band in the context of an IDWT. The aim of this work is to estimate the corresponding high frequency sub-bands of the IDWT, so that a resolution-enhanced image can be obtained using the algorithm shown in fig.3. In this work, DWT is used to preserve the high frequency components of the feature image. The redundancy and shift invariance of the DWT mean that DWT coefficients are inherently interpolated.[23].
Down sampling of the DWT sub-bands causes information loss in the respective sub-bands and SWT is used to reduce this loss. Both of the SWT high frequency sub-bands and interpolated high frequency sub-bands have the same size which means they can be added to each other.
The new corrected high frequency sub-bands can be interpolated further for higher enlargement. As well as the low resolution image is obtained by lowpass filtering of the high resolution image [24]. Actually, low frequency sub-band is the low resolution of the benchmark image.
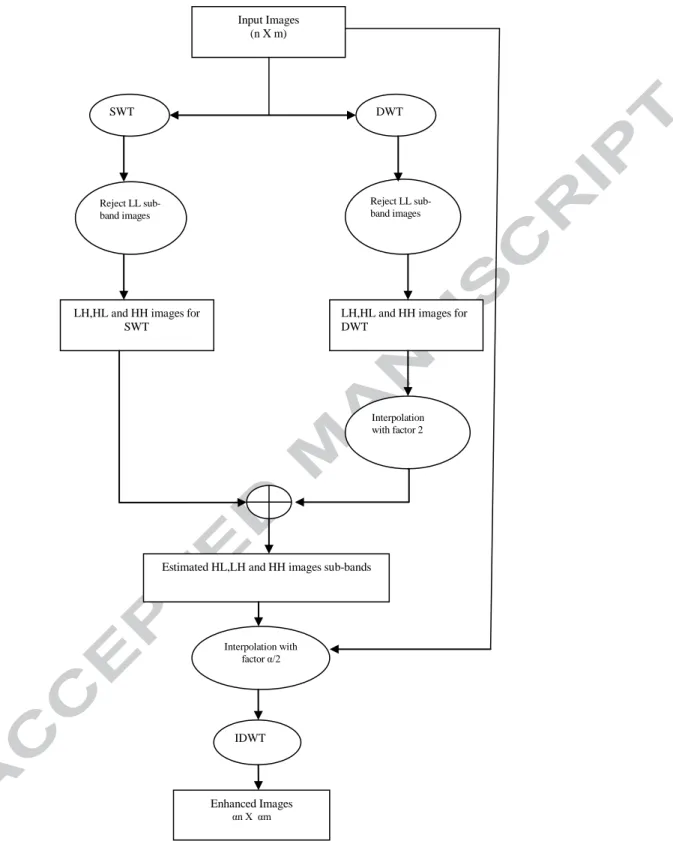
A DWT and an SWT are each used to decompose the input image into four sub-bands. The LL sub-bands are rejected and the pairs of SWT and DWT low-high (LH), high-low (HL) and high-high (HH) sub-bands are combined after the latter have been increased in size to match the former by bicubic interpolation. Assuming the output image is to be interpolated by a factor α over the input image, the high-frequency sub-band images are interpolated by a factor α and the input low resolution image is interpolated by a factor α before they are input to the IDWT to produce the enhanced image.
5
Figure 2: Algorithm to obtain an image enhanced by the proposed technique
Reject LL sub-band images Input Images (n X m) SWT DWT Reject LL sub-band images
LH,HL and HH images for SWT
LH,HL and HH images for DWT
Interpolation with factor 2
Estimated HL,LH and HH images sub-bands
Interpolation with factor α/2
IDWT
Enhanced Images αn X αm
6
4. Assessment method.
The proposed technique has been tested on several SODISM benchmark images taken on the same day at different times and in different wavelengths. The test images used as subjects to be enhanced are obtained by reducing the resolution of original benchmark SODISM images by applying a DWT and preserving the LL sub-band, as illustrated in [1].
Two approaches are used to examine the effectiveness of the enhancement methods used. The first is by visual comparison of the benchmark and enhanced images. The second is to calculate a Peak Signal-To-Noise Ratio (PSNR), for a quantitative comparison, using the following formula:
Here R is the maximum fluctuation in the input image (255 in our case), MSE represents the Mean SquaredError between the benchmark image, Iin, compared with the enhanced image, Iout, defined as follows.
Here M and N are the dimensions of both the benchmark and enhanced images. Both MSE and PSNR measure the similarity of the two images but as the pixel by pixel matching of the two images become perfect. The MSE value decreases to zero while the PSNR increases without limit.
Although the MSE and PSNR provide quantitative measures of the similarity between pairs of images they do not correlate highly with human visual perception. Visual quality assessment measures are also needed to monitor the quality for SODISM images as provided in our results.
The proposal method is applied for seven days per year for five wavelengths except wavelength 215 nm where data not available for 2012 and 2013,
the format of these image files is JPGS and each image has a size of 2048× 2048 pixels
see figure 3.
5. Experimental Results
SODISM images for the five wavelengths 215.0, 393.37, 535.7, 607.1 and 782.2 nm were downloaded1 for the first week of each year from 2010 to 2014 (approximately 900 images in jpg format), when available, and results are shown in Figure 3, but in tables 1 and 2 and on the left sides in Figures 4, 6, 8, 10 and 12 results for only one day only are shown. The latter were taken on the 1st October 2011, near the beginning of satellite operation. The downloaded images are used as the benchmark images and the test images were constructed from them as indicated in Section 4, using a value of 2 for the factor α. The DWT used throughout this work to decompose input images into different sub-bands was the Daubechies 9/7 wavelet transform [10]. Although the data present in the SODISM images are for different times, they represent the closest times available for the different wavelengths, to process by the same technique. It will be noticed from Figures 4 to 13 that the features visible in SODISM images vary from one wavelength to another and from Figure 3 that SODISM images vary with time. These variations are due to:
Out-of-focus optics
Motion blur
Deteriorating instrumental conditions
7
The simulation results presented in this section were obtained using a PC computer with a Core i5 2.5 GHZ CPU processor and 6 GB of RAM, running Windows 7 Home Premium edition and MATLAB_R2012b software.
In this paper, MSE values are used to compare the benchmark images with the enhanced versions of the test images in Figure 3 and Table 1 and PSNR values are used in table 2. As can be seen in Tables 1 and 2, the proposed technique gives nearly a factor 4 improvement in MSE values and nearly a 6dB improvement in PSNR values compared with bicubic interpolation for all five wavelengths. Visual comparisons of test images with corresponding enhanced images are shown in Figures 4 to 13. These all show the improvement of the proposed method of resolution enhancement techniques over bicubic interpolation. A further advantage is that a Bicubic interpolation result took 40 seconds of processing time while the proposed technique took only 10 seconds using the previously mentioned computational environment.
We use magnified local features in order to visually compare SODISM images before and after enhancement in figures 5, 7, 9, 11 and 13. The improved visibility of sunspot regions between the enhance image and corresponding test image can clearly be seen.
Table 1: Comparison of MSE values obtained by Bicubic interpolation and the proposed technique for different wavelengths
Wavelength & Time Bicubic
interpolation Proposed technique
215.0 nm At 02:55:00 am 0.0196 0.005 393.37 nm At 02:47:00 am 0.0966 0.024 535.7 nm At 12:30:00 am 0.1918 0.0489 607.1 nm At 01:01:00 am 0.3530 0.0896 782.2 nm At 02:07:00 am 0.3089 0.0791
Table 2: Comparison of PSNR values obtained by Bicubic interpolation and the proposed technique for different wavelengths
Wavelength & Time
Peak Signal-To-Noise Ratio (PSNR)
Bicubic interpolation WZP Proposed technique 215.0 nm At 02:55:00 am 41.1521 47.0320 47.0902 393.37 nm At 02:47:00 am 34.2144 40.2071 40.2429 535.7 nm At 12:30:00 am 31.2375 35.2195 37.1737 607.1 nm At 01:01:00 am 28.5881 34.5235 34.54 782.2 nm At 02:07:00 am 29.1669 35.0464 35.086
8
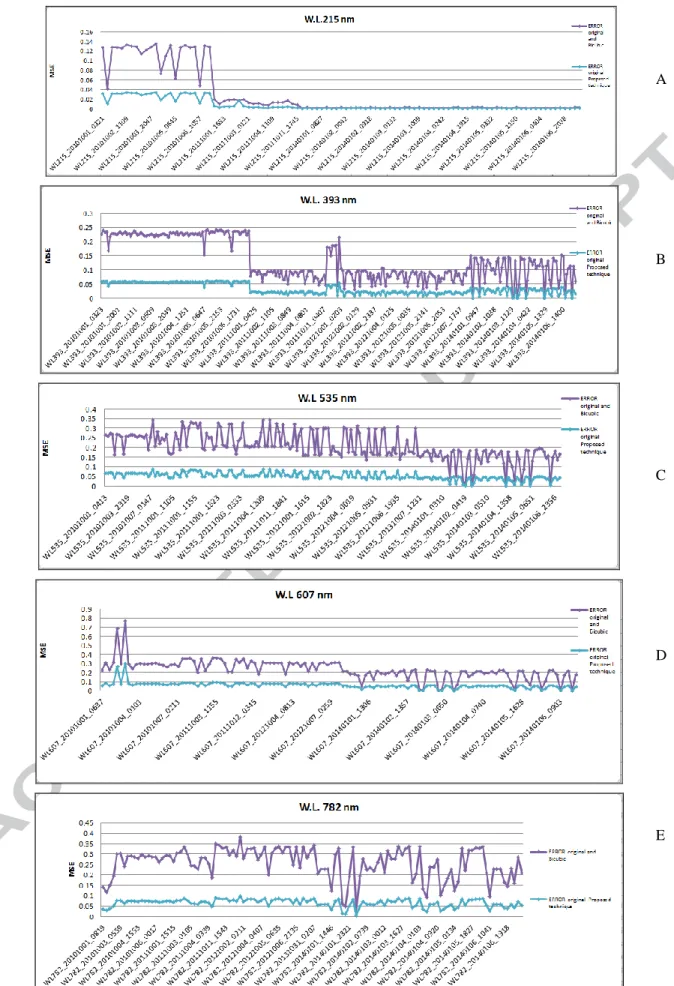
Figure 3: a, b, c, d and e Comparison of MSE values obtained by Bicubic interpolation and the proposed technique for 5 wavelengths over the period 2010-2014
A
B
C
D
E
9
(a)
(b)
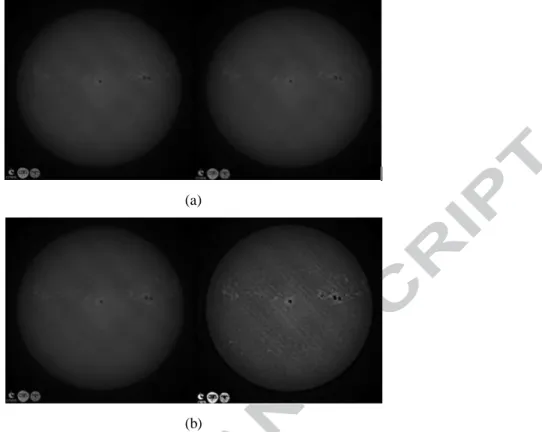
Figure 4: (a): Test image on left and image enhanced by Bicubic interpolation on the right. (b): Reference image on left and proposed technique on right. For WL 215nm at 02:55am
(a)
(b)
Figure 5: (a) Magnified sunspot region for Test image of fig 4(a) and (b) after enhancement by the proposed technique.
10
(b)
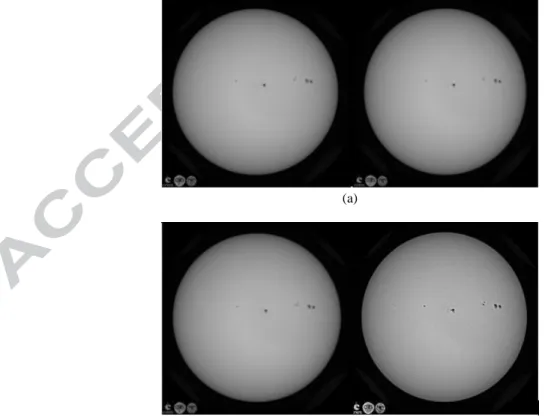
Figure 6: (a): Test image on left and image enhanced by Bicubic interpolation on the right. (b): Reference image on left and proposed technique on right. WL 393nm at 02:47am
(a)
(b)
Figure 7: (a) Magnified sunspot region for Test image of fig 6(a) and (b) after enhancement by the proposed technique.
(a)
(b)
Figure 8: (a): Test image on left and image enhanced by Bicubic interpolation on the right. (b): Reference image on left and proposed technique on right. For WL 535nm at 12:47am
11
(a)
(b)
Figure 9: (a) Magnified sunspot region for Test image of fig 8(a) and (b) after enhancement by the proposed technique.
(a)
(b)
Figure 10: (a): Test image on left and image enhanced by Bicubic interpolation on the right. (b): Reference image on left and proposed technique on right. For WL 607nm at 01:01am
(a)
(b)
12
.
(a)
(b)
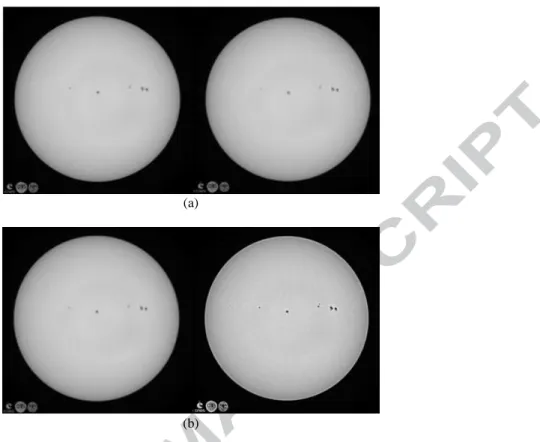
Figure 12: (a): Test image on left and image enhanced by Bicubic interpolation on the right. (b): Reference image on left and proposed technique on right. For WL 782nm at 02:07am
(a)
(b)
Figure 13: (a) Magnified sunspot region for Test image of fig 12(a) and (b) after enhancement by the proposed technique.
6. Filling factor results
As a further test of the proposed enhancement method, the sunspot regions in the benchmark, enhanced and test images for WL 393 and WL 535 have been segmented in an equivalent manner and are shown in figures 14 (a, b and c), and 15 (a, b and c) in red. A numerical comparison of the results of the segmentations is shown in tables 3 and 4. The solar disc is divided into concentric rings about a central circle by 10 progressively larger circles [8][25]. The ratios of the areas of sunspots within each ring to the areas of the corresponding ring, called the sunspots filling factor, are shown in a separate column for each of the images. Also shown in Tables 3 and 4 are the inner and outer radii of each ring (in pixels), RI and RO, expressed as a ratio of the solar radius, the total numbers of segmented sunspot pixels and the solar radius for each image.
13
Figure 14a: Sunspots detected in benchmark image WL 393 nm on 1st October 2011 at 02:47am
Figure: 14b: Sunspots detected in Enhanced image WL 393 nm on 1st Qtober 2011 at 02:47am
14
Figure 15a: Sunspots detected in benchmark image WL 535 nm on 1st October 2011 at 12:30 am
Figure 15b: Sunspots detected in Enhanced image WL 535 nm on 1st October 2011 at 12:30 am
Figure 15c: Sunspots detected in test image WL 535nm on 1st October 2011 at 12:30 am
15
enhanced and benchmark images in the labelled columns.
Index RI RO Test Enhanced Benchmark 1 0.00 0.07 4.100560 3.591427 4.376178 2 0.07 0.16 0.663240 1.019617 1.069726 3 0.16 0.25 0 0.032318 0.06814 4 0.25 0.35 0.117983 0.124814 0.111262 5 0.35 0.45 0.188773 0.271585 0.283712 6 0.45 0.55 0.471932 0.057454 0.084364 7 0.55 0.65 0.310688 0.658951 0.6003 8 0.65 0.75 0.004494 0.019073 0.015427 9 0.75 0.85 0 0.008835 0.012517 10 0.85 0.95 0.002621 0.006108 0 11 0.95 1.00 0 0.03222 0.012083
feature pixels for image A, B and C
1114 4052 3975
Solar radius in pixels 449.8 900.8 900.8
Filling factor % 0.1752536 0.159115 0.156091
7. Conclusions
In order to improve the visibility of solar features such as sunspots, in five wavelengths, a combination of Discrete and Stationary Wavelet decomposition is used for resolution enhancement of PICARD/SODISM images.
900 4132 4107
Solar radius in pixels 449.8 898 898
Overall Filling factor 0.1415798 0.162257 0.161275
Inspecting the results in Table 3, the most obvious difference is that the overall filling factor percentage from the enhanced image is closer to that from the benchmark image than that from the test image. This is reflected in the numbers of feature pixels if the test value is multiplied by a factor 4 to account for the different radius. In the individual rows the results for the enhanced image are closer to the benchmark than the test image in 7 out of 11 cases, the same in one and worse in 3. The biggest discrepancy is in the first row , but taken over the first two rows the enhanced result wins out.
Inspecting the results in Table 4, again the most obvious difference is that the overall filling factor percentage from the enhanced image is closer to that from the benchmark image than that from the test image and this is reflected in the numbers of feature if the test value is multiplied by a factor 4 to account for the different radius. In the individual rows the results for the enhanced image are closer to the benchmark than the test image in 5 out of 11 cases, the same (at 0) in five and marginally worse in 1.
Table 4 The sunspot filling factors for the solar image taken on 1 October 2011 in wavelength 535 nm are shown as percentages for the test, enhanced and benchmark images in the labelled columns.
Index RI RO Test Enhanced Benchmar k 1 0.00 0.07 0 0 0 2 0.07 0.16 2.355988 2.227101 2.105691 3 0.16 0.25 0 0 0 4 0.25 0.35 0.073415 0.128931 0.12435 5 0.35 0.45 0 0 0 6 0.45 0.55 0.162038 0.191629 0.196734 7 0.55 0.65 0.430226 0.392458 0.398384 8 0.65 0.75 0.372882 0.265254 0.251476 9 0.75 0.85 0.012782 0.01178 0.014726 10 0.85 0.95 0 0 0 11 0.95 1.00 0 0 0 Number of feature pixels
16
Many data were used to compare the performance of the proposed technique (around 900 images) at different wavelengths with some state of the art interpolation techniques; it is obvious from Figures (4-8) that the images, enhanced by the proposed technique, are sharper and cleaner than the other methods.
Quantitative comparisons by PSNR and MSE also confirm the effectiveness of the proposed method for resolution enhancement. In all the cases the proposed technique, shows good performance in terms of PSNR, MSE and visual clarity. A further test was done on the proposed enhancement technique, the sunspot regions in the benchmark, enhanced and test images of WL 393 and WL 535 have been segmented in an equivalent manner. A numerical comparison of the results of the segmentations is done. Using the enhanced images for segmentation and calculating the filling factors is a further test of the proposed technique and applied to the sunspot features seen in 393.37 nm and 535.7 nm images shows that an improvement in result is possible by first enhancing the test images using the proposed technique. Inspe cting the results, the overall filling factor percentage from the enhanced image is closer to that from the benchmark image than that from the test image.