Developments in Time-resolved Ultrafast Imaging and
Spectroscopy at Terahertz Frequencies
by wawMunmSsi E
OF TECHNOLOGY
Stephanie M. Teo
B. Sc. in Chemistry, McGill University (2009)
UBRARIES
Submitted to the Department of Chemistry
in partial fulfillment of the requirements for the degree of
Doctor of Philosophy
at the
MASSACHUSETTS INSTITUTE OF TECHNOLOGY
June 2014
@
Massachusetts Institute of Technology 2014. All rights reserved.
Signature redacted
A uthor ...
...
Department of Chemistry
May 21, 2014
Signature redacted
C ertified by
...Keith A. Nelson
Professor of Chemistry
Thesis Supervisor
Accepted by...Signature
redacted
This doctoral thesis has been examined by a Committee of the Department
of Chemistry as follows:
Professor Moungi G. Bawendi...Signature
redacted
...
Chairman, Thesis Committee
Lester Wolfe Professorship in Chemistry
Signature redacted
Professor Keith A. Nelson .... ...
Thesis Supervisor
Professor of Chemistry
Signature redacted
Professor Sylvia T. Ceyer ...
...
Member, Thesis Committee
Developments in Time-resolved Ultrafast Imaging and
Spectroscopy at Terahertz Frequencies
by
Stephanie M. Teo
Submitted to the Department of Chemistry on May 21, 2014, in partial fulfillment of the
requirements for the degree of Doctor of Philosophy
Abstract
Prior to the advent of high energy pulsed femtosecond lasers, the field of terahertz (THz) spectroscopy was stagnated by the lack of both high power THz sources and sensitive THz detectors. Over the past few years, it has become more 'routine' to generate and detect THz radiation between 0.1-10 THz, but there remains much room for improvement. In this work, I describe recent developments in THz detection methodology, both in a waveguide platform and in a more typical free space geometry. In the waveguide approach, THz generation, de-tection, and manipulation is self-contained in an on-chip system that we term the polaritonics platform, which simply consists of a single slab of an electro-optic (EO) crystal called lithium niobate. Due to the experimental geometry, we can conduct time-resolved phase-sensitive imaging of the propagating THz waves in the crystal. Alternatively, more conventional THz spectroscopy requires free space propagation between generation and detection such that a sample could be interrogated if placed between them.
Within this thesis, I present improvements in spatial resolution and signal-to-noise (S/N) to two time-resolved THz imaging instruments on the polaritonics platform: phase contrast imaging and polarization gating imaging. Across both techniques, we attained a best image resolution of less than 1.5 pm (< A/100 at 0.5 THz), which is needed for studying very fine structures and near-fields in the THz regime, and a lowest noise floor of 0.12%, which is attractive for measuring small signals. We used THz imaging to explore wave behavior in metal-clad waveguide systems by employing indium tin oxide (ITO), which is a conductor at THz frequencies, but transparent at visible frequencies. We deemed ITO to behave similarly to an ideal metal, despite its low electrical conductivity. This presents the possibility of fabricating transparent THz-resonant metallic microstructures for near-field studies. Fur-thermore, we studied leaky wave behavior in the metal-clad waveguides, which presents a means for coupling THz radiation out of the waveguide.
Lastly, I describe recent developments in free space THz detection, which traditionally consists of a time-intensive optically gated measurement in a pump-probe geometry called
EO sampling. Unfortunately, this method is not conducive to measurements of irreversible
processes or measurements that involve resolving an additional time axis such as in two-dimensional (2D) spectroscopy experiments. In the new methodology that is discussed here, we instead acquire a THz time trace in a single laser pulse using a pair of transmission-mode glass echelon optics. We demonstrate that this single-shot method is a robust alternative to conventional scanning EO sampling that can quantitatively record THz field temporal profiles with the same S/N approximately 20 times faster than the conventional method. As a prototype 2D measurement, we applied the single-shot method to an optical pump-THz probe study of a indirect bandgap semiconductor, tin sulfide (SnS), which is currently being investigated as a material for solar cell technology. The 2D measurement made it possible to characterize carrier lifetimes and photoconductivity at THz frequencies as a function of carrier relaxation time. This initial demonstration is only the beginning of future exploration of a wide variety of systems, where we intend to extend the technique towards
2D Fourier transform THz spectroscopy to unravel behavior too complex to be resolved by
linear spectra.
Thesis Supervisor: Keith A. Nelson Title: Professor of Chemistry
Acknowledgments
Being decisive has never been my strong suit. As a kid, I imagined being everything when I grew up, so depending on when you asked me, I'd probably tell you something different. My earliest aspiration was to become an artist. Everyday, I'd spend countless hours sketching cartoons and then faxing them to my parents who lived on the other side of the world for most of my childhood. As the years went on, I developed a strong interest in basketball, but unfortunately my promising sports career was brought to a grinding halt by my "average" height. The decision fatigue continued on with aspirations of becoming a chef, a doctor (the other kind), and finally, settling on becoming a scientist. In some ways, where I am today feels a lot like the product of playing Russian roulette. While I never expected to be here, it has been quite the journey, and one that I do not regret embarking on.
Over the years, there have been so many people to help guide me through life, which has made making decisions astronomically easier. The following will be my attempt at thanking them, so here goes.
First off, I have to thank my advisor, Keith Nelson, who took me into his lab when I had no place to call home. Little did I know what I was getting myself into, but even from our first meeting, I knew that he was someone who I would enjoy working for. His support throughout the years was crucial to my development as a discerning researcher, and his ceaseless enthusiasm about anything science was so very contagious. I always liked talking to Keith about results, not just because of his optimism, but because he always made it feel like what you were doing was important (and that one day, just one day, you could save the world).
Upon joining the Nelson group, I never imagined that I would meet such a highly-concentrated group of life-long friends. I might as well have won the lottery on this one because graduate school would have been, in the most polite terms, just plain dull with-out them. The first person I met was Kit Werley. He was just full of useful knowledge, not just in concepts, but also in his ability to mentor. I was as blank of a canvas as they came in terms of ultrafast optics, but this did not deter Kit from imparting me with the foundations that I carried throughout my PhD. Working in the lab, day in and day out, was never tedious as while we busied ourselves with building complex optical setups, we also joked about everything you can and probably can't think of and listened to the latest hits as part of Kit's daily music education. I later met many other members of the lab, who made everyday a little more (and sometimes a lot) of an adventure. Dylan H. Arias, my partner in glare, forever to my right, was a source of calm and ridiculousness to say the least. Pat Wen, his deadpan humor still gets me every time. The Sharly, infinitely wise; Sharly was instrumental in giving me fresh perspectives, especially in times when projects felt like they were doomed to fail. Kara Manke, our senses of humor are forever warped, but I'm glad that we're in it together. Nate Brandt, I'll always remember our hiking adventure in snowy Nagano.. .and the many late nighters. Prasahnt Sivarajah, my fellow Canadian, has
been an incredible addition to Team Polaritonics, and is always up for anything, including a lot of hard work. There are many others who have made my time in the Nelson lab an unforgettable experience: Johanna Wolfson, Colby Steiner, Yongbao Sun, Jeff Eliason, Sam Teitelbaum, Alex Maznev, Jian Lu, and most recently, Brandt Pein.
I also have to thank my two partners in crime in the Nelson lab, both of who made coming into work everyday worth it. This will truly be something that I'll miss and probably never get back. fHarold Hwang, the most inquisitive person I know, was always there to lend a hand, whether it was helping with data interpretation in the lab or picking me up off the ground after a hard Insanity workout. And Ben Ofori-Okai, now where do I start? Ben was the very first person I met at MIT and remains my best friend (and my every-3-hour snack buddy). He dared to teach me how to drive and I dared to teach him how to cook, are we even? Although we initially began in different research groups, I'm thankful that the universe knew better.
There were many others that contributed to my sanity and general well-being. Jennifer Scherer has been the most understanding and supportive friend, always there to lend a listening ear. Marco Jost cheered me on from day one, even when I didn't believe in myself
- this fist bump is for you! Raoul(ie) Correa, my gigling partner, has been "the instigator"
throughout my time here and we all 'thank' him for that. Jian Cui, although we never quite saw eye-to-eye on everything, we had our moments and I cherish them. Elizabeth Lemon, an honorary Nelson group member, I'm glad we passed the psychoanalysis test and that you let us charm you with our craziness. John Regan, it's been an eventful few years. Although I will probably never get all of your references, I'm glad I had you to make me laugh when I needed it most.
In this thesis, many of the projects would not have been possible without the hard work of our collaborators. At Boston University, I had the pleasure of working with Rick Averitt's and Xin Zhang's groups. In Chapter 3, the THz-resonant gold microstructures were made
by Kebin Fan, who has a very impressive repertoire of structures he can fabricate. Also
in Chapter 4, the ITO-coated lithium niobate slabs were fabricated by both Kebin Fan and Congshun Wang. Recently, we had the opportunity to work with Tonio.Buonassisi's group at MIT, in particular Rafael Jaramillo and Vera Steinman, for the tin sulfide thin film samples in Chapter 6. They were very helpful and responsive, especially in a very short period of time with a lot of stress!
Over the years, I'm very happy to have friends who stuck with me through what seems to be the test of time. They were a breath of fresh air outside of my bubble here at MIT. Simone Pereira and Wayne Mah have been pillars of support ever since the good old days in college and I'm sure there are many more to come. To my oldest friends, Tessa Mathew and Chanel Bayram, it only seems like yesterday that we talked about where we would be in 10 or 15 years (and how so very old we would be) - well here we are! I must also thank my undergraduate advisor and my physical chemistry professor, Dr. Grazyna Wilczek, who has shaped me to become the scientist I am today. Coming from a big school, I found it
difficult not to feel like just a number, but Dr. Wilczek was a steady and endless source of encouragement throughout my years at McGill. She taught me to not doubt myself and forced me to excel beyond my comfort zone, and I try to live by her words every day.
Last, but definitely not least, the constant driving force behind the scenes has been the love, encouragement, and relentless support of my parents. They have been my cheerleaders throughout life, and I am grateful for all the sacrifices they have made for me and my siblings. Ahnee, as close as a mother to me, took care of us even before I was born, whether it was bringing us to Taekwondo, swimming, skating, or skiing lessons - you name it, she was there. She has been a very important source of advice and guidance.. .and she never fails to make me laugh (even if she doesn't know it). And to my siblings, Trey, Gill, and Ben, I honestly couldn't have asked for a better crew of the same genetic makeup to experience all of the stages that life has to offer. I am so excited to see where the future takes us and to have all of you by my side.
Stephanie Teo May 29, 2014
Contents
1 Introduction to Terahertz Imaging and Spectroscopy 23
2 Terahertz Generation in Bulk and Waveguided Systems 33
2.1 Introduction ... ... 33
2.2 Terahertz Generation in Bulk Materials ... 36
2.2.1 Optical Rectification ... . 36
2.2.2 Collinear Phase-matched THz Generation in Zinc Telluride ... 38
2.2.3 Phonon-Polariton Generation in Lithium Niobate ... 44
2.3 Terahertz Generation in Waveguided Systems . . . . 53
2.3.1 Derivation of Modes in Anisotropic Slab Waveguide . . . . 53
2.3.2 Experimental Broadband and Narrowband THz Generation in Lithium N iobate . . . . 71
3 Terahertz Detection Methodology 81 3.1 Introduction . . . . 81
3.2 Point-source THz detection . . . . 82
3.2.1 The Electro-optic Effect . . . . 82
3.2.2 The Pockels Effect in Zinc Blende Crystals . . . . 88
3.2.3 The Pockels Effect in Lithium Niobate . . . . 93
3.2.5 Electro-optic Sampling . . . .
3.2.6* Pump-probe Geometry for Time Domain THz Detection . . . . 3.2.7 Signal Detection with Data Acquisition System . . . .
3.3 Phase-sensitive THz Imaging Techniques . . . .
3.3.1 Introduction to THz Imaging in the Polaritonics Platform . . . .
3.3.2 Experimental and Results . . . .
3.3.3 Conclusions . . . .
THz Metallic Slab Waveguides,
4.1 Introduction . . . . 4.2 Bound Modes in Planar Metal Slab Waveguides . . . . 4.2.1 TE Modes in Asymmetric and Symmetric Metal Waveguides . . . . .
4.2.2 TM Modes in Asymmetric and Symmetric Metal Waveguides . . . . . 4.3 ITO-coated Planar Waveguides ...
4.3.1 Experimental Setup ...
4.3.2 Data Analysis and Discussion . . . . 4.3.3 Conclusions ... ...
5 Single-shot THz Detection
5.1 Introduction . . . .
5.2 Review of Existing THz Single-Shot Methods . . . . 5.2.1 Frequency-to-time Encoding with a Chirped Probe . . . . 5.2.2 Space-to-time Encoding with Non-collinear Geometry or
Collinear Tilted Probe Intensity Front . . . .
5.2.3 Space-to-time Encoding with Time Domain Non-collinear Second-harmonic Cross-correlation . . . . 161 . . . . . 161 . . . . . 165 . . . . . 167 . . . . . 168 . . . . . 170 4 97 101 103 109 109 113 128 129 129 130 132 138 144 145 146 158
5.2.4 Temporal cross-correlation using Linear Spectral
Interferometry . . . .
5.2.5 Angle-to-time Encoding with Transmissive dual echelons
5.2.6 Summary of Single-shot Methods . . . .
5.3 Amplitude Encoding Spectral Interferometry . . . . 5.3.1 Experimental Design . . . .
5.3.2 Methodology and Data Processing . . . .
5.3.3 Experimental Results and Discussion . . . . 5.4 Dual Echelons Method . . . . 5.4.1 Experimental Design . . . . 5.4.2 Methodology and Data Processing . . . . 5.4.3 Experimental Results and Analysis . . . .
5.5 Conclusions and Outlook . . . .
6 Terahertz Photoconductivity of Semiconductors 6.1 THz Transmission Experimental Setup . . . . 6.2 THz Transmission . . . . 6.3 Frequency-resolved Optical Density and Lifetimes 6.4 Complex Index of Refraction and Conductivity .
6.4.1 Thick Film Limit . . . . 6.4.2 Thin Film Limit . . . .
. . . . 172 . . . . 174 . . . . 175 . . . . 177 . . . . 177 . . . . 180 . . . . 186 . . . . 189 .. ... 189 . . . 195 . . . 204 . . . 210 213 . . . . 214 . . . 217 . . . . 219 . . . . 222 . . . 223 . . . 227
List of Figures
1-1 The electromagnetic spectrum . . . . 23
1-2 Polaritonics platform for waveguided THz waves . . . . 26
1-3 ITO metallic slab waveguides . . . . 27
1-4 Single-shot THz detection . . . . 31
2-1 Phase matching and coherence lengths in optical rectification in ZnTe . . . . 41
2-2 Experimental THz generation in ZnTe . . . . 43
2-3 Phonon-polariton dispersion in LN along extraordinary axis . . . . 49
2-4 Optical Rectification in bulk LN . . . . 51
2-5 Symmetric waveguide experimental geometry . . . . 54
2-6 Waveguide coordinate system . . . . 55
2-7 TE dispersion curves in LN . . . . 61
2-8 TE waveguide mode profiles . . . . 63
2-9 Effective phase and group indices of TE modes in LN . . . . 64
2-10 TM dispersion curves . . . . 69
2-11 Effective phase and group indices of TM modes in LN . . . . 70
2-12 TM mode profiles . . . . 70
2-13 Broadband THz generation in a LN waveguide . . . . 73
2-14 Experimental THz broadband generation in LN Waveguide . . . . 74
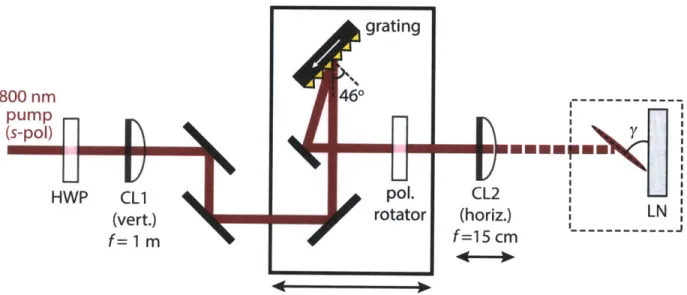
2-15 Narrowband pumping geometry . . . . 75
2-16 Experimental narrowband THz generation in the waveguide . . . . 76
2-17 Narrowband experimental pumping geometry . . . . 77
2-18 Tilt angles for narrowband THz generation . . . . 78
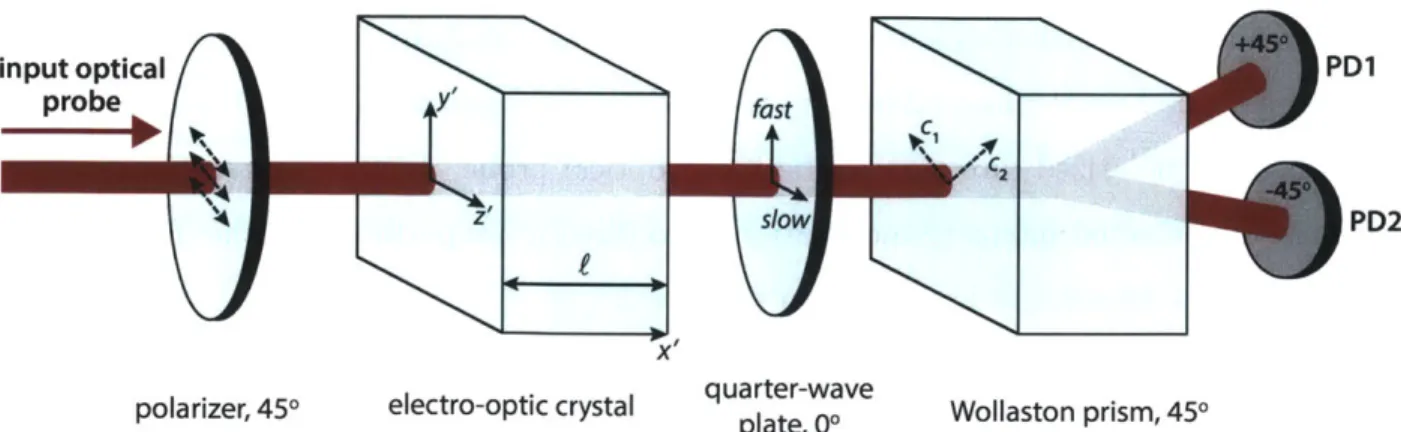
3-1 3-2 3-3 3-4 3-5 3-6 The optical indicatrix . . . . Two coordinate transformations in zinc blende EO crystals Experimental EO probing geometry in zinc blende crystals Ideal EO sampling geometry in LN . . . . EO sampling pump probe geometry . . . . DAQ system layout . . . . 3-7 The implementation of differential chopping in the DAQ system . . . . 84 . . . . 89 . . . . 92 . . . . 98 . . . . 102 104 . . . . 108
3-8 Movie frames of propagating THz waves . . . 111
3-9 Phase contrast imaging experimental diagram . . . 115
3-10 Phase-contrast imaging of a pair of antennas at 30x magnification . . . 116
3-11 Experimental setup for polarization gating imaging . . . 119
3-12 THz wave propagation recorded with polarization gating imaging . . . 122
3-13 Noise images using CCD and CMOS based cameras . . . 125
3-14 Wave vector-dependent noise distribution . . . 126
4-1 Asymmetric and symmetric metal slab waveguide geometries . . . 131
4-2 TE dispersion curves and effective indices in asymmetric metal-clad waveguide 134 4-3 TE modes in an asymmetric metal-clad waveguide . . . 135
4-4 TE dispersion curves and effective indices in a symmetric metal-clad waveguide137 4-5 The lowest three TE modes in a symmetric metal-clad waveguide . . . ... . 137
4-6 TM dispersion curves and effective indices in an asymmetric metal-clad waveg-uide . . . 141
4-7 The lowest three TM modes in an asymmetric metal-clad waveguide . . . 142
4-8 TM dispersion curves and effective indices in a symmetric metal-clad waveguide142 4-9 TM modes in a symmetric metal-clad waveguide . . . 143
4-10 A schematic illustration of the ITO-coated waveguide on the polaritonics plat-form ... ... ... . . .. . . . .... 145
4-11 Experimental image processing . . . 147
4-12 TE and TM dispersion curves in asymmetric ITO waveguides . . . 148
4-13 Guided and leaky waveguide modes . . . 149
4-14 Leaky TM waves in asymmetric ITO waveguides . . . .. 151
4-15 Leaky waves resemble Fabry-Perot cavity modes . . . 153
4-16 Propagation of leaky TM waves . . . 154
4-17 Reflection efficiency of TE waves in asymmetric ITO waveguides . . . 156
4-18 Decay length and Q-factor of TE waves in an asymmetric ITO waveguide . . 157
5-1 Comparison of single-shot THz methods and conventional EO sampling . . . 166
5-2 THz spectral interferometry experimental setup using amplitude encoding schem e . . . 178
5-3 THz spectral interferometry data processing . . . 185
5-4 Calculated results for the (+) polarization demonstrating the methodology . 186 5-5 Direct comparison between THz spectral interferometry and conventional EO sam pling . . . 188
5-6 The experimental setup showing convenient switching between dual echelons and delay-line methods and balanced EO detection . . . 190
5-7 Reflective echelon design . . . 193
5-9 Temporal broadening in fused silica . . . 201
5-10 Data processing in dual echelons single-shot THz method . . . 203
5-11 Direct comparison of dual echelons method and conventional EO sampling . 205 5-12 Probe noise traces where THz pump is blocked and total number of pulses acquired is maintained between both echelons and delay-line methods . . . . 207
5-13 Noise traces extracted with no optimization of the initial grid . . . 209
5-14 Noise traces with optimization of relative grid location . . . 210
6-1 Optical pump-THz probe experimental setup . . . 215
6-2 Optical pump-THz probe 2D time traces with echelons . . . 216
6-3 Transmission spectra for sample and reference . . . 218
6-4 Optical density spectra . . . 220
6-5 Normalized OD spectra . . . 221
6-6 Carrier lifetimes in SnS thin films . . . 222
6-7 Complex index of refraction of BK7 glass substrate . . . 225
-Chapter 1
Introduction to Terahertz Imaging
and Spectroscopy
I I I I
100MHz 1GHz 10GHz 100GHz
Figure 1-1: The electromagnetic spectrum. The electronics and photonics regimes.
I I I
10THz 100THz 1PHz
THz gap (0.1-10 THz) is shown to lie between the
In the electromagnetic spectrum, there is a region between electronics and photonics called "the terahertz (THz) gap". This gap, ranging from 0.1-10 THz (1 THz = 1 ps = 300 pm = 33 cm-1 = 4.1 meV = 47.6'K), faces many technological challenges in terms of efficient generation and sensitive detection. For THz generation, the output power of electronic oscillators decreases at higher frequencies due to higher heat dissipation from the electrons, while the emission of photons from a blackbody drops precipitously at lower frequencies according to Planck's law. Similarly, because THz radiation occurs on picosecond timescales,
the rapidly oscillating THz fields are too fast for electronics to respond, but simultaneously too slow for optical technologies. The field of THz spectroscopy has consequently lagged appreciably behind its counterparts across the electromagnetic spectrum. However, shortly after the advent of high energy pulsed femtosecond lasers, D. H. Auston and coworkers showed that it was possible to generate ultrafast broadband THz pulses by propagating femtosecond optical pulses in electro-optic (EO) materials in 1984 [1].
The development of technologies at THz frequencies has been spurred by its fundamental importance in many physical, chemical, and biological processes. For example, there exists an abundance of resonances within the THz range such as molecular rotations in gases, vibrational transitions in molecular crystals, or electronic resonances in quantum wells and quantum dots. Currently, THz spectroscopy has been used in the identification of chemical or biological materials by taking advantage of a material's unique THz resonance(s) or for studying semiconductor or protein dynamics that occur on picosecond timescales. THz radiation has also made an appearance in higher resolution airport security body scanners and biomedical sensing. However, there is still much development and understanding needed
of processes occurring in the THz regime.
With the increasing bandwidth demands of a technologically-driven society, there has also been an impetus to develop THz telecommunications since only a small portion of the electromagnetic spectrum is currently allocated (radio frequencies from 9 kHz to 275 GHz). The development of THz technologies is also motivated by the impending deviation from Moore's law within this decade, which postulates the doubling of the number of transistors per integrated circuit every two years. The deviation results from the physical limitations of electronic-based transistors, with atomic-level features being the final stop for electronic computing, all the while assuming that they can be efficiently fabricated. Alternatively, all-optical computing has been vetted as a promising next-generation technology, in which electron signal carriers are superseded by photons that move at the speed of light; in this respect, moving to the THz range is a natural initial step. For example, significant
ma-nipulation of the polarization of THz light was observed as it propagated through a thin mercury telluride film under an applied external magnetic field at room temperature [2]. This resulted in a giant Faraday effect, which suggests its application in fast modulation optical transistors by simply tuning the gate voltage and/or magnetic field.
In this thesis, the central thrust that fueled the projects that I will be discussing was in the development of THz detection technologies; not only for the purpose of making the current types of measurements easier, but to extend our capabilities to measurements that were not possible just a few years ago. Firstly, it is important to understand why THz detection must be viewed as a new challenge compared to well-established detection technologies in the optical and microwave spectral ranges. In the THz regime, the relatively large wavelengths make it difficult to use regular optical components such as mirrors or lenses or to even use our intuitive sense of Gaussian beam propagation since it is impractical to treat THz beams as collimated over large propagation distances. By definition, a beam is said to be collimated if it has a Rayleigh length (z, = 7rw/A, where wo is the beam radius and A is the wavelength) that is much longer than its propagation distance. For visible wavelengths,
a collimated beam typically has a 1 mm beam waist and so the ratio of the Rayleigh length to the wavelength varies from 5 to 20 million. Scaling this ratio to the terahertz regime for
300 pm wavelength (i.e. 1 THz), even on the lower end of the ratio, means that the beam
radius has to be 40 cm! Manufacturing and working with optics on this length scale is not practical, which has fundamentally stalled the development of a THz spectrometer device comparable to optical spectrometers in terms of its ease of use and compactness.
As a solution, THz waves are detected by encoding the THz signal onto optical frequency light, where electronic and optical components can be taken advantage of. However, this requires a time-intensive process through a pump-probe measurement in the time domain and subsequent Fourier transforming of the temporal waveform to obtain the THz spectrum.
Of course, the development of THz detection goes hand in hand with that of THz generation,
Chap-ter 2 describes current methodologies used for ultrafast, pulsed THz generation, which rely on the use of an amplified laser system and a nonlinear process called optical rectification in various electro-optic generation crystals. In Chapter 3, I approach THz detection from two distinct fronts: THz imaging in waveguided platforms and more conventional free space THz spectroscopy. (a) (b)
800 nm
0
pum
**
ITO
THz
LiNbO3
Figure 1-2: Polaritonics platform for waveguided THz waves: (a) A thin slab of LiNbO3 allows for the
generation, control, and detection of THz waves. Focusing an ultrafast near-infrared pump pulse through the slab generates THz waves that are waveguided laterally down the slab. (b) A snapshot of an image recorded using phase contrast imaging with magnification of 17x and shows a 530 GHz wave interacting with a resonant antenna pair (masked in black for clarity).
In the waveguide platform, called the polaritonics platform [3], THz waveguide modes
are generated and detected directly in a single 30-50 pm thick crystal of lithium niobate
(LiNbO3) as seen in Fig. 1-2(a). This effectively circumvents any of the technical issues for THz optics previously described and the added difficult of guiding the THz waves into or out of the waveguide. Lithium niobate is an electro-optic crystal, which means that an applied E-field changes the index of refraction of the crystal. Subsequently, the index change induces a phase shift in an optical probe beam that also passes through the crystal, which can be detected by using a phase-sensitive detection scheme. Unique and convenient to this platform is the fact that the THz wave, generated by a focused optical pump beam, travels laterally in the slab and hence allows us to conduct time-resolved imaging of its lateral propagation with an ultrafast, expanded optical probe beam.
Recently, I have improved the spatial resolution and signal-to-noise (S/N) ratio of two THz imaging techniques called phase contrast imaging and polarization gating imaging [4]. In phase contrast imaging, I developed an imaging system that is capable of resolving features with subwavelength resolution of less than 1.5 pm (< A/100 at 0.5 THz) and a 0.2% noise floor; this represents a 4-fold improvement in resolution compared to other methods [5]. Figure 1-2(b) shows an example of the propagation of a THz wave at one instance of time, interacting with a metal antenna structure deposited on the surface of lithium niobate. This system presents new opportunities for studying very fine structures and near-fields in the THz regime. In addition, I further improved another technique called polarization gating imaging that is typically employed for more quantitative measurements since it has a lower noise floor of 0.12%, an improvement of up to 5-fold over previous designs, and also more than sufficient spatial resolution better than 5 pm.
(a) ( 0
1.0
W0.5
00 50 100 150
P(rad/mm)
Figure 1-3: ITO metallic slab waveguides: (a) A time series of images of a TE mode THz electric field,
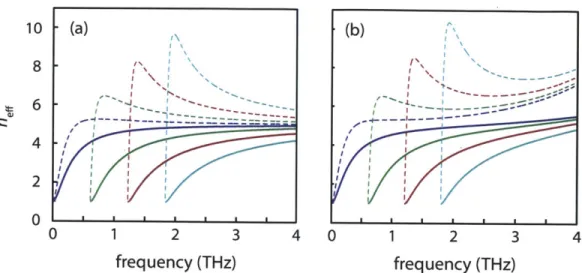
collected using polarization gating imaging. The left side of the dashed line shows plain slab LN, where the THz waves are generated. The right side of the dashed line shows a region that has been coated with THz-transparent metallic ITO layer, where the waves are observed to propagate underneath. (b) Waveguide dispersion curve for TE waves in a LN waveguide (thickness f = 54 pm) with ITO deposited on one surface. Dispersion of air and bulk LN extraordinary (eo) and ordinary (o) waves are shown in yellow. Analytical solutions in dashed red are overlaid on the experimentally observed results. Inset: calculated Ez-field profiles of the two lowest order TE modes at 1 THz.
Following the development of these high-resolution and low-noise THz imaging
tech-niques, I wanted to further exploit advantages of the compact, on-chip platform. In addition to the simultaneous generation and detection of THz waves on a single chip, the platform
is capable of manipulating and furthering our understanding of 'itHz wave behavior and its propagation characteristics under different conditions. In Chapter 4, I studied a system composed of a metal clad planar waveguide, where the 'metal' used was a wide bandgap semiconductor, indium tin oxide (ITO). The key property that makes ITO an attractive material in our system is the fact that it is transparent to visible light (i.e. the optical imaging probe beam), but opaque (or metallic) at THz frequencies. Figure 1-3(a) shows an example of the visibility of a propagating THz wave in lithium niobate underneath the ITO layer, as given by the experimental geometry in Fig. 1-2(a). We confirmed that ITO behaves similarly to an ideal metal by comparing its waveguide dispersion to that provided
by analytical theory [6], in which the measured dispersion curves in Fig. 1-3(b) showed good
agreement.
Our motivation to study THz waves in this metallic clad geometry was two-fold. Firstly, in a previous study of ours, we deposited a pair of THz-resonant gold dipole antennas sepa-rated by a small gap, similar to that shown in Fig. 1-2(b), on the surface of lithium niobate and quantitatively studied the THz near-field enhancement that was primarily localized in the subwavelength gap [7]. However, the near-fields cannot be measured underneath gold, as it is opaque to the optical probe light, but measurement of the near-fields would be accessible in resonant microstructures fabricated out of ITO. Secondly, because coupling light into and out of the waveguide is very difficult, a required mechanism if the chip were designed as a signal modulation component in a device, it was natural to study leaky wave behavior. As opposed to bound waveguide modes that make up the propagating solutions to Maxwell's equations, leaky waves are unbound and as given by their name, leak or couple out of the waveguide.
In the second area of focus for the development of THz detection methodology, I returned back to the idea of a THz spectrometer where the THz waves propagate in free space (as opposed to in a waveguide). As I previously stated, because of the speed limitations of electronic instrumentation, THz detection is a time domain method, called electro-optic
sampling, that requires an iterative process to map out the temporal THz waveform by measuring it at many sequential time points. In other words, in the pump-probe geometry, an ultrafast optical probe is used to 'gate' the THz electric field and so we can resolve the field with time resolution on the order of the pulse duration of the optical probe (typically 100 fs or less). The underlying assumption here is that the process being measured is reversible and repeatable since effectively, the experiment is repeated over and over again, but measured at a different moment in time. Following a Fourier transform of the time domain data, the THz pulse's spectral content is attained, and so free space THz spectroscopy becomes analogous to frequency domain methods such as those used in optical or near-infrared detection.
The fact that the detection requires a time-intensive process becomes a problem in the measurement of processes that are irreversible since it may only be feasible to use a limited number of probe pulses (i.e. a very short observation window with little to no averaging) before the material has changed significantly through processes such as an irreversible chem-ical reaction, degradation, or complete destruction. Even in systems that are reversible, the time-intensive nature of the measurement negatively impacts any two-dimensional (2D) spec-troscopy measurement that involves resolving a second time-axis. While there is a wealth of information that can be learnt from linear THz spectra, much of this information is often dif-ficult to interpret. 2D measurements can help to untangle potentially convoluted responses in linear spectra by adding another axis by which we can observe the system's response as a result of an additional applied perturbation. In one aspect, 2D measurements aid in the understanding of the correlation between different degrees of freedom in a system; for exam-ple, in studying how excitonic states couple to low-lying phonon states, or how mechanical energy is transferred to high-frequency molecular bond vibrations in energetic materials. However, these kinds of experiments require substantial scaling up of experimental time (i.e.
1D scan: ~-, n time points, 2D scan: ~, n 2 time points, etc.), and are only practical with
faster acquisition techniques.
de-tection schemes that acquired a THz time trace in a single probe pulse, which means that no iterative mapping out of the THz waveform is needed. To date, there exist several single-shot THz detection techniques, but while they have demonstrated the ability to measure a THz waveform, they have mainly been developed towards the purpose of diagnostics. In Chap-ter 5, I surveyed the single-shot techniques for ones that could be adapted to quantitatively measure THz electric fields with good S/N, with the end goal of surpassing conventional electro-optic sampling in terms of acquisition time. Of the two methods I tested, only one method was successful, based on a pair of transmission-mode glass stair-step optics called echelons (see Fig. 1-4(a)). When the probe beam passes through a thin and a thick echelon, each with m steps, it is split into an array of tiny 'beamlets' that are delayed incrementally in time relative to one another. The more glass a beamlet passes through, the longer the time delay. Each beamlet derived from a single probe pulse measures a different temporal slice of the THz electric field. Figure 1-4(b) shows a direct comparison of the THz time traces acquired from both the single-shot method and the conventional scanning delay-line method, which demonstrates good agreement in both amplitude and spatiotemporal wave-form. The corresponding THz spectra in Fig. 1-4(c) corroborate these findings with near to identical spectral content. Most importantly, the system was optimized to acquire low-noise traces by careful selection and implementation of optical and hardware components. Overall, the single-shot system was capable of attaining the same S/N as that of the conventional scanning method in only 1/ 2 0th the number of laser pulses, which poses a significant source of time-saving.
Although the single-shot THz detection system is not as compact in size as an optical spectrometer, there is still an obvious benefit to its significant reduction in acquisition time. The last study discussed in Chapter 6 was conducted with the aim of fully integrating the THz single-shot detection technique into a 2D measurement and evaluating its efficiency in a real scenario. This initial measurement serves as a prototype for future 2D Fourier transform THz spectroscopy, in which we intend to use a THz pump, and probe a system
1 n
(a) echelons H x 20 -- echelons (c)
--- delay-line 0.5 I -5 h x0 10 -4 -2 0 2 4 0 1 2 3 time (ps) frequency (THz)
Figure 1-4: Single-shot THz detection: (a) A schematic of the pair of transmission-mode glass echelons.
A probe beam is passed through the crossed echelons and split into a train of small beamlets that are delayed
incrementally in time relative to one another. (b) A direct comparison of THz time traces between the dual echelons method and scanning delay-line method. (c) Fourier transforms of the time traces given in (b).
with responses that may have very strong frequency-dependence in the THz regime.
Time domain measurements, where both the amplitude and phase of the THz electric field are obtained, have an important added value since it allows us to measure complex optical properties (e.g., index of refraction, conductivity) of materials. The 2D measurement consisted of an optical pump-THz probe experimental setup, which was capable of measuring the minority carrier lifetime and photoconductivity of a thin-film semiconductor, tin sulfide (SnS), at THz frequencies. The carrier lifetime, the average time it takes for the carriers to relax to the bottom of the conduction band, is an important metric for characterizing the carrier dynamics in solar cell materials such as SnS [8]. In these indirect band gap semi-conductors, defect sites contribute significantly to the carrier lifetime, which has important consequences on device efficiency.
Generally speaking, the development of new techniques opens the door to new varieties of measurements. Naturally, it is important to ask: what are the immediate potential sys-tems and physics readily accessible to us as a result of the techniques developed thus far? In the near future, we intend to explore the electronic-phonon coupling in other optically-pumped systems such as organic crystals and quantum dots. As THz generation techniques continue to improve, there exists the possibility for even stronger driving of nonlinear THz
responses, which will help in the elucidation of the nature of vibrational couplings in molecu-lar systems. Additionally in the pomolecu-laritonics platform, it may be possible to measure surface plasmon phonon-polaritons by studying the modified dispersion curves, for example as a re-sult of the coupling between surface plasmons in graphene and phonon-polaritons in LN [9]. These are just a few possibilities of systems worth investigating; further understanding of the capabilities and limits of these new techniques will help guide the way towards other interesting and unexplained phenomena.
Chapter 2
Terahertz Generation in Bulk and
Waveguided Systems
2.1
Introduction
The strong drive to developing THz spectroscopy was aided by the discovery that THz radiation with suitable spectral brightness could be generated, propagated in free-space, and then separately detected [10, 11]. The significance of this simple scheme was that a sample could be placed between the generation and detection components and consequently it provided a means for spectroscopic characterization of materials in the THz regime. This was the era dominated by the photoconductive antenna, where an ultrafast laser pulse is used to generate carriers in the conduction band of a semiconductor between a pair of antennas under a voltage bias. The acceleration of carriers across the biased antenna creates a time-varying electric current that consequently reradiates electromagnetic radiation in the form of a THz pulse. The requisite generation source is a Ti:sapphire non-amplified laser (an
oscillator with -, 10 nJ/pulse) that has been shown to provide a bandwidth up to 5 THz [12],
excitation pulse; additionally, the resulting bandwidth of the THz pulse is associated with the characteristic response time of the carriers instead of the excitation pulse duration.
With the shift to amplified lasers with higher pulse energies (~ 1 mJ/pulse), photocon-ductive antennas in the geometry described above are no longer feasible since these focused pulses would destroy the material. This led to the development of large-aperture antennas
that had much larger gaps (~,, 3 orders of magnitude) between the antenna electrodes and so non-focused excitation pulses could be used, but this consequently required much larger bias voltages since the THz field strength scales directly with gap size. This approach yielded almost 1 jpJ/pulse [13]. However, a more practical system for attaining higher bandwidths uses a nonlinear process called optical rectification in an electro-optic (EO) crystal, which more fully utilizes the short pulse durations available fron femtosecond lasers without the need of an applied voltage. These nonlinear crystals have an instantaneous optical response (compared to the dependence on the rise time of the photo-induced current in photocon-ductive antennas), where THz generation occurs through nonresonant second-order optical nonlinearities [14].
Over the past decade, there has been significant improvement in the efficiency of tabletop THz generation sources. Higher efficiency sources are important for linear THz spectroscopy and even more for the coherent control of materials and nonlinear THz spectroscopy. In contrast to more easily implemented collinear optical rectification in zincblende crystals like zinc telluride (ZnTe) and gallium phosphide (GaP), commonly used as THz probes in time-domain THz spectroscopy, optical rectification in the ferroelectric crystal lithium niobate (LiNbO3, LN) has proven fruitful for high field THz generation by exploiting its large nonlin-ear optical parameters. Noncollinnonlin-ear optical rectification by using a tilted optical pump pulse front has reported pulse energies of 10-30 gJ/pulse [15,16] with relatively high pump-to-THz energy conversion efficiencies. In LN, there is strong coupling between THz electromagnetic waves and select polar lattice vibrational modes involved in the ferroelectric phase transition. The result is the generation of THz phonon-polaritons, quasiparticle analogs to alternating
current signal carriers in electronics or electromagnetic waves in photonics, which propagate at the speed of light in the material. More recently, the magnitudes of peak THz fields have even made it possible to "do chemistry" by obtaining sufficiently large field amplification in the gaps of THz resonant microstructures [7] to change the properties of materials (e.g., insulator-to-metal phase transition in vanadium dioxide [17]), a significant advancement to measurements previously limited to a material's intrinsic THz response.
An alternate to the free-space THz generation described thus far, called the polaritonics platform [3], was developed in the Nelson group for generation, control, and detection of THz waves on a single LN sample. Due to the large difference in the index of refraction at THz frequencies compared.to the optical spectral range, the THz phonon-polariton waves travel primarily in the lateral direction. As a result, the different propagation directions allow for easy separation of the optical pump beam and the THz signal beam. Additionally, the sample thickness can be scaled down to the subwavelength regime to create a THz waveguide that confines the THz wave and hence creates propagating waveguide modes. Applications of this integrated platform include a means for signal processing, an architecture or testbed for photonic devices and optical components, integration of bandgap or homogenized materials, long THz-sample interaction lengths, and waveguide spectroscopy.
In this chapter, I will firstly detail broadband THz generation in bulk materials resulting from collinear and noncollinear optical rectification in ZnTe and LN, respectively, and their experimental implementation. Subsequently, I will discuss the general scheme of the polari-tonics platform in the waveguide regime including analytical calculations of the generated THz waveguide modes in various geometries and polarizations, and experimental broadband and narrowband THz generation.
2.2
Terahertz Generation in Bulk Materials
2.2.1
Optical Rectification
Generally, a nonlinear optical process may be viewed from the macroscopic polarization of a medium as a function of the light-matter interactions'
P(w) = o(X1)E(w) + X(2)E2(W) +
X(3)E3(w) + ...)(2.1)
= P(')(w) + PNL(W)
where co is the permittivity in free space, X) is the ith-order susceptibility tensor, E(w) is the incident E-field , P) is the linear polarization term, and PNL(w) is the collective
sum of all nonlinear polarization terms. Optical mixing is a nonlinear process where waves of two frequencies w, and w2 combine to yield new frequency components [18]; only with
high-intensity pulses, such as those from amplified lasers, must the higher order terms in (2.1) that make up the nonlinear responses be considered. In a nonlinear medium, these light waves mix to generate sum-frequency generation, W1 + w2, and difference-frequency
generation, wi - w2 (among other nonlinear optical processes). For two light interactions at
the same frequency, w, = W2, the resulting wave mixing gives second-harmonic generation (SHG) and direct current (dc) pulses. In the case of an ultrafast pulse, the wave mixing
may occur within the pulse's broad spectral bandwidth itself, where the Fourier components of the driving optical spectrum interfere to create a beating polarization at the difference frequency. This is a special case of difference-frequency generation called optical rectification. The difference-frequency generation process that produces a pulse at THz frequency Q can be described by the following second-order nonlinear polarization created by two optical
pump fields:
p( ) = CO (( = W, - w2)E1(wi)E2(w2) (2.2)
= EoX(2)(Q)E(wopt + Q)E*(wopt) (2.3)
whereXy 2) is the second-order nonlinear susceptibility tensor and Ej(wi) = E(w0pt + Q)
and E2(w2) = E(wpt) are the pump fields at optical frequencies spanning wopt to w0pt + Q.
Difference-frequency mixing generates pulses with frequencies that lie in the range of dc to
, where for ultrafast near-infrared pump pulses, the bandwidth Q lies in the THz range.
Consequently, the polarization of the difference-frequency pulse corresponds only to the envelope of the optical pump fields and no information of the pump phases is retained. It is important to note that difference-frequency generation is only relevant for a crystal without inversion symmetry since this is an even-order process. The lowest order nonlinear response for a crystal with inversion symmetry would be a x(3)-response; it is not the main mechanism
for THz generation and so its treatment is omitted here.
The nonlinear interaction of the pump fields creates an oscillation of dipole moments throughout the atoms in the medium with a component at frequency Q. The resulting nonlinear polarization, p(2)(Q), serves as the source term in Maxwell's equations, where the generation and propagation of the THz E-field may be given by the wave equation for nonlinear optical media [19]. In the frequency-domain, the wave equation is:
E~)-Q2(1 Q2
V x V x E(r,) - 2= (Q))E(r, Q) = 2P(2)(r, ), (2.4)
C EOC
where =(1)
(Q)
= O(+
X()()) and c is the speed of light in vacuum. A solution tothe wave equation yields the THz spectrum, E(Q), which is determined by the material properties contained in the dielectric function =(l) (Q). In the time-domain, if we assume an
isotropic medium, the wave equation simplifies to:
E(1) 82E(r, t) 1 02p(2) (r, t)
V x VxE(r,t) + -- -t ~ 02 02 ,(2.5)
C2 t2 EOc2 &t2
where E(l) is a scalar quantity. The wave equation in the time-domain shows that the THz E-field is the second time derivative of the optically induced nonlinear polarization, which resembles the envelope of the optical pump fields. Because the time-dependent optical pump E-fields can be represented by Gaussian envelopes, the THz waveform resembles the second derivative of a Gaussian function.
2.2.2
Collinear Phase-matched THz Generation in Zinc Telluride
2.2.2.1 The Phase Matching Condition and Coherence Length in ZnTe
For broadband optical rectification in ZnTe in a collinear geometry, higher signal generation calls for longer interaction lengths of the pump fields in the crystal, but a closer inspection of the phase matching condition is required in bulk crystals compared to generation in very thin
EO crystals [20,21] . In this case, the wave equation in (2.4) must be satisfied in particular
for the difference-frequency component: Q = w, - W2. Physically, the dipole moments of the atoms in the medium are oscillating with a phase that is dependent on the phase of the incident pulses; only when the dipoles oscillate in phase (in accordance with the phase matching condition to be determined) will the emitted fields interfere constructively and the overall magnitude of emission at Q increase directly with the number of radiating atoms.
A trial solution to (2.4) when a nonlinear source term is present is a plane wave at
frequency Q propagating along the +z-direction (i.e. along the medium's thickness, L):
E3(z,
Q)
= A3(z,Q)ei(k3z-nt)
+ c.c., (2.6)at Q. The nonlinear source term can be represented as:
Pa2 (z, 2) = p3()ei(ki-k2)ze-i't + c.c., (2.7)
where p3(Q) = EoV2)(f)A1(wi)A*(w 2). The behavior of how the amplitude of the THz
E-field changes as it propagates along +z is given by the first derivative of A3 (z, Q) with respect
to z, which is found by substituting E3(z, Q) in the wave equation'
dA3 _ 2_ SQ2p 3()eiAkz (2.8) dz 2Eon3c where Ak = k- k2-k3 (2.9) Ak = k(wopt + Q) - k(wpt) - k(Q)
Ak is called the wavevector mismatch and so the difference frequency generation is maximized
(or "phase matched") when Ak = 0.
The importance of the phase matching condition is more easily seen by the dependence of the intensity of E3(z, Q) on Ak when it propagates through a nonlinear medium of length
L. Firstly, the amplitude at z = L is found by integrating (2.8) from z = 0 to z = L:
Q2 Lil
A3(L, Q) = p3(- ) e Akzdz (2.10)
Q2 eiAkL_
= -P3(0) . , (2.11)
'This requires simplification of the wave equation such that V x V x E = V(V -E) - V2E -V 2E. The
contribution from V.E is negligible as a result of invoking the slowly varying amplitude approximation [18,19]: 1!d2 < Ik3 z
-then the intensity is calculated as follows:
|A3(L, Q)12 = 2EonAco Q2P3(Q) 2L 2sinC2(AL
2 (2.12)
13(L, Q) = 13c(L,
Q)
sinc2 2According to (2.12), only when Ak = 0 is the intensity of the THz field component at Q
maximized after propagating a length L.
However, this condition assumes a constant phase relationship between the generated and propagating waves. In reality, the process is not perfectly phase matched since the driving polarization at Q goes in and out of phase repeatedly with the generated field E3(z, Q) =
ETHZ(Z, ) and the conversion efficiency oscillates as sin(AkL/2) instead. The
non-phase-matched case is described by a characteristic length called the coherence length:
Lcoh = ir/Ak. (2.13)
The efficiency of broad-bandwidth generation through optical rectification in nonlin-ear crystals is dominated by material properties and not the spectral bandwidth available from the optical pump. In ZnTe, it is not possible to phase match across the entire THz spectrum due to strong phonon resonances at THz frequencies that cause significant dis-persion. Consequently, there is a large difference between the index of refraction at optical
(n0pt(800 nm) = 2.85) and THz (nTHZ > 3 from 0-4 THz) frequencies . However, the
dis-persion in the optical refractive index can be taken advantage of to achieve longer coherence lengths by matching the phase velocity of the THz wave, Vph,THz, with the group velocity of
the optical pump, vgr,0pt [14]. The coherence length for optical rectification can be given by:
7rco
frequency (THz) 4 3 2 1 0 0.70 0.75 0.80 0.85 0.90 0 wavelength (p~m) 1 2 3 frequency (THz)
Figure 2-1: Phase matching and coherence lengths in optical rectification in ZnTe. (a) The index of refraction at optical and THz frequencies and also the optical group index. The optical indices at 800 nm are indicated on the plots. Due to a THz phonon resonance at 4 THz, the THz index experiences large dispersion such that phase matching with the optical index is too difficult, but collinear phase matching with the optical group index is feasible. (b) The coherence length in ZnTe as a function of THz frequency
by phase matching the phase velocity of the THz wave with the group velocity of the optical pump at 800
nm. With a 1 mm thick ZnTe crystal, there is adequate phase matching up to 2.4 THz before the generation efficiency quickly diminishes.
where
ngr,opt = nopt (AOpt) - AOpt dr Apt (2.15)
is the optical group index and nTHz = C/Vph,THz is the THz index of refraction. The optical
[22] and THz [23] refractive indices of ZnTe have been measured as the following:
2 = 4.27 + 3 - 0.142), (2.16)
where A is the optical wavelength in pm.
(2.17)
nTHz = (289.27 - 6f Hz)/(29.16 - f6Hz)'
where fTHZ = Q/21r is the frequency in THz. The optical and THz refractive indices and
optical group index are plotted in Fig. 2-1(a), where it is clear that while there is a large refractive index mismatch at THz frequencies compared to the optical pump at 800 nm, the
0 0 x 3.8 3.4 3.0 (b) ..-. nT~
(f)
(a) - n () nopt~k n =33 gr-opt nopt=2.85 10' n 0 =D (+ Ar 30 100 10-1 4optical group index at 800 nm demonstrates adequate group velocity dispersion to match the THz index over a broader range of frequencies. Because it is not useful to generate THz fields with an EO crystal thicker than the coherence length, it can be seen in Fig. 2-1(b) that a 1 mm thick ZnTe crystal has optimal phase matching between the THz index and the optical group index for a bandwidth of 2.4 THz; even at 2 mm thickness, the bandwidth is only reduced slightly to 2.2 THz but the generation intensity is estimated to increase by 4-fold according to (2.12). Beyond this bandwidth, the dispersion in the THz index becomes too large to be compensated by the optical group velocity dispersion.
2.2.2.2 Experimental Setup for Optical Rectification in ZnTe
Experimental implementation of optical rectification in ZnTe is straightforward since it re-quires a collinear phase matched geometry between the optical 800 nm pump beam and emitted THz beam. We directed a collimated, s-polarized ultrafast laser pulse (800 nm cen-ter wavelength, -'0.76 mJ/cm2, 50-fs transform-limited pulse duration) to overfill a 2 mm (110) ZnTe generation crystal (~-.- 1 cm beam diameter) and rejected the outgoing optical light with a piece of teflon and black polypropylene. THz generation was optimized by tuning the azimuthal angle of the crystal [24]. The THz beam was then focused with a pair of parabolas into a 1 mm ZnTe detection crystal, where the THz signal is measured by a technique called EO-sampling. This detection method will be discussed in the next chapter. Figure 2-2(a) shows an example of a THz time trace recorded with ZnTe, where a strong THz pulse is seen followed by smaller, fast oscillations; these oscillations are the free-induction decay resulting from THz absorption of ambient water vapor. The THz spectrum in Fig. 2-2(b) is simply the Fourier transform of the time trace in (a), where 10% of the maximum bandwidth is at
~,-2.2 THz as estimated from the coherence length previously calculated in Fig. 2-1(b). With an amplified ultrafast laser, optical rectification in zincblende crystals is typically the easiest route to obtaining moderate field strengths for a relatively broad bandwidth of 2.5
2 mm <110> ZnTe (a) 8 0 -4 -8 10-1 0, 3 10-2 C 10-10-4 1 fl -10 -5 0 5 10 0 1 2 3 time (ps) frequency (THz)
Figure 2-2: Experimental THz generation in ZnTe. (a) Percent signal modulation time trace of a THz signal generated by collinear phase matching in 2 mm of (110) ZnTe crystal. The fast oscillations following the main THz pulse is the free-induction decay (FID) due to THz absorption by the rotational modes of ambient water vapor. (b) The THz spectrum of (a) with 10% of the maximum bandwidth at ~2.2 THz as estimated 'from the coherence length previously. The narrow resonances (giving rise to the long ringing of the FID) of water correspond to the sharp drops in the spectral intensity across the generated bandwidth.
THz. However, the overall optical-to-THz conversion efficiency and attainable bandwidth are determined by the inherent properties of ZnTe. For example, it is difficult to maintain a large coherence length by optical group and THz phase velocity matching near the optic phonon resonance at 4 THz. The relevant effective nonlinear optical coefficient, although reasonably high in ZnTe (d14 = 61 pm/V in ZnTe vs. d3 3 = 154 pm/V in LN [25]), strongly affects the generation efficiency. However, the potential of these high nonlinear constants has not been fully realized since at moderately high optical pump fluences (> 0.5 mJ/cm2 [26,27]),
there is saturation of THz generation in ZnTe due to a two-photon absorption process at
800 nm in the narrow bandgap (~ 2.25 eV) semiconductor; consequently a red shift is
observed in the THz spectrum. This has a two-fold effect: the generation of free carriers leads to absorption at THz frequencies, and the two-photon absorption depletes the optical pump (although not to a large extent) [27]. Three-photon and four-photon absorption have similarly been observed to limit generation in GaP and LN, respectively. As a result,
large-(b)