This paper is available online free of all access charges (see http://jxb.oxfordjournals.org/open_access.html for further details)
ReseaRch PaPeR
Identification and quantification of phytochelatins in roots
of rice to long-term exposure: evidence of individual role on
arsenic accumulation and translocation
Bruno Lemos Batista1,2, Meher Nigar3, Adrien Mestrot4, Bruno Alves Rocha5, Fernando Barbosa Júnior2,
Adam H. Price3, Andrea Raab6, and Jörg Feldmann6,*
1 Centro de Ciências Naturais e Humanas, Universidade Federal do ABC, Bloco B, Av. dos Estados 5001, Santo André (SP), Brazil 2 Faculdade de Ciências Farmacêuticas de Ribeirão Preto, Universidade de São Paulo, Bloco A, Av. do Café s/n, Ribeirão Preto (SP), Brazil
3 Institute of Biological and Environmental Sciences, University of Aberdeen, Cruickshank Building, St Machar Drive, Aberdeen AB24 3UU, Scotland, UK
4 Soil Science Group, Institute of Geography, University of Bern, Hallerstrasse 12, 3012 Bern, Switzerland
5 Departamento de Química, Faculdade de Filosofia Ciências e Letras de Ribeirão Preto, Universidade de São Paulo, Avenida Bandeirantes, 3900, Ribeirão Preto (SP), Brazil
6 TESLA (Trace Element Speciation Laboratory), Department of Chemistry, University of Aberdeen, Meston Walk, Aberdeen AB24 3UE, Scotland, UK
* To whom correspondence should be addressed. E-mail: [email protected]
Received 27 August 2013; Revised 12 December 2013; Accepted 17 December 2013
Abstract
Rice has the predilection to take up arsenic in the form of methylated arsenic (o-As) and inorganic arsenic species (i-As). Plants defend themselves using i-As efflux systems and the production of phytochelatins (PCs) to complex i-As. Our study focused on the identification and quantification of phytochelatins by HPLC-ICP-MS/ESI-MS, relating them to the several variables linked to As exposure. GSH, 11 PCs, and As–PC complexes from the roots of six rice cultivars (Italica Carolina, Dom Sofid, 9524, Kitrana 508, YRL-1, and Lemont) exposed to low and high levels of i-As were compared with total, i-As, and o-As in roots, shoots, and grains. Only Dom Sofid, Kitrana 508, and 9524 were found to produce higher levels of PCs even when exposed to low levels of As. PCs were only correlated to i-As in the roots (r=0.884, P <0.001). However, significant negative correlations to As transfer factors (TF) roots–grains (r= –0.739,
P <0.05) and shoots–grains (r= –0.541, P <0.05), suggested that these peptides help in trapping i-As but not o-As in
the roots, reducing grains’ i-As. Italica Carolina reduced i-As in grains after high exposure, where some specific PCs had a special role in this reduction. In Lemont, exposure to elevated levels of i-As did not result in higher i-As levels in the grains and there were no significant increases in PCs or thiols. Finally, the high production of PCs in Kitrana 508 and Dom Sofid in response to high As treatment did not relate to a reduction of i-As in grains, suggesting that other mechanisms such as As–PC release and transport seems to be important in determining grain As in these cultivars. Key words: Arsenic transfer factor, arsenic uptake, HPLC-ICP-MS/ESI-MS, phytochelatins, rice.
Introduction
Rice (Oryza sativa L.) is a global staple food which needs monitoring for contaminants. In a market basket survey in the United States, rice was found to have higher concentrations
of inorganic arsenic (i-As) than other commodities (Schoof et al., 1999). Other studies demonstrated that this cereal accu-mulates more arsenic (As) in shoots and grains than wheat
This is an Open Access article distributed under the terms of the Creative Commons Attribution License (http://creativecommons.org/licenses/by/3.0/), which permits unrestricted reuse, distribution, and reproduction in any medium, provided the original work is properly cited.
and barley (Williams et al., 2007). Rice consumption may therefore represent a significant risk, mainly when As is pre-sent in its inorganic forms, arsenite (AsIII) and arsenate (AsV), which are class 1 non-threshold carcinogens (ATSDR, 2007; Meharg et al., 2009).
Arsenic uptake by rice plants depends on several factors. Cultivation under flooded conditions (Xu et al., 2008), irri-gation with As contaminated water, as well as soil naturally contaminated with As all increase the levels of this element in rice grains (Saha and Ali, 2007; Lu et al., 2009; Meharg et al., 2009). Organic As (o-As) species (dimethylarsinic acid (DMA) and monomethylarsonic acid (MMA)) are absorbed to a lesser extent than i-As (Raab et al. 2007b). AsIII and AsV are mostly carried via silicate and phosphate transporters, respectively, probably due to molecular similarities with silica and phosphate (Meharg et al. 1994; Ma et al., 2006; Zhao
et al., 2010). After entering the root cells, AsV is readily
con-verted to AsIII and the Lsi1 efflux channels can expel AsIII out of the root or into the xylem (via Lsi2), leading to transport into shoots and grains (Ma et al., 2006; Zhao et al., 2010). Another defence system based on binding i-As in roots is the formation of As–phytochelatin complexes and their seques-tration into cell vacuoles (Raab et al., 2005, 2007a; Song et al., 2010). The ability to synthesize phytochelatins (PCs) depends on genetic factors and the availability of sulphate (Cobbett and Goldsbrough, 2002; Zhao et al., 2010; Duan et al., 2011).
PCs are derived from glutathione (GSH). Zhang et al. (2010) and Duan et al. (2011) observed that sulphur and GSH/PC deprivation increased As translocation in rice from roots to shoots and from shoots to grains, respectively. Duan et al. (2011) reported diverse patterns of As and PC accumu-lation in rice plants from different cultivars. They concluded that PCs have a specific role in As translocation and As accu-mulation in rice grains, without identification or quantifica-tion of the involved thiols.
The aim of this study was to compare PC production and As–PC complex formation in six different rice cultivars exposed to long-term high and low As levels in order to study their influence on the As translocation in plants. The use of high performance liquid chromatography (HPLC) hyphen-ated simultaneously to inductively coupled plasma mass spectrometry (ICP-MS) and electrospray mass spectrometry (ESI-MS) allowed simultaneous identification and quantifica-tion of As–peptide complexes and peptides without the need for authentic standards. Furthermore, the potential of these thiol compounds to serve as biomarkers for As exposure and their relationship to As translocation in rice were evaluated.
Materials and methods
Reagents
Ultra-pure water (Elga Ltd., High Wycombe, Bucks, UK) was used throughout the experiments. All reagents used were of analytical grade. Formic acid (98%), nitric acid (67%), and hydrogen perox-ide (30%) were purchased from Fluka (UK). Potassium phosphate dibasic (99%), di-sodium arsenate (Na2HAsO4.7H2O) and N-acetyl-cysteine (99%) were purchased from Sigma–Aldrich. MMA and
DMA were purchased from Strem Chemicals (Newburyport, USA). Elemental standard solutions (Ge, Ga, and As, 1000 mg l–1) were obtained from High Purity Standards (Charleston, USA) and meth-anol from Fisher (London, UK).
Instruments
The instruments used for speciation were an Accela HPLC system coupled (split 1:4) with an ICP-MS Element 2 and an ESI-MS LTQ Orbitrap Discovery (Thermo Fisher Scientific, Germany) for the determination of PCs and As–PC complexes. For As species deter-minations in grains, an 1100 HPLC system coupled with an 7500c ICP-MS (Agilent Technologies Stockport, Cheshire, UK) was used. Total As analysis was performed using an ICP-MS Agilent 7500c.
Rice cultivation conditions
Six different rice cultivars (Oryza sativa L.), Italica Carolina (IC), 9524 (9), Lemont (L), Kitrana 508 (K), Dom-Sofid (DS), and YRL-1 (Y) were selected from the Rice Diversity Panel 1 (Zhao et al., 2011). The rice lines were selected based on a study of grain arsenic in over 300 cultivars grown in the field in Bangladesh and China (Norton
et al., 2012) where Lemont was low in both, Dom Sofid and Italica
Carolina were low in Bangladesh but high in China, 9524 and Kitrana 508 were high in Bangladesh and low in China, and YRL-1 was high in both. In addition, in Bangladesh, 9524 and YRL-1 were identified as having a high shoot to grain As transfer factor while Dom Sofid and Italica Carolina were low.
After germination, plants were individually potted (eight plants each) and grown under flooded conditions (2.0 l-pots, soil immer-sion under 3–4 cm of water) and greenhouse conditions. The soil used for the experiment contained an average of 7.5 mg As kg–1 at the outset (low exposure level). Half of the plants from each cultivar received, after transplanting, 10 mg As in the form of AsV per pot (high exposure level). During growth the plants were regularly fer-tilized using Yoshida’s nutrient solution (Yoshida et al., 1976) and grown until the grains were mature without additional exposure to As. Just before harvesting, plant height, grain length (with husk), and the internodes stem diameter (mean of smaller diameter of the first internodes of all stems from a single plant) were measured by using a caliper ruler.
Sample preparation
Shoot lengths and all plant weights were determined after harvest-ing. Soil from each pot was collected and the individual plant parts (grains, shoots, and roots after removing the soil) were weighed. A portion of fresh roots (~25 g) were washed with tap water for 10 min and placed in 100 mM phosphate solution (Meharg and
MacNair, 1992) to remove any surface-bound As.
Fresh root materials were used for the determination of the As–PC complexes and thiol compounds present. Sample prepa-ration followed the procedure described in Raab et al. (2004) and
Bluemlein et al. (2008). Briefly, roots were ground in liquid
nitro-gen and extracted on ice for 1 h with 1% (v/v) formic acid. After centrifugation, the supernatant was immediately injected into the HPLC-ICP-MS/ESI-MS. This method has been shown in plants to guarantee the integrity of the As–PC complexes and to prevent de novo synthesis of As–PC complexes during extraction and analysis
(Bluemlein et al., 2008, 2009). The standards of DMA and
N-acetyl-cysteine were daily prepared for the quantification of As and sul-phur, respectively.
Plants and soil were individually ground and oven-dried at 50 oC for the determination of dry weight, total As (t-As), and specia-tion of i-As and o-As in grains. Samples for total As were digested with nitric acid/hydrogen peroxide in an open microwave system (MARS5, CEM). Three reference materials (NIST SRM 1568a, IAEA 140 TM, and NCZ2C73007, rice grains, algae, and soil, respectively) were used for quality control purposes. For i-As and
o-As determination, grains were extracted following the procedure
of Sun et al. (2009). Briefly, ground grains were extracted with 1%
(v/v) nitric acid using the microwave system above. The supernatant was mixed 1:5 v/v with hydrogen peroxide and stored overnight for complete oxidation of AsIII to AsV (Hansen et al., 2010). Then the samples were injected into a HPLC-ICP-MS.
Conditions used during speciation
As-PCs and thiol-compounds. These compounds were sepa-rated using a reversed-phase column (Eclipse, XDB-C18, 5 µm, 150 × 4.6 mm, Agilent) with a linear water/methanol (0.1% formic acid) gradient from 0–20% methanol (Accela HPLC system). The column was kept at 30 °C, the autosampler compartment at 4 °C and 0.1 ml sample was injected. The column effluent was split with one part going into the ICP-MS (Element 2) mixed via a T-piece with Ga as the internal standard. The ICP-MS was used in medium resolution with nickel cones and a PFA micro-nebulizer. The instru-ment was optimized using standard conditions. The rest of the col-umn effluent was directed into an OrbiTrap ESI-MS optimized daily and calibrated using standard conditions, and used in positive mode (capillary voltage 4.5 kV) with 30 000 resolution. MS2 spectra were recorded when the signal intensity was above 50 000 counts. Then the influence of the gradient on the ICP-MS signal was calculated daily according to the procedure published by Amayo et al. (2011). Compounds were identified from the mass spectra and quantified using N-acetyl-cysteine and DMA, respectively (see Supplementary
Table S3 available at JXB online).
Inorganic and methylated As. The separation of i-As and o-As in grains was performed using a Hamilton PRP X-100 column (10 μm, 150 × 4.1 mm) and the column oven set to 30 °C. Mobile phase (1 ml min–1 flow rate) consisted of 6.66 mM NH
4H2PO4 and 6.66 mM NH4NO3 at pH 6.2 (Williams et al., 2005). Sample volume injected was 50 µl. The outlet of the HPLC (Agilent 1100) was connected to the ICP-MS (Agilent 7500c) via a T-piece used for mixing the inter-nal standard (Ga 10 µg l–1) into the column effluent. The ICP-MS was optimized daily for maximum sensitivity and used in normal mode. DMA was used for calibration and quantification was done based on peak areas. DMA, AsV and MMA standard solutions were used for the identification of species (retention time).
Arsenic transfer factor evaluation
The soil/roots, soil/shoots, soil/grains, roots/shoots, roots/grains, and shoots/grains As transfer factors (TFs) were calculated follow-ing the procedure published by Raab et al. (2005), where the total As in the plant part of destination is divided by the total As in the origin sample.
Statistical analysis
The results were analysed by one-way ANOVA followed by Duncan’s multiple range test and critical ranges and correlations were tested by Pearson. Statistica (V 6.0) and SigmaStat (V 3.5) statistical soft-ware packages were used. The confidence interval used was set to higher than 95%.
Results
Total As concentration and agronomic parameters
The recovery of certified reference materials varied between 49% for soil and 105% for plant materials. Soil As concen-trations were 7.0 and 14.9 mg kg–1 for low and high expo-sure levels, respectively (Fig. 1). The soil As availability to plants depends on factors such as mineral composition (Fe, P), organic matter content, redox potential and others
(Tu and Ma, 2003; Cao and Ma, 2004). Since these factors were similar for all plants, it was enough to confirm at which level the different groups were exposed to As. The high sure level was achieved by spiking the soil used for low expo-sure levels with AsV. At low exposure levels, total arsenic (t-As) in roots varied from 6.9 mg kg–1 in YRL-1 to 92.1 mg kg–1 in Kitrana 508, in shoots from 6.7 mg kg–1 in 9524 to 22.3 mg kg–1 in Italica Carolina, and in grains from 0.4 mg kg–1 in 9524 to 1.0 mg kg–1 in Italica Carolina (Fig. 1). At high exposure levels, Lemont and Italica Carolina presented the lowest and highest concentrations, respectively (roots: 64.8 and 373.0 mg kg–1; shoots: 13.5 and 38.2 mg kg–1; grains: 0.7 and 2.1 mg kg–1, respectively; Fig. 1). The comparison between low and high exposure samples per cultivar showed significant differences (P <0.05) between t-As concentrations in roots, shoots, and grains in five cultivars. Lemont did not show a significant difference upon exposure to different As levels in soil (Fig. 1).
Generally, all plants per cultivar exposed to high As levels or not, flowered at the same time and the number of shoots were not different between low and high exposure plants (see Supplementary Table S1 available at JXB online). High As con-centrations in soil significantly reduced plant height only for Italica Carolina (–11.7%) which also showed a reduced total plant mass. Lemont was the only cultivar where the shoot diam-eters were reduced (–21.4%) (see Supplementary Table S1 avail-able at JXB online). High As treatment reduced grain yield by 13.9–54.7% in all six cultivars. Exposure to elevated As reduced the grain size for Italica Carolina, 9524, and Kitrana 508 (see Supplementary Table S1 available available at JXB online).
Positive strong correlations were observed between all agronomic parameters (flowering, plant height, shoots’ diameters, weight of roots, shoots, and whole plant). Grain weights were strongly correlated with the weight of roots, shoots, and, consequently, the whole plant (see Supplementary Table S2 available at JXB online). Total As influenced all these parameters. Significant negative correlations were found between (i) t-As in: soil, roots or shoots versus grain weights; and (ii) t-As in shoots versus stem diameters, weight of roots, shoots, and grains (see Supplementary Table S2 available at JXB online).
Arsenic transfer factors
The TF is the measurement of the plant’s potential to take up a specific element/compound from soil, transferring it to roots, shoots and grains (Carbonell et al., 1998; Raab et al., 2007b). All cultivars, except Lemont, showed significant difference in TFsoil–root depending on As exposure, varying between 2.7 and 28.5 (Fig. 2A). TFroot–shoot were only significantly differ-ent for 9524 and YRL-1 (Fig. 2B). YRL-1 had the highest TFroot–shoot compared with other cultivars (Fig. 2B). As expo-sure did not significantly affect TFshoot–grain ratios (P >0.05) to any cultivar (Fig. 2C). High exposure to As significantly reduced TFssoil–grain for Lemont and Kitrana 508 (Fig. 2D). Exposure to elevated As reduced TFsroot–grain for all cultivars (Fig. 2E), whereas TFsoil–shoot were independent of exposure level (Fig. 2F).
IC(L) IC(H) DS(L)DS(H) 9(L) 9(H) K(L) K(H) Y(L) Y(H) L(L) L(H) 0 5 10 15 20 25 30 35 40 As transf er factor (so il-roots)
Cultivar IC(L) IC(H) DS(L) DS(H) 9(L) 9(H) K(L) K(H) Y(L) Y(H) L(L) L(H) -0.2 0.0 0.2 0.4 0.6 0.8 1.0 1.2 1.4 1.6 1.8 2.0 2.2 2.4 2.6 2.8 As tr ansf er fa ct or (r oot s-shoo ts ) Cultivar
IC(L) IC(H) DS(L)DS(H) 9(L) 9(H) K(L) K(H) Y(L) Y(H) L(L) L(H) 0.00 0.02 0.04 0.06 0.08 0.10 0.12 As tr an sf er fact or (s ho ot s-gr ai ns ) Cultivar
IC(L) IC(H) DS(L)DS(H) 9(L) 9(H) K(L) K(H) Y(L) Y(H) L(L) L(H) 0.00 0.05 0.10 0.15 0.20 0.25 0.30 As tr ansfer factor (soil-grains) Cultivar
IC(L) IC(H) DS(L)DS(H) 9(L) 9(H) K(L) K(H) Y(L) Y(H) L(L) L(H) -0.02 0.00 0.02 0.04 0.06 0.08 0.10 0.12 0.14 0.16 0.18 0.20 0.22 0.24 As tr an sf er fa ct or (r oo ts -g ra ins) Cultivar
IC(L) IC(H) DS(L)DS(H) 9(L) 9(H) K(L) K(H) Y(L) Y(H) L(L) L(H) 0.0 0.5 1.0 1.5 2.0 2.5 3.0 3.5 4.0 4.5 5.0 5.5 As tr an sf er fa ct or (soi l-s hoot s) Cultivar
Fig. 2. Arsenic transfer factors between soil and plant parts from the cultivars studied. Results presented as mean ±standard deviation. IC, Italica
Carolina; DS, Dom Sofid; 9, 9524; K, Kitrana 508; Y, YRL-1; L, Lemont; (L), low exposure; (H), high exposure; statistical differences between low and high exposure samples, *P <0.05; **P <0.01.
Fig. 1. Total arsenic concentration on a dry weight basis in soil and rice tissue from six cultivars exposed to low and high arsenic concentrations. Results
presented as mean ±standard deviation; n=4; IC, Italica Carolina; DS, Dom Sofid; 9, 9524; K, Kitrana 508; Y, YRL-1; L, Lemont; (L), low exposure; (H),
Arsenic species in grains
The species identified in grains were i-As as AsV, MMA, and DMA. No cationic species such as tetramethylarsonium, as found by Hansen et al. (2010), were present in grains. NIST 1568a rice flour was used as the reference material for extrac-tion efficiency (~85%) and species quantificaextrac-tion, which was similar to other studies reported in the literature (Batista et al., 2011).
Regarding the low exposure level, i-As concentrations ranged from 221 ng g–1 for Lemont to 772 ng g–1 for Italica Carolina and o-As from 49 ng g–1 for YRL-1 to 238 ng g–1 for Kitrana 508. Under these conditions, the main specie found in grains was i-As for all cultivars (Fig. 3). By con-trast, exposure to high As levels increased the amount of t-As (Fig. 1) mainly due to o-As species in grains (Fig. 3). In this case, i-As levels ranged from 237 ng g–1 for Lemont to 888 ng g–1 for YRL-1 and o-As from 71 ng g–1 for Lemont to 725 ng g–1 for Italica Carolina. Considering all the
experiments, t-As, i-As, and o-As were positively correlated with each other (P <0.05).
As–PC complex and thiol compound concentrations
Rice, similar to most grasses, produces a variety of PCs. By using MS and MS2 data members of the following groups were identified: PCs, γ(GluCys)nGly) n=2–4; Ser–PCs, γ(GluCys)nSer n=2–4; Des–PCs, γ(GluCys)n n=2–3; and Glu–PCs, γ(GluCys)2Glu n=2–3. Roots exposed to high As levels also contained, in addition to free-PCs, a variety of As–PC complexes in the extract. Dominant among these were As–PC3, As–PC4, As–Des–PC3, EC–As–EC–PC2, As– (Des–PC2)2, As–Des–PC4, As–Ser–PC3, As–Ser–PC4, and As–Glu–PC3. The mixture of PCs such as (γ-GluCys)nGlu, (γ-GluCys)nGly, (γ-GluCys)nSer, and (γ-GluCys)n is charac-teristic of the Poaceae family (grasses) (Klapheck et al., 1994; Cobbett and Goldsbrough, 2002) (see Supplementary Table S3 available at JXB online; Fig. 4). Non-complexed As was
High Exposure
IC DS 9524 kitrana yrl-1 lemont
As co nc en tr at io n ( ng. g -1 ) 0 500 1000 1500 2000 2500 34.4% 24.1% 44.4% 25.1% 51.2% 38.9% 43.4% 21% 14.7% 55.2% 11.4% 37.8% Low Exposure 0 500 1000 1500 2000 2500 o-As i-As Total As 37.2% 10% 67% 6.5% 31.7% 28.1% 65.7% 16.3% 46.2% 24.2% 58.9% 8.4%
Fig. 3. Total As concentration, inorganic As (i-As), and organic As (MMA+DMA, o-As) in grains of rice cultivars exposed at low (L) and high (H) As levels
the dominant form of As in roots independent of exposure level and rice cultivar. In roots exposed to low levels of As, between 0% and 27% of t-As was complexed by PCs. On the other hand, at high As exposure levels, this increased from 45 to 38%, depending on cultivar. The particular action of phy-tochelatins on As transport and storage explains this slight increase which is discussed in the next section.
GSH and its oxidized form GSSG were the dominant thiol-containing peptides in all analysis (Table 1). GSH concentra-tion was reduced at high As exposure in Kitrana 508, Dom Sofid, YRL-1, and Lemont. PCs were expressed by all plants. Dom Sofid produced the highest amount of PCs when com-pared with other cultivars.
Different As levels in soil did not have a significant influ-ence on PCs concentration in YRL-1 (high grain As accu-mulator and medium TFroot–grain) and Lemont (low grain As accumulator and low TFroot-gain) (Figs 1, 2), showing that PCs are important for some cultivars while other varieties seem to have different mechanisms for As detoxification.
Correlations between As–PCs complex, thiol
compounds, arsenic species, and translocation factors of arsenic
Total As levels in roots were positively correlated with some non-complexed PCs for all cultivars to low exposure (n=24 where DesGly–PC2: r=0.648, P <0.01; PC2oxi, r=0.535,
P <0.01; Glu–PC2, r=0.691, P <0.01, and PC3, r=0.514,
P <0.05). Considering high exposure situations, the
correla-tions were weaker (n=24 where DesGly–PC2, r=0.480, P <0.05; PC2oxi, r=0.365, P <0.05; Glu–PC2, r=0.273; P >0.05; and
PC3, r=0.364, P <0.05). By contrast, As–PC complexes and other thiol compounds did not correlate with t-As in roots.
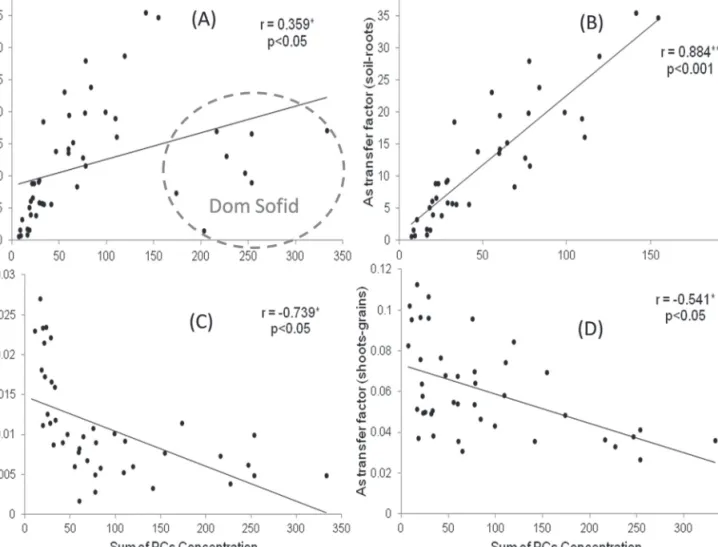
TFsoil–root were weakly correlated with the sum of non-complexed PCs (r=0.359, P <0.05), whereas TFroot–grain and TFshoot–grain showed strong negative correlations (r= –0.739 and –0.541, respectively, P <0.05). Significant positive cor-relations were observed between o-As (MMA and DMA) in grains and GSSG and non-complexed PCs in roots of high exposure samples (Table 2). Concentrations of i-As in grains versus PCs in roots (non-complexed and complexed) showed a negative correlation whereas i-As levels in grains were positively correlated with GSH in roots. Grain t-As correlated negatively with As–PC4 and As–Glu–PC3. GSH did not correlate with PCs. GSSG correlated significantly with low molecular weight PCs but otherwise only weakly with DMA and As–DesGly–PC3 (Table 2; for molecular weights see Supplementary Table S3 available at JXB online). Correlations were observed between TFroot–grain or TFroot–shoot and t-As in grains and some As–PCs (Table 2). Finally, a cor-relation was observed between TFroot–grain and the sum of PCs further correlations between all PCs (free PCs versus free PC and As–PCs; Table 2; Fig. 5).
Discussion
Total As in rice and agronomic parameters
According to the literature (Norton et al., 2012; Tripathi et al., 2012) different genotypes of rice cultivated under the same conditions exhibit different As uptake. Here, Italica Carolina and Lemont were the highest and the lowest grain As accumulators, respectively. The low grain t-As of Lemont Fig. 4. Determination by HPLC/HR-ICP-MS/LTQ Orbitrap ES-MS of PCs and PCs-As in roots of the Italica Carolina cultivar highly exposed to arsenate.
HR-ICP-MS, 32S (black line); 75As (red line). LTQ Orbitrap ES-MS: 1α, GSH; 2β, GSSG; 3α, OH-Me-PC
2; 4α, PC2 reduced; 5α, DesGly-PC2; 6α, PC2
auto-oxidized; 7–8α, Iso-PC
2-Glu; 9β, OH-Me-PC3-As; 10β, PC3; 11β, PC3-As; 12β, DesGly-PC3-As; 13β, Iso-PC3-Glu; 14β, Iso-PC3-Glu-As; 15–16β, PC4-As. a,
peaks of inorganic As and sulphate; j, l, m, o, p, q, peaks of PCs-As; a′′, b′′, c′′, d′′, As-complexes unidentified; b–q, peptides containing S or As and the
matches data reported by Norton et al. (2009a, b; 2012) where Lemont was identified as a low As cultivar in multiple field experiments. The cultivars which accumulated more As in roots were those that had a higher As uptake and, conse-quently, transported more As to aerial parts (Fig. 1). Finally, the t-As in roots of Lemont shows that the iron plaques (Chen et al., 2005) were effectively removed by applying the washing method, since no statistical difference was observed between low and high exposure levels (Fig. 1).
Arsenic had a strong negative influence on plant develop-ment as was clearly shown by the negative correlations with agronomic parameters and t-As (see Supplementary Tables S1 and S2 available at JXB online), confirming previous stud-ies (Carbonell-Barrachina et al., 1995,1998; Knauer et al., 1999; Zhang et al., 2002, Shri et al., 2009). Italica Carolina appeared to be the most sensitive to As and YRL-1 the least sensitive cultivar.
Thiol compounds and As–PC complexes in roots
Exposure to elevated As levels led to the increased forma-tion of As–PC complexes compared with that at low expo-sure (Table 1). Bluemlein et al. (2008) showed that the same proportion of As complexed to biothiols was determined in plant extracts using the low temperature extraction, fol-lowed by the online HPLC-ICPMS/ESI-MS detection, as
determined using direct speciation without sample prepara-tion using XANES/EXAFS. The low-temperature extracprepara-tion and the online separation/detection limit the de novo synthesis of As–PCs and their degradation during extraction and chro-matographic separation (Bluemlein et al., 2009). However, this was only shown for the plant Thunbergia alata and not for rice plants. This needs to be considered when the occur-rence of the As–PC complexes is discussed.
In this regard, all cultivars contained PCs at low As expo-sure, but only Dom Sofid and Kitrana 508 contained As bound to PCs under these conditions. Both cultivars con-tained, on average, the same amount of thiols in the form of GSH as in the form of PCs at low As exposure whereas, in other cultivars, the amount of thiols from GSH were higher than that present as PCs. Exposure to elevated As levels led to increased PCs’ production. All cultivars, except Dom Sofid and Kitrana 508, increased their total PCs concentrations by at least a factor of three (Dom Sofid and Kitrana 508 by about 2) upon exposure to elevated As levels.
Some PCs produced by rice in general increased in the cultivars during exposure to high As levels. These were, in most cases, bound up in the form of As–PCs complexes and were not present as free PCs. Only the amount of free PC2 and DesGly–PC2 increased in some instances with elevated As. Tripathi et al. (2012) also found that GSH and GSSG concentrations varied according to As concentration and the
Table 1. Concentration of GSH, GSSG, and As–PCs complexes found in fresh roots from six different rice cultivars
Results expressed as nmol PC kg–1 of fresh roots ±standard deviation; *statistical differences between low (L), n=4 and high (H), n=4 exposure
levels (P <0.05); ND, not detected; IC, Italica Carolina; DS, Dom Sofid; 9, 9524; K, Kitrana 508; Y, YRL-1; L, Lemont.
Cultivar [GSH] [GSSG] [OH–Me–PC2] [PC2Red] [DesGly–PC2] [PC2Oxi] [Iso–PC2–Glu]
IC(L) 109 ± 69* 10 ± 7.7 2 ± 0.2* 3 ± 0.7* 3 ± 0.6* 4 ± 1.0* 7 ± 1.5* IC(H) 1452 ± 201 6 ± 3.4 5 ± 1.2 6 ± 2.7 21 ± 9.3 9 ± 3.7 13 ± 4.0 DS(L) 2914 ± 1671 26 ± 9.3 44 ± 16.2 40 ± 21 33 ± 13* 27 ± 8.4* 58 ± 16.4 DS(H) 625 ± 573 32 ± 19.1 32 ± 6.3 42 ± 16 50 ± 12 42 ± 3.5 73 ± 24.4 9(L) 137 ± 52* 8 ± 6.7 4 ± 1.7 5 ± 1.9 5 ± 2.4 5 ± 2.2 3 ± 1.7* 9(H) 1254 ± 466 5 ± 2.5 4 ± 2.2 5 ± 2.2 8 ± 3.5 5 ± 2.1 10 ± 3.6 K(L) 944 ± 495* 8 ± 2.4 5 ± 1.6 6 ± 2.7 13 ± 2.8* 9 ± 3.1 16 ± 2.1* K(H) 174 ± 78 8 ± 2.9 6 ± 2.5 8 ± 0.9 23 ± 6.1 13 ± 5.1 24 ± 3.4 Y(L) 2296 ± 2198 5 ± 2.2 3 ± 0.7 3 ± 1.0 6 ± 3.9 5 ± 2.3 7 ± 4.8 Y(H) 733 ± 123 4 ± 0.9 3 ± 0.6 2 ± 0.9 5 ± 1.8 2 ± 0.4 5 ± 1.3 L(L) 1325 ± 1101 9 ± 6.0 4 ± 1.5 5 ± 1.4 7 ± 0.6 6 ± 1.1 13 ± 5.1 L(H) 355 ± 192 5 ± 1.2 6 ± 0.9 5 ± 1.1 7 ± 0.6 6 ± 1.5 9 ± 2.1
Cultivar [PC3] [As-PC3] [As-Iso-PC3-Glu] [As-DesGly-PC3] [As-PC4] [Iso-PC3-Glu] [As-OH-Me-PC3]
IC(L) 2 ± 0.8* ND ND ND ND 2 ± 0.5* ND IC(H) 5 ± 0.6 0.2 ± 0.1 0.2 ± 0.03 0.4 ± 0.3 1.4 ± 0.7 12 ± 5.0 0.2 ± 0.1 DS(L) 27 ± 16.7 3.7 ± 2.2 3.7 ± 2.3 3.8 ± 1.6* 12.1 ± 5.1* 27 ± 11.7* 2.4 ± 1.5 DS(H) 28 ± 4.5 5.3 ± 2.4 4.4 ± 3.4 16.0 ± 7.4 24.3 ± 8.4 74 ± 17.2 2.6 ± 1.0 9(L) 2 ± 0.6* ND ND ND ND ND ND 9(H) 4 ± 1.2 5.2 ± 1.9 ND 6.1 ± 3.5 26.0 ± 5.9 3 ± 1.6 6.2 ± 5.4 K(L) 8 ± 3.8 3.0 ± 1.4 ND 8.9 ± 3.5 18.0 ± 6.0 13 ± 6.0* 2.4 ± 2.3 K(H) 14 ± 12.3 4.9 ± 2.4 9.0 ± 5.4 17.4 ± 7.3 23.9 ± 11.0 46 ± 26.2 7.2 ± 10.4 Y(L) 1 ± 0.8 ND ND ND ND ND ND Y(H) 2 ± 0.5 1.5 ± 0.6 1.3 ± 0.1 3.7 ± 2.7 13.2 ± 6.4 3 ± 1.6 1.3 ± 0.1 L(L) 1 ± 0.5 ND ND ND ND ND ND L(H) 1 ± 0.6 2.8 ± 1.4 ND 5.2 ± 2.7 14.5 ± 6.3 ND 2.1 ± 0.6
Table 2.
Correlation between t-As, DMA, MMA, and i-As of grains and GSH, GSSG, and As–PCs of roots and transfer factors (TF) from high e
xposure ( n=24) Analytes SoP t-As DMA MMA i-As GSH GSSG OHMe PC 2 PC 2 DesGly PC2 PC 2 OXI Iso-PC 2 Glu OHMe-PC3As PC 3 PC 3 As Iso-PC 3 GluAs DesGly PC 3 As PC 4 As Iso-PC 3 Glu TFRS t-As 0.174 DMA 0.699** 0.643 ** MMA 0.713** 0.570 ** 0.858 ** i-As –0.057 0.726 ** 0.317 0.302 GSH 0.020 0.170 0.214 0.105 0.442 * GSSG 0.749** 0.041 0.417 * 0.403 –0.252 0.086 OHMe PC 2 0.731** –0.026 0.314 0.292 –0.262 0.257 0.761 ** PC 2 Red 0.809** 0.160 0.508 * 0.483 * –0.178 0.049 0.719 ** 0.712 ** DesGly 0.856** 0.139 0.569 ** 0.491 * –0.214 0.293 0.699 ** 0.718 ** 0.775 ** PC 2 PC 2 Oxi 0.800** 0.116 0.540 ** 0.486 * –0.317 0.008 0.797 ** 0.757 ** 0.902 ** 0.891 ** Iso-PC 2 0.812** 0.066 0.517 * 0.468 * –0.302 0.042 0.800 ** 0.691 ** 0.794 ** 0.902 ** 0.921 ** Glu OHMe 0.455* –0.288 0.210 0.224 –0.161 –0.152 0.275 0.240 0.253 0.114 0.170 0.292 PC 3 As PC 3 0.821** 0.280 0.625 ** 0.585 ** 0.050 0.238 0.634 ** 0.536 ** 0.799 ** 0.743 ** 0.781 ** 0.733 ** 0.146 PC 3 As 0.555** –0.322 0.238 0.296 –0.184 –0.083 0.405 0.294 0.345 0.220 0.246 0.378 0.928 ** 0.332 Iso-PC 3 0.643** –0.425* 0.130 0.386 –0.392 –0.162 0.416 0.289 0.310 0.139 0.289 0.440 0.776 ** 0.153 0.756 ** GluAs DesGly 0.668** –0.185 0.283 0.458 * –0.241 –0.221 0.500 * 0.321 0.432 * 0.418 * 0.419 * 0.504 * 0.763 ** 0.326 0.791 ** 0.741 ** PC 3 As PC 4 As 0.575** –0.485 * 0.111 0.225 –0.244 –0.210 0.292 0.155 0.284 0.168 0.229 0.321 0.853 ** 0.311 0.910 ** 0.756 ** 0.833 ** Iso-PC 3 0.767** 0.091 0.363 0.483 * –0.419 0.103 0.777 ** 0.853 ** 0.743 ** 0.814 ** 0.819 ** 0.782 ** 0.118 0.824 ** 0.238 0.319 0.329 0.052 Glu TFRS –0.297 0.244 –0.177 –0.086 0.186 –0.326 –0.027 0.052 –0.097 –0.222 –0.018 –0.043 –0.268 –0.015 –0.277 –0.301 –0.178 –0.159 0.262 TFRG 0.547** 0.468 * –0.053 –0.079 0.444 *–0.184 –0.241 –0.221 –0.324 –0.410 * –0.277 –0.296 –0.402 –0.204 –0.440 * –0.445* –0.451 * –0.384 –0.118 0.842 ** t-As, T
otal arsenic; DMA,: dimethyl-arsenic; MMA, monomethyl-arsenic; i-As, inorganic arsenic; SoP
, sum of PCs concentrations; TF , transfer factor; TFRS, TF r oots–shoots; TFRG, TF roots–grains; * P <0.05; ** P <0.01.
cultivar (genotype) studied, especially in susceptible ones. The authors found that susceptible rice cultivar IET-4786 showed more pronounced oxidative stress compared with tolerant Triguna. They attributed this tolerance to the activ-ity of enzymes such as serine acetyl transferase, cysteine syn-thase, γ-glutamyl cysteine synthase, arsenate reductase, PC synthase, and others.
As reported by Tripathi et al. (2012) As translocation depends on the cultivar sensitivity and the synthesis of PCs, which is non-dose-dependent. The authors stated that the synthesis of PCs increase with AsV concentration. However, above a certain concentration of As, there is a reduction in the synthesis of PCs. As previously observed, the present study indicated that a specific cultivar with different As TFs showed singular sensitivity to As. However, the total concen-tration of PCs did not give an indication of TFs.
Inorganic and methylated As in grains
Total As levels in grains were dose- and cultivar-dependent (Figs 3, 5). Despite the fact that the soil originally contained predominantly i-As and was spiked with i-As, high amounts of methylated As-species were found in grains. This was most
likely the result of soil bacteria, especially As-methylating ones, thriving under flooded culture conditions. It has been shown (Raab et al., 2007b) that methylated As (especially DMA) is better translocated to aerial parts of rice than i-As, potentially due to (i) a lower ability to bind to PCs and be sequestered into root vacuoles and (ii) efficient transporters as shown by Li et al. (2009). The increased As levels in grains of most cultivars, except Lemont and YRL-1, at elevated As levels resulted from increased amounts of DMA and not of i-As.
Arsenic translocation in rice cultivars
The transfer factor (TF) is defined as the long-range trans-port of a specific compound from one part into another under specific condition of cultivation (Carbonell et al., 1998; Raab et al., 2007b). TFs vary considerably between plant species and within cultivars of a single species (Zhao et al., 2010). The most important TF of rice with regard to human nutrition is the TFsoil–grain (Fig. 2D). In these experiments it varied between 0.05 and 0.22 with Italica Carolina having the highest TFsoil–grain at low exposure. TFsoil–shoot values (Fig. 2F) found here for rice were similar to those found by Williams Fig. 5. Scatter plots of PCs (sum of PCs concentration, SoP, free PCs+PCs As) on As transfer factor (TF) in all the cultivars studied: A (n=48), TFsoil–root
versus SoP; B (n=40), TFsoil–root versus SoP with Dom Sofid removed; C (n=42), TFroots–grain versus SoP (all cultivars); and D (n=42), TFshoot–grain versus SoP
et al. (2007), being about 50 times higher than reported for wheat and barley. Comparison of the different exposure lev-els showed that TFsoil–root increased with the amount of As present in soil for all cultivars, but Lemont (Fig. 2A). By contrast, TFroots–shoot decreased in all cultivars with increasing soil As content, except Lemont. Similarly, all other TFs (soil– grain, root–grain, and soil–shoot) either remained constant or decreased with elevated As levels in soil.
Considerable differences in TF factors were identified between cultivars. Kitrana 508 showed the highest As trans-ference from soil to roots, but TF into shoots and grains was lower than for YRL-1 and Lemont. The mean roots to shoots/grains and shoots to grains TFs to low exposure level for YRL-1 (Fig. 2B, C, E) were higher than the TFs for the other cultivars, showing a predilection for As transfer from roots to shoots and roots to grains. However, TFshoot–grain does not seem to be a good parameter to evaluate since no statisti-cal differences were observed between low and high exposure samples (Fig. 2C).
Role of thiol compounds and As–PCs on As transfer into grains
To understand the correlations between PCs it is necessary to study the biosynthesis of those compounds. Initially, the enzyme γ-glutamylcysteine synthetase (GCS) produces γ-GluCys and glutathione synthetase (GS) completes the synthesis of GSH by adding Gly to the structure, producing γ-GluCysGly (Fig. 6). GSH, by negative feedback, controls the GCS activity (Cobbett, 2000; Cobbett and Goldsbrough, 2002). The synthesis of peptides (γ-GluCys)nGly in plants is stimulated by toxic elements (such as As and Cd) being cata-lysed by the constitutive enzyme PC synthase (PCS), which transfers the glutamyl-cysteine fraction (γ-GluCys) from GSH to an acceptor molecule, GSH or peptide (γ-GluCys)nGly, producing (γ-GluCys)n+1Gly, the PCs (Fig. 6). In this step the highest producer is Dom Sofid, followed by Kitrana 508 and Italica Carolina and, interestingly, the lowest are YRL-1 and 9524, cultivars that showed increased i-As in grains to high exposure level (Fig. 3; Table 1). PCs with no Gly at the
Fig. 6. Probable pathways of phytochelatins (PCs) biosynthesis in roots of rice: data from literature, correlation between the PCs found here and the PCs
related to the cultivars studied. Cultivars: L, Lemont; DS, Dom Sofid; IC, Italica Carolina; Y, YRL-1; 9, 9524; K, Kitrana 508. LMW, low molecular weight; HMW, high molecular weight; PCS, PC synthase; GCS, γ-glutamylcysteine synthetase; GS, glutathione synthetase; hPCS, homo-PC synthases; 1, As
uptake by roots; 2, production of LMW PCs; 3, As–PCs complexes (AsIII+2PC
2, AsIII+PC3, for example) stored in the vacuole; 4, transport to vacuoles;
5, release of PCs; 6, efflux of As up-taken; ?, unknown information; >, high concentration; <, low concentration; thicker dotted line, PC highly effective.
Scheme elaborated according to descriptions from Klapheck et al. (1994); Cobbett (2000); Chassaigne et al. (2001); Cobbett and Goldsbrough (2002);
C-terminus are named DesGly–PC. DesGly–PC3 was found here at high concentrations in Dom Sofid and Kitrana 508 (Fig. 6; Table 1). Different families and orders of plants may have PCs with different amino acids. For example, the order Fabales (monocotyledonous) produces (γ-GluCys)nAla when exposed to Cd. The family Poaceae (grasses such as wheat, rice) can produce several iso-PCs such as (γ-GluCys)nGlu, (γ-GluCys)nGly, (γ-GluCys)nSer (also named hydroxymethyl-PC), and (γ-GluCys)n (Klapheck et al., 1994; Cobbett and Goldsbrough, 2002; Vatamaniuk et al., 2004). These PCs are the product of homo-PC synthases, which can use γ-GluCys units as substrate from GSH, hGSH (γ-GluCys-β-Ala), PCs, and DesGly–PCs (Oven et al., 2002), all found in the present study. Ser–PCs and Glu–PCs were more prevalent in Dom Sofid, Italica Carolina, and Kitrana 508, cultivars that did not show statistical difference for i-As in grains to low and high exposure levels (Fig. 3).
Figure 6 shows the biosynthesis pathways described in the literature and the relation with the data found in this study. Lemont probably has a special mechanism where small amounts of As are transported into the roots (step 1) or has a high As efflux (step 6). That would explain the low biosynthe-sis of PCs in Lemont, similar to YRL-1 and 9524 (low con-centration of PCs and high i-As in grains) (Table 1). On the one hand, these last two cultivars presented low concentra-tions of DesGly–PC2, Iso–PC2–Glu, PC2oxi, PC3, and Iso– PC3–Glu (Table 1). In particular, DesGly–PC2 did not change its levels in these cultivars after high exposure (Table 1). On the other hand, Kitrana 508, Dom Sofid, and Italica Carolina substantially increased their levels of DesGly–PC2 (Table 1). This culminated in the high production of other PCs (Iso– PC3–Glu and Iso–PC2–Glu).
Regarding the reduction of 1.6 times in the concentration of grains i-As in Italica Carolina from low to high exposure levels (Fig. 3), we observed that Iso–PC3–Glu was highly expressed after exposure (Table 1), even in Kitrana 508 and Dom Sofid, comprising all the low i-As grain accumula-tors. Furthermore, Italica Carolina presented low levels of As–Iso–PC3–Glu, showing the importance of steps 4 and 5 (Fig. 6). Regarding step 4, Song et al. (2010) described that two ABCC-type vacuolar PC-transporters (AtABCC1 and AtABCC2) have an important role on As tolerance in
Arabidopsis since they were associated with vacuolar As
accu-mulation (As–PC2) and, interestingly, to PC biosynthesis. In this regard, Ueno et al. (2010) reported a gene (OsHMA3), responsible for low Cd accumulation in rice which encodes a P1B-type ATPase family transporter, sequestrating Cd into the root vacuoles. Further, step 5 is associated with the release of PC in the vacuole and return to the cytoplasm. This recy-cling probably has an important influence on the transloca-tion, i.e. trapping of i-As in the roots, than the production or PCs’ levels itself. This is evidenced by comparing the levels of Kitrana 508’s PCs and Dom Sofid (Table 1).
The correlation between TFsoil–root and the sum of PCs con-centration showed a weak positive statistical significance. As seen in Fig. 4A, Dom Sofid showed a very different relation-ship between TFsoil–root compared to other cultivars because it produced significantly more PCs than the other cultivars
(Table 1). Removing Dom Sofid, the correlation becomes very strong (Fig. 4B). Total As in roots was positively cor-related with the sum of PCs in all cultivars, but As transfer from roots and/or shoots to grains was significantly reduced by increased PCs’ production (Fig. 4C, D). This shows that PCs provide an important mechanism to decrease the concen-tration of i-As in grains and suggests that PC bound As was less likely to be transported into shoots and grains. Similar observations were made by Liu et al. (2010) in Arabidopsis
thaliana. By contrast with the negative correlation between
i-As in grains and PCs in roots, the GSH concentration was positively correlated with the amount of i-As in grains. GSH participates not only in production of PCs (Cobbett and Goldsbrough, 2002) and in antioxidant defence mechanisms, but also in the conversion of AsV in AsIII (Raab et al., 2004; Bleeker et al., 2006; Duan et al., 2011), which might be the reasons for the positive correlation.
No correlation was found between GSH and any of the individual PCs quantified, but individual PCs concentrations were correlated with the amount of GSSG. Strong correla-tions existed between individual PCs especially within a fam-ily, supporting the fact that chain elongation is taking place (Fig. 6; Table 2). The correlations between the sum of PCs and individual PC concentrations were stronger for free PCs than for those bound to As. The correlations between DesGly–PC2 and other PCs may indicate that, similar to microorganisms and yeast (Klapheck et al., 1994; Cobbett and Goldsbrough, 2002; Zhao et al., 2010), rice roots cells can also polymer-ize γ-GluCys directly with or without the addition of Gly or other amino acids. The cultivars showed individual differ-ences not only in PC production but, potentially more impor-tantly, in the different PC-families produced in response to As. Italica Carolina responded to high As exposure especially with increases of PC2oxi and PC3 besides DesGly–PC2. This PC was also strongly elevated by As in cultivars 9524 and Kitrana 508. Both of these cultivars also increase the amount of Glu–PC2 while 9524 had lower Glu–PC3 than other cul-tivars. In these cultivars the PCs were not only positively correlated with the As concentration in roots but also with reduced i-As transfer to grains. YRL-1 did not produce many different PCs and was generally less sensitive to As compared with Italica Carolina. Lemont, despite its low total As uptake into the roots (independent of exposure), produced PCs in response to As which appear to reduce As transfer to grains even further.
Some cultivars, especially those which produced significant amounts of PCs upon exposure to elevate i-As, might also respond to exposure to other soil contaminants such as Cd, which stimulates PC synthesis. Hence, a co-exposure of As and Cd will probably influence the TFs of i-As. This might explain the site to site variation of As accumulation in rice grains observed by Norton et al. (2009a, b, 2012). Those authors found that Lemont, as well as CT9993-5-10-1-M, Azucena, and Teqing cultivars, was the lowest in grain As con-centration, with potential use on breeding seeds. In six differ-ent fields in Bangladesh, China, and India, Lemont was one of the lowest As grain accumulator. This cannot be explained by the high amount of PCs or thiols production, but must
be the result of another mechanism. The agreement between that study and this suggests Lemont is indeed a promising cultivar for breeding low grain As, and the results here sug-gest that its low TFsoil–shoot is the main reason for a low grain i-As. Exactly why its TFsoil–shoot is low is still not clear.
Conclusion
In general, t-As in grains reflected the concentration in roots. Cultivars with higher As uptake (all species) from soil trans-locate As more efficiently to the grains. Elevated As concen-trations in roots, shoots, and grains negatively affected plant development and, consequently, grain yield, especially in cul-tivar Italica Carolina.
Cultivars with higher As-uptake into roots, such as Dom Sofid and Italica Carolina, produced higher concentrations of PCs than other cultivars. All rice cultivars produced a range of different PCs belonging to the Des–Gly–PCn, PCn, Ser–PCn, and Glu–PCn families with n varying from 2 to 4. Correlations between different PCs proved that chain elon-gation by one γ-Glu-Cys unit is used by rice for the produc-tion of PCs.
With the exception of cultivar Lemont, t-As in grains increased with increasing As exposure. Speciation of As in grains revealed that elevated As exposure resulted in increased concentration of DMA and also MMA in grains. PCs’ production and the formation of As–PC complexes in roots reduced the transfer of i-As into shoots and grains, but had no influence on DMA and MMA transfer.
Transfer factors for As from the soil/root to grains were lower when the plants were exposed to elevated As levels due to the stimulation of more extensive production of PCs and, consequently, reduced As transport to aerial parts of the plant. Results also showed that the uptake of methylated As species is different between cultivars, probably due to soil microbial methylation of As and As efflux from roots.
This study showed clearly that As-uptake and transfer into grains strongly depends on rice cultivar and bioavailability of As in soil. Some cultivars like Dom Sofid, Kitrana 508, and Italica Carolina are better able to mobilize As from soil than others, but efficiently trap the most toxic form, AsIII, in the roots. Knowing the characteristics of each genotype (cul-tivar) and concentration (availability) of arsenic in soil, dif-ferent cultivars can be used to prevent or reduce the arsenic contamination of grains and, consequently, the toxicologi-cal/nutritional risk, especially of i-As. Finally, this research suggests that modifications of PCs in plant roots will have implications on grain As levels and more research is need to investigate if this can be exploited in crop improvement tar-geting the reduction of As exposure risk.
Supplementary data
Supplementary data can be found at JXB online.
Supplementary Table S1. Description of agronomic parameters.
Supplementary Table S2. Correlations between agronomic parameters and t-As (n=48, low and high exposure levels).
Supplementary Table S3. Theoretical, experimental, and accurate masses (Δm), retention time (RT), and molecular formula of GSH, free PCs, and PCs-As identified and quan-tified in the present study.
Acknowledgements
The authors kindly thank the Fundação de Amparo à Pesquisa do Estado de São Paulo (FAPESP 2010/07566-1) and the Biotechnology and Biological Sciences Research Council (BBSRC) for funding the Element 2 to complete the speciation suite.
References
Amayo KO, Petursdottir A, Newcomb C, Gunnlaugsdottir H, Raab A, Krupp EM, Feldmann J. 2011. Identification and quantification of
arsenolipids using reversed-phase HPLC coupled simultaneously to high-resolution ICP-MS and high-high-resolution electrospray-MS without
species-specific standards. Analytical Chemistry 83, 3589–3595.
ATSDR (Agency for Toxic Substances and Disease Registry). 2007. Toxicological profile for arsenic. Agency for Toxic Substances and Disease
Registry, Public Health Service, Atlanta.
Batista BL, Souza JMO, Souza SS, Barbosa J. 2011. Speciation of
arsenic in rice and estimation of daily intake of different arsenic species by
Brazilians through rice consumption. Journal of Hazardous Materials 191,
342–348.
Bleeker PM, Hakvoort HWJ, Bliek M, Souer E, Schat H. 2006.
Enhanced arsenate reduction by a CDC25-like tyrosine phosphatase explains increased phytochelatin accumulation in arsenate-tolerant Holcus
lanatus. The Plant Journal 45, 917–929.
Bluemlein K, Raab A, Feldmann J. 2009. Stability of arsenic peptides in
plant extracts: off-line versus on-line parallel elemental and molecular mass spectrometric detection for liquid chromatographic separation. Analytical
and Bioanalytical Chemistry 393, 357–366.
Bluemlein K, Raab A, Meharg AA, Charnock JM, Feldmann J. 2008.
Can we trust mass spectrometry for determination of arsenic peptides in plants: comparison of LC-ICP-MS and LC-ES-MS/ICP-MS with XANES/ EXAFS in analysis of Thunbergia alata. Analytical and Bioanalytical
Chemistry 390, 1739–1751.
Cao XD, Ma LQ. 2004. Effects of compost and phosphate on
plant arsenic accumulation from soils near pressure-treated wood.
Environmental Pollution 132, 435–442.
Carbonell AA, Aarabi MA, DeLaune RD, Gambrell RP, Patrick WH.
1998. Arsenic in wetland vegetation: availability, phytotoxicity, uptake and effects on plant growth and nutrition. Science of the Total Environment
217, 189–199.
Carbonell-Barrachina AA, Aarabi MA, DeLaune RD, Gambrell RP, Patrick WH. 1998. The influence of arsenic chemical form and
concentration on Spartina patens and Spartina alterniflora growth and
tissue arsenic concentration. Plant and Soil 198, 33–43.
Carbonell-Barrachina AA, Carbonell FB, Beneyto JM. 1995. Arsenic
uptake, distribution, and accumulation in tomato plants: effect of arsenite
on plant growth and yield. Journal of Plant Nutrition 18, 1237–1250.
Chassaigne H, Vacchina V, Kutchana TM, Zenk MH. 2001.
Identification of phytochelatin-related peptides in maize seedlings exposed
to cadmium and obtained enzymatically in vitro. Phytochemistry 56,
657–668.
Chen Z, Zhu Y-G, Liu W-J, Meharg, AA. 2005. Direct evidence showing
the effect of root surface iron plaque on arsenite and arsenate uptake into
rice (Oryza sativa) roots. New Phytologist 165, 91–97.
Cobbett C, Goldsbrough P. 2002. Phytochelatins and metallothioneins:
roles in heavy metal detoxification and homeostasis. Annual Review of
Plant Biology 53, 159–182.
Cobbett CS. 2000. Phytochelatins and their roles in heavy metal
detoxification. Plant Physiology 123, 825–833.
Duan GL, Hu Y, Liu WJ, Kneer R, Zhao FJ, Zhu YG. 2011. Evidence
for a role of phytochelatins in regulating arsenic accumulation in rice grain.
Hansen HR, Raab A, Price AH, Duan G, Zhu Y, Norton GJ, Feldmann J, Meharg AA. 2010. Identification of tetramethylarsonium in rice grains
with elevated arsenic content. Journal of Environmental Monitoring 13,
32–34.
Klapheck S, Fliegner W, Zimmer I. 1994. Hydroxymethyl-phytochelatins
[(gamma-glutamylcysteine)n-serine] are metal-induced peptides of the
Poaceae. Plant Physiology 104, 1325–1332.
Knauer K, Behra R, Hemond H. 1999. Toxicity of inorganic and
methylated arsenic to algal communities from lakes along an arsenic
contamination gradient. Aquatic Toxicology 46, 221–230.
Li RY, Ago Y, Liu WJ, Mitani N, Feldmann J, McGrath SP, Ma JF, Zhao FJ. 2009. The rice aquaporin Lsi1 mediates uptake of methylated
arsenic species. Plant Physiology 150, 2071–2080.
Liu WJ, Wood BA, Raab A, McGrath SP, Zhao FJ, Feldmann J. 2010.
Complexation of arsenite with phytochelatins reduces arsenite efflux and
translocation from roots to shoots in Arabidopsis. Plant Physiology 152,
2211–2221.
Lu Y, Adomako EE, Solaiman ARM, Islam MR, Deacon C, Williams PN, Rahman GKM, Meharg AA. 2009. Baseline soil variation is a major
factor in arsenic accumulation in Bengal Delta paddy rice. Environmental
Science and Technology 43, 1724–1729.
Ma JF, Tamai K, Yamaji N, Mitani N, Konishi S, Katsuhara M, Ishiguro M, Murata Y, Yano M. 2006. A silicon transporter in rice. Nature 440, 688–691.
Meharg AA, Hartley-Whitaker J. 2002. Arsenic uptake and metabolism
in arsenic resistant and nonresistant plant species. New Phytologist 154,
29–43.
Meharg AA, MacNair MR. 1992. Suppression of the high affinity
phosphate uptake system: a mechanism of arsenate tolerance in Holcus
lanatus L. Journal of Experimental Botany 43, 519–524.
Meharg AA, Naylor J, Macnair MR. 1994. Phosphorus nutrition of
arsenate-tolerant and nontolerant phenotypes of velvetgrass. Journal of
Environmental Quality 23, 234–238.
Meharg AA, Williams PN, Adomako E, et al. 2009. Geographical
variation in total and inorganic As content of polished (white) rice.
Environmental Science and Technology 43, 1612–1617.
Norton GJ, Duan G, Dasgupta T, et al. 2009a. Environmental and
genetic control of arsenic accumulation and speciation in rice grain: comparing a range of common cultivars grown in contaminated sites across Bangladesh, China and India. Environmental Science and
Technology 43, 8381–8386.
Norton GJ, Islam MR, Deacon C, et al. 2009b. Identification of
low inorganic and total grain arsenic rice cultivars from Bangladesh.
Environmental Science and Technology 43, 6070–6075.
Norton GJ, Pinson SRM, Alexander J, et al. 2012. Variation in grain
arsenic assessed in a diverse panel of rice (Oryza sativa) grown in multiple
sites. New Phytologist 193, 650–664.
Oven M, Page JE, Zenk MH, Kutchan TM. 2002. Molecular
characterization of the homo-phytochelatin synthase of soybean Glycine
max. Journal of Biological Chemistry 15, 4747–4754.
Raab A, Feldmann J, Meharg AA. 2004. The nature of arsenic–
phytochelatin complexes in Holcus lanatus and Pteris cretica. Plant
Physiology 134, 1113–1122.
Raab A, Ferreira K, Meharg AA, Feldmann J. 2007a. Can arsenic–
phytochelatin complex formation be used as an indicator for toxicity in
Helianthus annuus? Journal of Experimental Botany 58, 1333–1338.
Raab A, Schat H, Meharg AA, Feldmann J. 2005. Uptake,
translocation and transformation of arsenate and arsenite in sunflower (Helianthus annuus): formation of arsenic–phytochelatin complexes during
exposure to high arsenic concentrations. New Phytologist 168, 551–558.
Raab A, Williams PN, Meharg A, Feldmann J. 2007b. Uptake and
translocation of inorganic and methylated arsenic species by plants.
Environmental Chemistry 4, 197–203.
Rey NA, Howarth OW, Pereira-Maia EC. 2004. Equilibrium
characterization of the As(III)–cysteine and the As(III)–glutathione systems
in aqueous solution. Journal of Inorganic Biochemistry 98, 1151–1159.
Saha GC, Ali MA. 2007. Dynamics of arsenic in agricultural soils irrigated
with arsenic contaminated groundwater in Bangladesh. The Science of the
Total Environment 379, 180–189.
Schoof RA, Yost LJ, Eickhoff J, Crecelius EA, Cragin DW, Meacher DM, Menzel DB. 1999. A market basket survey of inorganic arsenic in
food. Food and Chemical Toxicology 37, 839–846.
Shri M, Kumar S, Chakrabarty D, et al. 2009. Effect of arsenic on
growth, oxidative stress, and antioxidant system in rice seedlings.
Ecotoxicology and Environmental Safety 72, 1102–1110.
Song WY, Park J, Mendoza-Cózatl DG, et al. 2010. Arsenic
tolerance in Arabidopsis is mediated by two ABCC-type phytochelatin transporters. Proceedings of the National Academy of Sciences , USA
107, 21187–21192.
Sun GX, Williams PN, Zhu YG, Deacon C, Claire AM, Raab A, Feldmann J, Meharg AA. 2009. Survey of arsenic and its speciation in
rice products such as breakfast cereals, rice crackers and Japanese rice
condiments. Environment International 35, 473–475.
Tripathi P, Mishra A, Dwivedi S, Chakrabarty D, Trivedi PK, Singh RP, Tripathi RD. 2012. Differential response of oxidative stress and
thiol metabolism in contrasting rice genotypes for arsenic tolerance.
Ecotoxicology and Environmental Safety 79, 189–198.
Tu S, Ma LQ. 2003. Interactive effects of pH, arsenic and phosphorous
on uptake of As and P and growth of the arsenic hyperaccumulator Pteris
vittata L. under hydroponic conditions. Environmental and Experimental
Botany 50, 241–251.
Ueno D, Yamaji N, Kono I, Huang CF, Ando T, Yano M, Ma JF. 2010.
Gene limiting cadmium accumulation in rice. Proceedings of the National
Academy of Sciences, USA 107, 16500–16505.
Vatamaniuk OK, Mari S, Lang A, Chalasani S, Demkiv LO, Rea PA.
2004. Phytochelatin synthase, a dipeptidyltransferase that undergoes multisite acylation with gamma-glutamylcysteine during catalysis. Journal
of Biological Chemistry 279, 22449–22460.
Williams PN, Price AH, Raab A, Hossain SA, Feldmann J, Meharg AA. 2005. Variation in arsenic speciation and concentration in paddy rice
related to dietary exposure. Environmental Science and Technology 39,
5531–5540.
Williams PN, Villada A, Deacon C, Raab A, Figuerola J, Green AJ, Feldmann J, Meharg AA. 2007. Greatly enhanced As shoot assimilation
in rice leads to elevated grain levels compared to wheat and barley.
Environmental Science and Technology 41, 6854–6859.
Wood BA, Feldmann J. 2012. Quantification of phytochelatins and
their metal(loid) complexes: critical assessment of current analytical
methodology. Analytical and Bioanalytical Chemistry 402, 3299–3309.
Xu XY, McGrath SP, Meharg AA, Zhao FJ. 2008. Growing rice
aerobically markedly decreases arsenic accumulation. Environmental
Science and Technology 42, 5574–5579.
Yoshida S, Douglas AF, James HC, Kwanchai AC. 1976. Laboratory manual for physiological studies of rice , 3rd edn. IRRI Press, 61–66. Zhang F, Shi W, Jin Z, Shen Z. 2002. Response of antioxidative
enzymes in cucumber chloroplasts to cadmium toxicity. Journal of Plant
Nutrition 26, 1779–1788.
Zhang J, Zhao QZ, Duan GL, Huang YC. 2010. Influence of sulphur on
arsenic accumulation and metabolism in rice seedlings. Environmental and
Experimental Botany 72, 34–40.
Zhao FJ, McGrath SP, Meharg AA. 2010. Arsenic as a food chain
contaminant: mechanisms of plant uptake and metabolism and mitigation
strategies. Annual Review of Plant Biology 61, 535–559.
Zhao K, Tung CW, Eizenga G, et al. 2011. Genome-wide association
mapping reveals a rich genetic architecture of complex traits in Oryza