Biomedical Applications of Nanostructured Polymer Films by
ARC&WES
Jonathan Brian Gilbert MASSACHURi8OF TECHNOLOGY M.S. Chemical Engineering Practice
Massachusetts Institute of Technology
JUN 3
0
2014
B.S. Chemical Engineering
L
I
B RARI EE
Johns Hopkins University
SUBMITTED TO THE DEPARTMENT OF CHEMICAL ENGINEERING IN PARTIAL FULFILLMENT OF THE REQUIREMENTS FOR THE DEGREE OF
DOCTOR OF PHILOSOPHY IN CHEMICAL ENGINEERING at the
MASSACHUSETTS INSTITUTE OF TECHNOLOGY
June 2014
©2014 Massachusetts Institute of Technology. All rights reserved.
Signature redacted,
Certified by:... St.
Certified by: ...
S ignature
...
ment of Chemical Engineering -/7 May 5, 2014
Signature redacted
Robert E. Cohen Laurent Professor of Chemical Engineering Thesis Co-Supervisorredacted
...
Michael F. Rubner TDK Professor of Materials Science and Engineering Thesis Co-Supervisor
Signature redacted
Accepted by: ... ...
Patrick Doyle Professor of Chemical Engineering Chairman, Committee for Graduate Students IE
Biomedical Applications of Nanostructured Polymer Films
by
Jonathan Brian Gilbert
Submitted to the Department of Chemical Engineering on May 5th, 2014 in partial fulfillment of
the requirements for the degree of Doctor of Philosophy in Chemical Engineering ABSTRACT
Functional polymeric thin films are often stratified with nanometer level structure and distinct purposes for each layer. These nanostructured polymeric materials are useful in a wide variety of applications including drug delivery, tissue engineering, controlling condensation and polymeric batteries; all of which will be discussed in this work.
The first area of my thesis will detail the use of C60 cluster-ion depth profiling X-ray Photoelectron Spectroscopy (XPS) to fundamentally understand how thin film structure and function relate. This method has the unique capability to determine the atomic composition and chemical state of polymeric thin films with <10nm nanometer depth resolution without any chemical labeling or modification. Using this technique, I probed the nanostructure of functional thin films to quantify the interlayer diffusion of the biopolymer chitosan as well as demonstrate methods to stop this diffusion. I also explored the role of interlayer diffusion in the design of hydrophobic yet antifogging 'zwitter-wettable' surfaces. Additionally, I probed the lithium triflate salt distribution in solid block copolymer battery electrolytes (PS-b-POEM) to understand the lithium-ion distribution within the POEM block.
In the second area of my thesis, I show how the nanostructure of materials control the function of polymeric particles in vitro and in vivo. One example is a 'Cellular Backpack' which is a flat, anisotropic, stratified polymeric particle that is hundreds of nanometers thick and microns wide. In partnership with the Mitragotri group at UCSB, we show that cellular backpacks are phagocytosis resistant, and when attached to a cell, the cell maintains native functions. These capabilities uniquely position backpacks for cell-mediated therapeutic delivery and we show in vivo that immune cells attached to backpacks maintain their ability to home to sites of inflammation. In addition, we have designed polymeric microtubes that can control their orientation on the surface of living cells. Inspired by chemically non-uniform Janus particles, we designed tube-shaped, chemically non-uniform microparticles with cell-adhesive ligands on the ends of the tubes and a cell-resistant surface on the sides. Our results show that by altering the surface chemistry on the end versus the side, we can control the orientation of tubes on living cells. This advance opens the capability to control phagocytosis and design cellular materials from the bottom up.
Thesis Supervisors: Robert E. Cohen and Michael F. Rubner
Respective Titles: St. Laurent Professor of Chemical Engineering and TDK Professor of Materials Science and Engineering
Acknowledgements
Many people have contributed to my education and to the work presented in this thesis. Professor Rubner and Professor Cohen have been essential in developing my capabilities as a scientist and I thank them immensely for their time and effort. Their unique contributions to my research have always pushed me to ask fundamental questions so my research can have the largest impact possible. My thesis committee members, Professor Irvine and Professor Hammond, also served as valuable resources in my research. I am particularly grateful for Professor Irvine's generosity with his resources as I have enjoyed the benefits of his tissue culture space and excellent microscopes. I also have appreciated the help and support of his friendly group members. I am also grateful to Professor Hammond who provided constant positive support and input.
Many students in the Rubner and Cohen groups have also given essential scientific and personal advice. I am particularly indebted to Albert Swiston, who pioneered the cell backpack work and was instrumental in developing applications. His leadership and advice in the lab as I started my research career was very helpful. I also would like to thank Hyomin Lee and Siddarth Srinivasan who also entered the Cohen lab in January 2010 and have been friends and excellent collaborators. It has been a joy growing as scientists with them and I am excited to see what their careers will hold. Other past members of the lab including Gary Chia, Jonathan DeRocher and Shree Chhatre have been essential in my growth. I also would like to acknowledge my other current labmates, Rosanna Lim and Justin Kleingartner, for their input and support. I am especially thankful for Rosanna and her constant positive attitude. It has been a pleasure working with her to further develop the backpacks.
During my thesis research, I have also have enjoyed working with wonderful collaborators across the US and the world. Aaron Anselmo, Nishit Doshi and Professor Mitragotri of UCSB have been very helpful as we have pushed toward the in vivo application of cell backpacks. I am also very thankful for Ming Luo and Professor Epps at the University of Delaware as we have worked towards the depth profiling analysis of block copolymer thin films. Grinia Nogueira, Mariana de Moraes and Roberta Polak also have shaped my graduate career and I am appreciative of Mariana and Roberta's hospitality in my short research trip to UNICAMP in Campinas, Brazil. Maria Ochoa, Janice O'Brien and Harini Suresh's work as UROPs also added essential parts to my thesis. I also thank Girma Endale for his work in immune cell bilayers. I would also like to acknowledge the help of the CMSE staff Libby Shaw and Tim McClure. Libby's help and support was essential in developing the best procedures for depth profiling XPS of polymeric thin films.
Furthermore, the constant support of my friends and family has been essential. In particular, I would like to thank Tim Palmer for his constant support and advice in my research and my personal life. Mitch Wang was also an invaluable ally in the first year of classes, and was always willing to help refine an idea or a presentation throughout graduate school. Other classmates and housemates including Jonathan Harding, David Borelli, Katie Quinn, Kamil Khan, Shamel Merchant, Matt Glassman and many others provided a wonderful social network of friends. I would also like to thank the network of friends at Hope Fellowship Church for their constant support and accountability in my faith. My family's support and love has been non-stop and I
cannot thank them enough. Most importantly, I would like to thank my wonderful, beautiful, and intelligent wife Stephanie for her constant support and love. She has listened to my worries and troubles and has always supported me in love. I could not have done this without her.
Table of Contents
1. List of Figures ... 7
2. List of Tables ... 18
3. Introduction and Background ... 19
3.1 Introduction ... 19
3.2 N anostructured Thin Film s ... 19
3.2.1 Fundam ental Studies of Nanostructured Film s... 21
3.2.2 Biom edical Applications of N anostructured Film s... 23
4. Depth Profiling XPS Analysis of Interlayer Diffusion in Polyelectrolyte Multilayers ... 25
4.1 Introduction... 25
4.2 Experim ental Set-up ... 29
4.3 Diffusion of Chitosan in Hydrogen Bonded M ultilayers ... 30
4.4 D isplacem ent of PEO from Film by Chitosan ... 34
4.5 Electrostatic Blocking Layer Stops Chitosan Diffusion ... 36
4.6 pH Sensitivity of the Hydrogen Bonded Region... 40
4.7 Conclusions ... 41
4.8 M aterials and M ethods... 42
4.9 Supplem ental Inform ation... 45
5. Designing Zw itter-wettable Surfaces... 51
5.1 Introduction ... 52
5.2 Results and Discussion... 54
5.3 M ethods... 64
5.4 Supporting Inform ation... 69
6. Ion D istribution in Block Copolym er Electrolyte Thin Film s... 71
6.1 Introduction ... 72
6.2 Results and Discussion... 75
6.3 Supporting Inform ation... 86
6.4 M aterials and M ethods ... 88
7. Cellular Backpacks ... 91
7.2.1 Introduction... 96
7.2.2 Results... -.... 97
7.2.3 D iscussion... 105
7.2.4 Experim ental Section... 107
7.3 Monocyte Hitchhiking: Delivery of Phagocyte Resistant Backpacks to Lungs ... 113
7.3.1 Supporting Figures... 121
7.3.2 Experim ental Section... 124
7.4 Future Applications ... 129
7.5 Tissue Engineering Applications ... 130
7.5.1 Controlled A ggregate Size using Cell Backpacks ... 130
7.5.2 Immune Cell Bilayers Assembled Using Layer-by-Layer Processing ... 131
7.6 Supplem ental Inform ation... 137
8. Orientation-Specific Attachment of Polymeric Microtubes on Cell Surfaces... 139
8.1 Introduction... 139
8.2 Fabrication of Cellular Tubes... 141
8.3 Effect of Chem istry on the Cell Surface Orientation... 143
8.4 Conclusion and Future Outlook ... 147
8.5 Experim ental D etails ... 148
8.6 Supplem ental Figures... 150
9. Future W ork ... 151
10. Citations ...----.... 153
11. Appendix...---.. 165
1. LIST OF FIGURES
Figure 3-1: Procedure to create electrostatic Polyelectrolyte Multilayers (PEMs) A) The surface is alternately dipped in solutions of oppositely charged polymers and rinsed in between. B) The polymers are adsorbed and sequentially build a film. - Adapted from (13) ... 20 Figure 4-1: Schematic of systems used to test (A) chitosan diffusion into the hydrogen bonded region and (B) electrostatic blocking layer effectiveness. The number after the polymer abbreviation is the deposition solution pH... 30
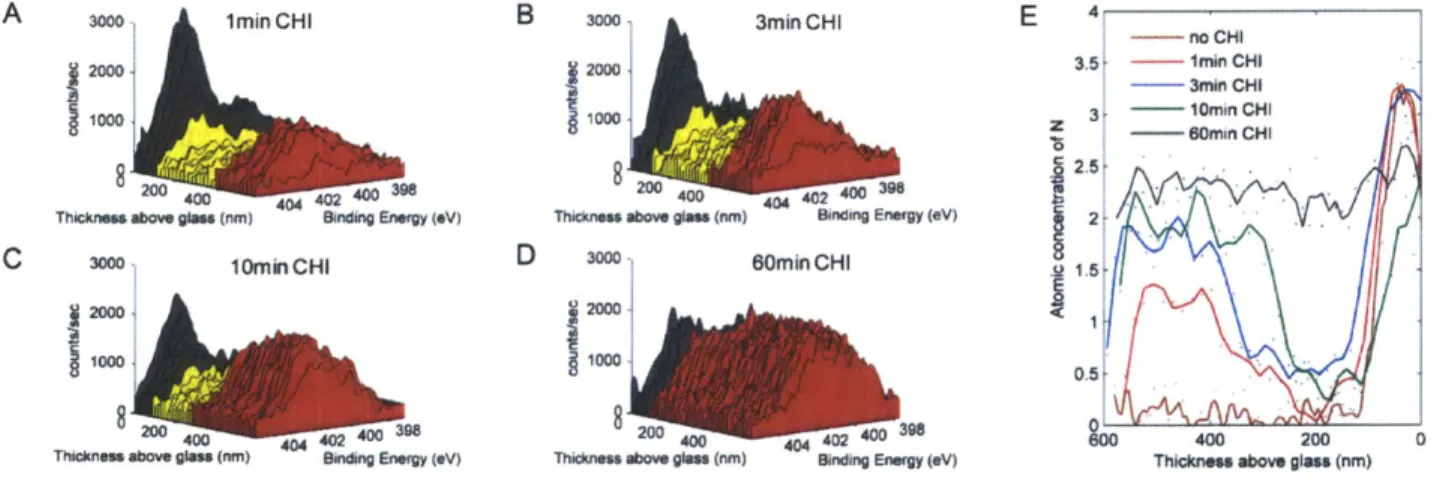
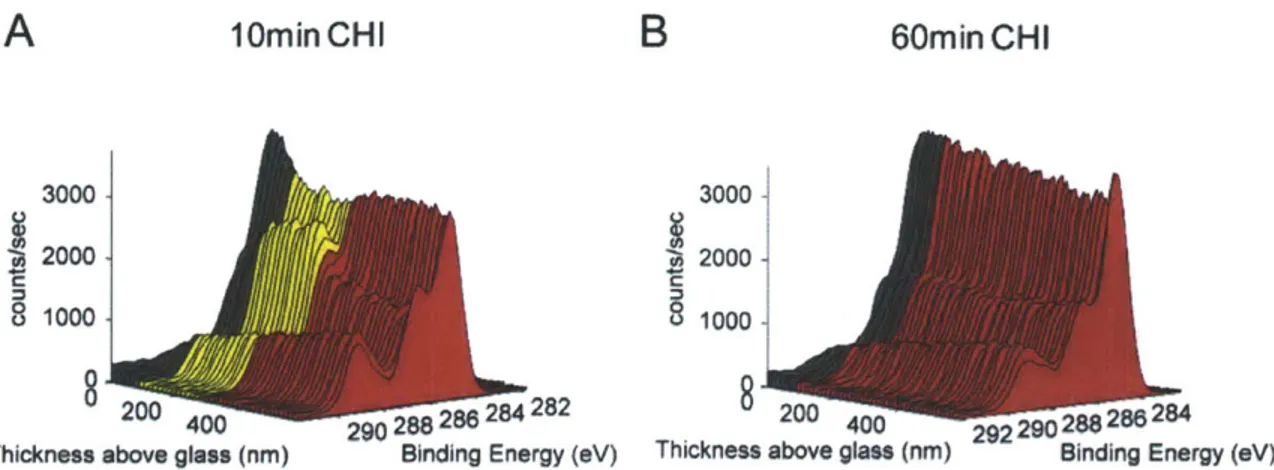
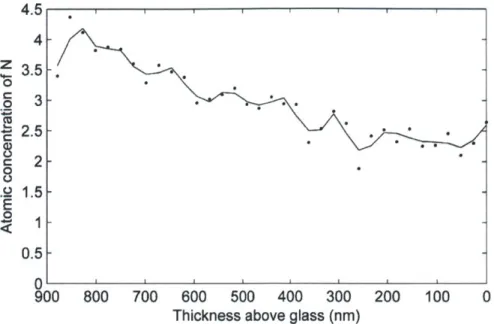
Figure 4-2: Diffusion of chitosan into hydrogen bonded films. Spectra of hydrogen bonded
(PAA3/PEO3) films exposed to chitosan solution for different amounts of time. (A) 1 min
exposure (B) 3 min exposure (C) 10 min exposure (D) 60 min exposure to chitosan. The color scheme is the same as that of Figure IA. Red spectra represent chitosan infused areas, yellow spectra represent the hydrogen bonded (PAA3/PEO3) area and black spectra represent the (PDAC4/SPS4) adhesion layer. (E) Quantification of A-D to determine the atomic concentration of nitrogen with depth in the film. Data points are individual dots and line shown is the result of a Savitzky-Golay five point quadratic alg orith m ... 3 1 Figure 4-3: High resolution Cls XPS depth profiling of a hydrogen bonded film exposed to
chitosan solution. (A) 1 min (B) 3 min exposure to chitosan. The color scheme is the same as that of Figure 4-lA. Red spectra represent chitosan infused areas, yellow spectra represent the hydrogen bonded (PAA3/PEO3) areas and black spectra represent the (PDAC4/SPS4) adhesion layer. Comparing the red chitosan diffused areas to the yellow hydrogen bonded areas the chitosan diffused areas have a lower signal at 286.5eV since PEO has diffused out. (C) Comparison of Cls spectra with different chitosan exposure times to the initial yellow hydrogen bonded area. The longer exposure to chitosan solution, the more the PEO signal at 286.5eV decreases. All chitosan exposed spectra were from ~450 nm above the glass surface... 35
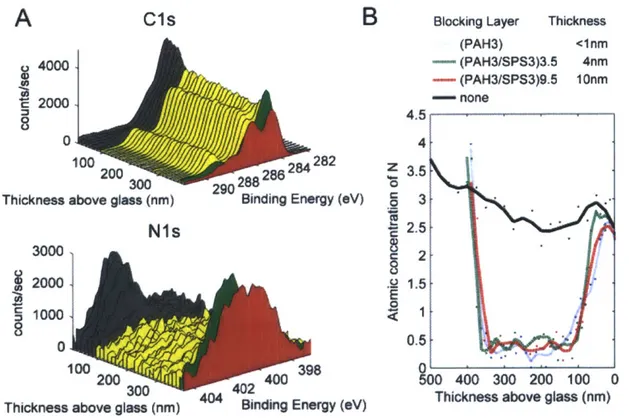
Figure 4-4: Effect of a blocking layer on interlayer diffusion of chitosan (A) C Is and Ni s regions from depth profiling XPS of a hydrogen bonded sample with a (PAH3/SPS3)3 5 blocking layer topped with (HA3/CHI3)35. The color scheme is the same as that of Figure 4-lB.
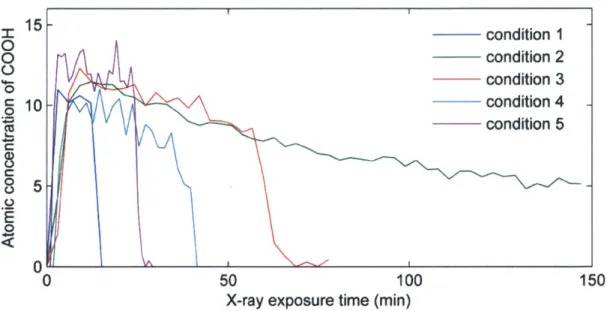
Red spectra represent (HA3/CHI3), green spectra represent the (PAH3/SPS3) electrostatic blocking layer, yellow spectra represent the (PAA3/PEO3) hydrogen bonded region and black spectra represent the (PDAC4/SPS4) adhesion layer. (B) Quantification of the nitrogen signal for different blocking layer systems tested. Data points are individual dots and the line is the result of a Savitzky-Golay five point smoothing algorithm. All films had (HA3/CHI3)3 5 deposited on top of the blocking layer... 37 Figure 4-5: Chemical structure of the polymers in this study... 42 Figure 4-6: Increasing X-ray Exposure Time Decreases Carboxyl Atomic Concentration: To
study the effect of X-ray exposure and sputtering conditions identical (PAA3/PEO3) 30.5 (PAH3/SPS3) 9.5 samples were exposed to a variety of X-ray exposure levels while depth profiling. Data was analyzed with Multipak software (Physical Electronics, USA) and then the carboxyl peak at 289eV was fitted using CasaXPS software. Different XPS data acquisition parameters were tested along with different C6 0* cluster ion sputtering conditions to determine conditions with minimal decrease in carboxyl signal, high signal to noise ratio and many data points while depth profiling. The carboxyl signal was chosen to determine X-ray damage since it is highly sensitive to degradation. It was determined that the condition 5 shown above provided a good balance of these demands and the final acquisition parameters are found in Table 4-3. The degradation of the film due to extended X-ray exposure or sputtering is a limitation that should be carefully considered
by others before using this technique. C6 0 deposition was not observed since the C-C bond at 285eV did not systematically increase... 46 Figure 4-7: XPS Depth profile in absence of chitosan. (A) Nis signal from a (PAA3/PEO3) film before exposure to chitosan. The only Nis signal is from the (PDAC4/SPS4) adhesion layer. (B) PDAC from (PDAC4/SPS4) adhesion layer does not diffuse into the hydrogen bonded region (PAA3/PEO3) on top of it even after 15 hours in pH 3 water as shown by the absence of nitrogen signal above the adhesion layer. ... 47 Figure 4-8: GATR-FTIR results showing ionization of PAA upon chitosan diffusion. Two distinct peaks from the carboxylic acid functional group of PAA are shown: one at -1550 cm 1 is associated with the asymmetric stretching of the ionized carboxylate (COO-) and the other at -1710 cm' which is associated with the C=O stretching of the carboxylic acid
(COOH) groups. In comparison to the pure hydrogen bonded sample (PAA3/PEO3), the
sample exposed to chitosan for 10 minutes has a higher amount of ionized carboxylate gro u p s... 4 7 Figure 4-9: High resolution Cls XPS depth profiling of a hydrogen bonded film exposed to chitosan solution. (A) 10 min and (B) 60 min exposure to chitosan. The color scheme is the same as that of Figure 4-A. Red spectra represent chitosan infused areas, yellow spectra represent the hydrogen bonded (PAA3/PEO3) areas and black spectra represent the (PDAC4/SPS4) adhesion layer... 48 Figure 4-10: Pure component Cls XPS spectra. (A) Poly(ethylene oxide) (B) Chitosan (C)
P oly(acrylic acid)...48
Figure 4-11: N Is spectra from depth profiling XPS of hydrogen bonded films with different blocking layers. All samples were topped with (HA3/CHI3)3.5. (A) No blocking Layer (B) (PAH3/SPS3)9.5 layer (C) (PAH3/SPS3)3 5 layer (D) Single (PAH3) layer ... 49 Figure 4-12: (CHI3/HA3)3.5 on top of a hydrogen bonded region. Independent of whether CHI or HA is deposited first onto the hydrogen bonded region, the chitosan diffuses fully
through the film as seen by the nitrogen signal throughout the film. ... 50
Figure 4-13: Comparison of CHIlO nitrogen signal before and after PBS exposure. CHIlO sample did not dissolve after a 30 minute PBS soak. It was stabilized due to the diffusion and electrostatic cross-linking of chitosan as seen by high levels of nitrogen throughout th e film ... 5 0
Figure 5-1: (a) Structures of the polymers described in this paper. Polycations and polyanions are labeled with parenthesis (+), (-), respectively. (b) Water advancing contact angle of the samples tested. (c) Photographs taken immediately after transfer to ambient lab conditions (22 ± 1 'C, 40 ± 10% RH) from a -1 C refrigerator (1 hr). Only the
hydrophilic surface and zwitter-wettable surface resisted fog formation. (d) Schematic representation of hydrophilic surface with sessile drop and during condensation. (e) Schematic representation of zwitter-wettable surface with sessile drop and during conden sation ... 54
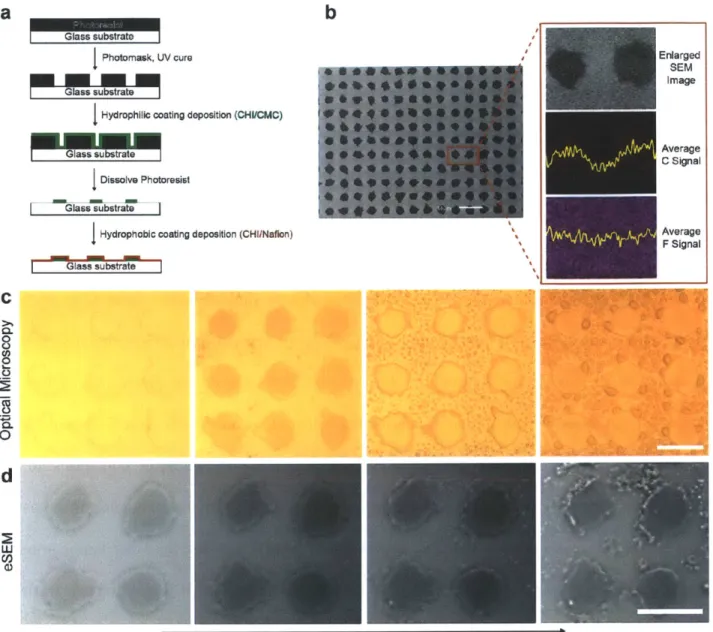
Figure 5-2: (a) Schematic diagram of the polymer patch fabrication process. (b) Scanning electron microscopy (SEM) image of the polymer patch. Scale bar is 50 pm. Outlet image shows the enlarged SEM image and the average carbon and fluorine signal obtained from energy dispersive X-ray spectrometry (EDS). (c) Optical microscopy image of the polymer patch after exposure to humid air. (d) ESEM images of the condensation of water vapor on a polymer patch. Water droplets start to form on the off-patch areas and at the edges of the patches. ... 57
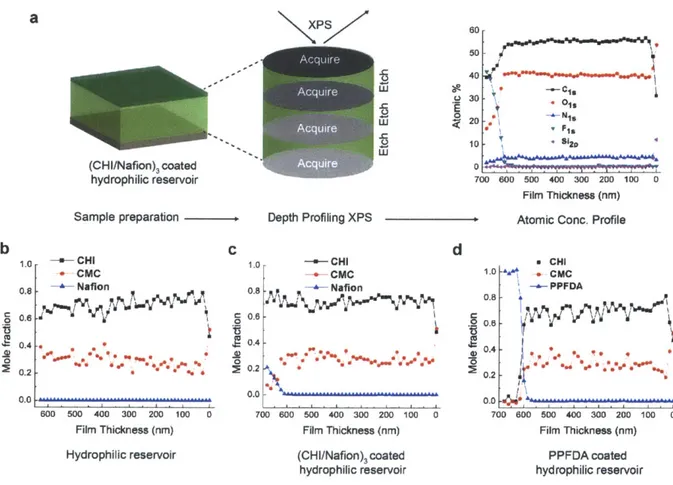
Figure 5-3: (a) Schematic of depth-profiling x-ray photoelectron spectroscopy (XPS) used to acquire atomic concentration profile and molar ratio profile of various samples tested. Here, atomic concentration of (CHI/Nafion)3 coated hydrophilic surface is shown as an
example. (b) Molar ratio of hydrophilic surface ((CHI/CMC)30) with depth in the film. (c) Molar ratio of (CHI/Nafion)3 coated hydrophilic surface with depth in the film. (d) Molar
ratio of PPFDA coated hydrophilic surface with depth in the film... 59
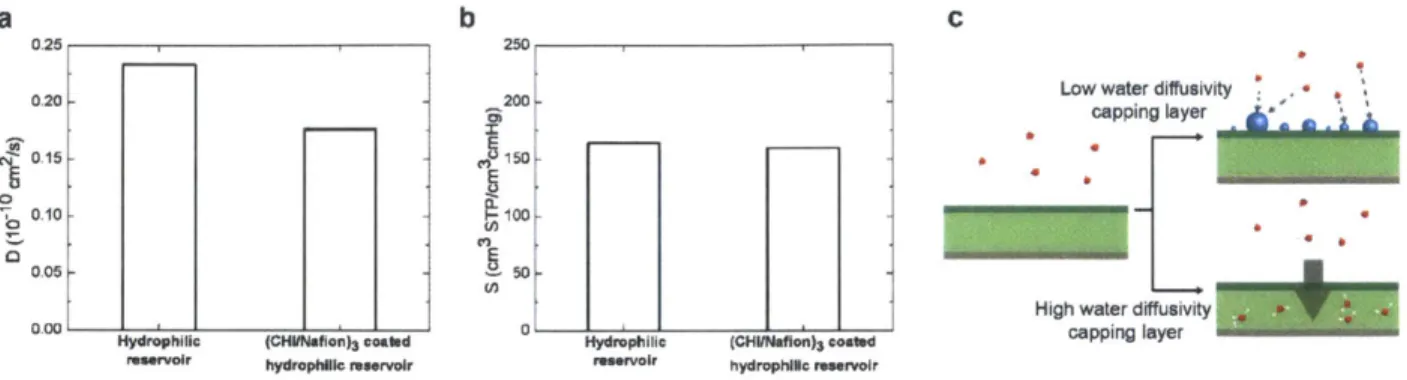
Figure 5-4: (a) Diffusivity (D) of water vapor in hydrophilic reservoir and (CHI/Nafion)3 coated
hydrophilic reservoir (b) Solubility of water vapor in hydrophilic reservoir and (CHI/Nafion)3 coated hydrophilic reservoir. (c) Schematic representation of the effect of
the ability of thin hydrophobic capping layer to transport water molecules: For low diffusivity capping layer, water molecules nucleate and grow on the surface while for high diffusivity capping layer, water molecules in the vapor phase prefer to directly imbibe into the underlying hydrophilic reservoir. ... 61
Figure 5-5: (a) Water contact angle evolution over time for (CHI/CMC)30 subsequently coated with 1-, 2-, and 3- bilayers of (CHI/Nafion) by LbL technique. (b) Water contact angle evolution over time for various samples tested in this work. ... 69
Figure 5-6: Advancing and receding contact angle of water, diiodomethane, and hexadecane on (CHI/Nafion)3 coated hydrophilic reservoir. ... 70
Figure 6-1: Fabrication of lamellar PS-POEM lithium containing films. ... 76 Figure 6-2: (A) Optical images of gradient thickness PS-POEM films (neat, 12:1 salt and 6:1 salt) annealed at 135 'C for 6 h; (B) AFM height images and corresponding sections
show that the difference between the high and low regions is Lo, which is consistent with
SAXS m easurement of the bulk system ... 77
Figure 6-3: X-ray reflectivity profile for PS-POEM films with salt ratio 12:1 and 6:1. The solid line denotes measured profile and the "o" symbol denotes fitted profile... 79
Figure 6-4: Depth Profiling XPS of 36 kDa PS-POEM without lithium salt. (A) Schematic of depth profiling XPS analysis. (B) Atomic concentration versus thickness above the substrate. (C) and (D) Ols and Cl s photoelectron spectra respectively, showing the alternating intensity of a lamellar block copolymer film. The red and blue spectra are spectra primarily in the POEM and PS region respectively. ... 81
Figure 6-5: XPS depth profiling of 36kDa PS-b-POEM with 6:1 Li salt added. (A) Atomic concentration profile with depth. (B) Zoom-in of low concentration and overlay of fluorine atomic ratio comparison. (C) Distribution of PEO containing side block within the film analyzed via Ols signal minus Ols signal from the salt (dashed green), fitting the Cls peak (dashed blue) or Fis ratio to POEM (dashed red) (D), (E), (F) and (G) 3D spectra of the Cls, Lils, Fis and Ols regions respectively. The Lils figure is rotated for clarity ... 84
Figure 6-6: Bulk TEM image of salt-doped PS-POEM with EO:Li = 6:1. Dark domains
correspond to RuO4-stained POEM; B. AFM height image of salt-doped PS-POEM thin film with EO:Li = 4:1, indicating a mixed cylinder and lamella structure... 86 Figure 6-7: Peak fitting to the different regions of the C Is spectra. A) POEM region displaying peaks from the POEM backbone (C-C) PEO side chain (PEO), ester linkage (Ester Carbon) and lithium Salt (CF3). B) PS region displaying Carbon bonds (C-C) a very small peak from PEO side chain (PEO) and C-C bond shake up peak due to pi stacking.
... 8 6
Figure 6-8: Effect of Inelastic Mean Free Path (IMFP) on Depth Profiling Interface Analysis. Comparing experimental data 'o' to the modeled system we see that though the IMFP would affect the shape of the profile, but not to the extent seen in our data. ... 87
Figure 7-1: Fabrication of Backpacks on a Surface. Reprinted with permission from Swiston,
A.J., Cheng, C., Urn, S.H., Irvine, D.J., Cohen, R.E., and Rubner, M.F. Nano Lett. 8,
4446-4453 (2008). Copyright 2008 American Chemical Society. ... 92
Figure 7-2: Potential Methods of Cell Attachment A) Attachment of red labeled B-cells onto
FITC labeled (hyaluronic acid/chitosan) patches (reproduced from Al Swiston). scale bar
1 Opm B) Attachment of unlabeled Monocytes onto (PAA4/PAH4) patches activated with
EDC-NHS. scale bar l0pm C) Attachment of unlabeled Monocytes onto green labeled IgG presenting patches. scale bar 50pm . ... 93
Figure 7-3: Attachment Scheme of Cell Backpacks a) PEM posts with three regions remains on the surface after the removal of the photoresist. b) The posts are incubated with cells to attach them to the posts c) The hydrogen bonding region is then dissolved, resulting in cells with backpacks attached. Reprinted with permission from Swiston, A.J., Cheng, C.,
Urn, S.H., Irvine, D.J., Cohen, R.E., and Rubner, M.F. Nano Lett. 8, 4446-4453 (2008).
Copyright 2008 American Chemical Society. ... 95
Figure 7-4: Backpacks for cell-based drug delivery devices: (a) schematic of the different backpack layers, all of which deposited on top of a photoresist-patterned glass substrate and (b) scanning electron micrograph of a backpack with a PMAA/PVPON release region fabricated by the above strategy. The average diameter is ~ 6 pm and the backpacks have a flat disk shape. (c) Time lapse microscopy image sequence of macrophages interacting with HA/CHI coated backpacks. The arrow indicates an internalized backpack. All other backpacks (n=7) are attached to macrophage surfaces for the entire time lapse sequence of 50 minutes, exhibit strong resistance to macrophage phagocytosis. (d) Quantitative analysis of 6 pm diameter particles internalization by macrophages. Data is presented in terms of internalization percentage (percentage of particles observed that were internalized by phagocytosis). At least 100 particles were observed for each condition. Amine modified spheres act as a positive control and show a high internalization percentage. HA coated backpacks show significantly lower internalization percentage compared to both HA coated spheres and amine modified spheres. (e) Scanning electron micrographs showing the interaction of backpacks and spheres with macrophages after 3 hours of incubation in standard cell culture conditions:
(i) HA coated backpack attached to the surface of a macrophage, and (ii) three 6 pm diameter HA coated spheres internalized within a macrophage... 99
Figure 7-5: Backpack attachment to macrophages does not affect cellular health and functions. (a) Time lapse video microscopy showing that a backpack-laden macrophage can still efficiently internalize 3 pm PS spheres (MP: Macrophage, BP: Backpack, PS-S: 3 pm polystyrene sphere). The backpack is not internalized during the entire duration of the time lapse sequence. (b) Differences in migration distance of macrophages with and without backpacks 3 hours were found to be insignificant. (c) MTT assay results in terms of proliferation potential, where 1 indicates healthy proliferation capacity and 0 indicates com plete cell toxicity... 102 Figure 7-6: Controlled release of FITC-BSA from therapeutic backpacks. (a) Fabrication schematic (b) Controlled release profile of FITC-BSA in-vitro. The normalized release of
FITC-BSA occurred over multiple hours and was not dependent on the loading
percentage of the spray emulsion used. Red and blue lines correspond to 7.5 wt% and 25 w t% , respectively...105
Figure 7-7: Design of cellular backpacks and confirmation of antibody presentation. (a) Schematic of a cellular backpack. (b) TRITC-Streptavidin and mouse-IgG-biotin are localized to the backpack and activity is shown by secondary antibody
anti-mouse-IgG labeling. (c) If mouse-anti-mouse-IgG-biotin is not added to the backpack, no specific
FITC-anti-m ouse-IgG labeling is seen... 116
Figure 7-8: Attachment of cellular backpacks to WEHI-265.1 monocytes and effect on monocyte ability to differentiate into macrophages. (a) Confocal and brightfield overlay images of: (i) a BP (green) wrapping around a stained monocyte (red) and (ii) monocytes (unstained) attaching to an array of patterned BPs (green). (b) Brightfield images of: (i) WEHI-265.1 monocytes in normal culture media at 48 hours, (ii) WEHI-265.1 monocytes differentiated into macrophages via incubation with phorbol 12-myristate 13-acetate (PMA) treated culture media at 48 hours, (iii) FACS sorted monocytes with BPs (green) attached prior to incubation for 48 hours with 50nM PMA, and (iv) J774 macrophages.
Figure 7-9: Transmigration of WEHI-265.1 monocytes and in vivo targeting. (a) Analysis of monocyte migration (MCP- 1 initiated) through HUVEC layer for monocytes alone (black squares), monocytes with backpacks attached (black circles) and negative control of media alone without monocytes (black triangles). Values represent mean ± SD (n = 3). (b) Analysis of BP migration through HUVEC layer when attached to monocytes (black)
and in free solution without monocytes present (hatched) at 24 and 48 hours. Values represent mean ± SD (n = 3). (c) Percent of injectable dose per gram (%ID/g) 3H-backpacks attached to monocytes in normal mice (black bars) and LPS induced lung inflamed mice (hatched bars) at 6 hours. Values represent mean ± SEM (n = 4). Statistical difference (P < 0.01) is seen only in lungs... 119
Figure 7-10: Preparation of Cellular Backpacks i) incubation of Cell Backpacks with streptavidin (can be TRITC labeled) ii) Exposure to mouse IgG-biotin to dock onto streptavidin iii) Backpacks washed and ready for attachment. ... 121 Figure 7-11: Secondary Labeling to Check Activity of the Antibody on Backpack Array (no pH
sensitive release region). i) and ii) show backpacks exposed to IgG-b or not respectively. iii) After exposure to anti-mouse IgG-FITC, if the antibody is active and present the sample will fluoresce (iii), if not there will be no signal (iv). ... 121 Figure 7-12: FACS plots and approximate gating for backpack attachment to WEHI-265.1 monocytes. (i) Representative FACS output for WEHI-265.1 monocytes alone with approximate gate. (ii) Representative FACS output for backpacks alone with approximate gate. (iii) Representative FACS output for solution containing conjugates, unmodified monocytes and unattached backpacks with approximate gates. (iv) Representative FACS data of monocyte-bound BPs via FACS, showing unmodified monocytes (red), unattached BPs (purple), and conjugates (green) showing both >50% BPs attached to monocytes and >50% of monocytes with at least 1 BP attached at a 1:1 (cell:BP) incubation ratio. Inset shows representative histogram as a function of fluorescent intensity from the sam e experim ent...122 Figure 7-13: Toxicity assay for backpacks and WEHI-265.1 monocytes. 24 hour MTT assay
showing limited toxicity to monocytes incubated with BPs functionalized with IgG-b. V alues represent m ean + SD (n = 3)... 123
Figure 7-14: Schematic of Monocyte Targeting in vivo Experiment. Acute inflammation caused
by LPS will cause the monocytes to localize to the lung (left), while in the non-inflamed
case (right) m inimal accumulation will occur. ... 123
Figure 7-15: Expression of ICAM-1 following LPS induction in BALB/c mice. ICAM-1 expression in lungs 24 hours after intranasal administration of 0 pig, 5 jig, and 1 Opg LPS.
... 12 4 Figure 7-16: Cluster Size Dependence on Patch Diameter A) Using a 7pm backpack B) Using a
1 5pm backpack. R= (# cells)/(# Backpacks) (167) ... 131
Figure 7-17: Bilayers of B-cells stabilized by HA and CHI on a (HA3/CHI3) substrate A) First layer of the cell structure and the structure is primarily green. B) The second layer of the cellular bilayer and the structure is primarily red. Scale bar is 20 pm. ... 132 Figure 7-18: Inclusion of synthetic RNA into a film: A) Film containing (Poly(I:C)5/LPEI5) was
built and is stable through acetone sonication. Thickness of (Poly(I:C)5/LPEI5)20 was 3 5 0 n m . ... 13 7
Figure 7-19: 7pm Quantum Dot full BPs as excited by 543nm HeNe Laser A) Backpack Structure (PMAA2/PVPON2) 30.5 (PAH3/MNP4)10.5 (PAA4/PAH-b4)8 B) Backpack
Structure (PMAA2/PVPON2) 30.5 (PAH5/QD5) 30.5 (PAA4/PAH-b4)8 C) Backpack
Structure (PMAA2/PVPON2) 30.5 (PAH3/MNP4) 10.5 (QD5/PAH5) 30 (PAA4/PAH-b4)8 D)
Emission of backpacks shown in A-C. Backpacks were released into PBS and excited at 543nm on a spectrofluorom eter... 138
Figure 8-1: Fabrication Scheme of Orientation Controlled Microtubes... 142 Figure 8-2: Scanning electron micrographs of cell tubes with (PAA/PAH-Rhod)40 outside and
(HA/FITC-CHI)40 inside on the surface of a syringe filter... 143
Figure 8-3: Confocal microscopy images of heterostructured tubes dried on a slide along with cartoons of the structure. Red represents the cell-resistant rhodamine conjugated
(PAA/PAH) multilayers and green represents the cell-adhesive FITC conjugated (HA/CHI) multilayers. a) (PAA/PAH-Rhod)40 b) (PAA/PAH-Rhod)40 outside and
(HA/FITC-CHI)40 inside c) (HA/FITC-CHI)4 outside and (PAA/PAH-Rhod)40 inside. Full
image scale bars are 10 pm and inset scale bars are 5pm... 144 Figure 8-4: Controlled Orientation of Microtubes on the Surface of B-cells: a) Samples were analyzed using confocal microscopy and microtubes with cell-adhesive (HA/CHI) on the inside caused more end-on attachment. b) Confocal images of cell tube interactions i) (PAA/PAH-Rhod)40 ii) (PAA/PAH-Rhod)40 outside and (HA/FITC-CHI)40 inside iii)
(HA/FITC-CHI)4 outside and (PAA/PAH-Rhod)40 inside. Scale bar 10 pm. c) Ratio of
'End-on' to 'Side-on' showing effect of tube structure d) Cellular viability of the B-cells after 24 hr incubation with tubes. Viability was not altered by the addition of (HA/CHI) outside tubes added at a 1:1 cell to tube ratio. ... 146 Figure 8-5: Representative confocal images of cell-tube orientation study after 1-2 hours a)
(PAA/PAH-Rhod)40 b) (PAA/PAH-Rhod)40 outside and (HA/FITC-CHI)40 inside c)
(HA/FITC-CHI)4 outside and (PAA/PAH-Rhod)40 inside. ... 147
Figure 8-6: Confocal microscopy images of heterostructured tubes dried on a slide along with cartoons of the structure. Red represents the cell-resistant rhodamine conjugated
(PAA/PAH) multilayers and green represents the cell-adhesive FITC conjugated (HA/CHI) multilayers. a) (PAA/PAH-Rhod)40 b) (PAA/PAH-Rhod)40 outside and
(HA/FITC-CHI)40 inside c) (HA/FITC-CHI)4 outside and (PAA/PAH-Rhod)40 inside.
Im age scale bars are 1 Opm ... 150
Figure 11-1: PEM System studied for analysis of released free floating film chemistry ... 165 Figure 11-2: A) Method for flipping of the film prior to XPS, pH 7.4 PBS dissolves the hydrogen bonding region, allowing the film to be flipped. B) Cls XPS spectra of an as-deposited
(PAA3.0/PEG3.0)20.5, (PAA3.0/PAH3.0)lo and flipped (PAA3.0/PEG3.0)20.5
(PAH3.0/MNP4.0)10 film. PAA's carboxyl Cls peak in the flipped film shifts to lower
binding energy as would be expected when paired with an amine. PEG's Cls peak also significantly shrinks in the flipped sample, suggesting the ejection of PEG upon PAH disrupting the PAA-PEG hydrogen bonds... 166
Figure 11-3: XPS spectra and atomic percentages for a flipped (PAA3.0/PEG-SH3.0)20.5
(PAH3.O/MNP4.0) 10 film. The peaks for C, N, 0, and S are as indicated - all other peaks are due to residual salt from PBS. Inset shows the S peak at 168eV... 169
2. LIST OF TABLES
Table 4-1: Diffusion of Chitosan in a Swollen Hydrogen Bonded Film ... 33
Table 4-2: pH Sensitivity of the Hydrogen Bonded Region... 40
Table 4-3: Detailed XPS Acquisition Parameters... 44
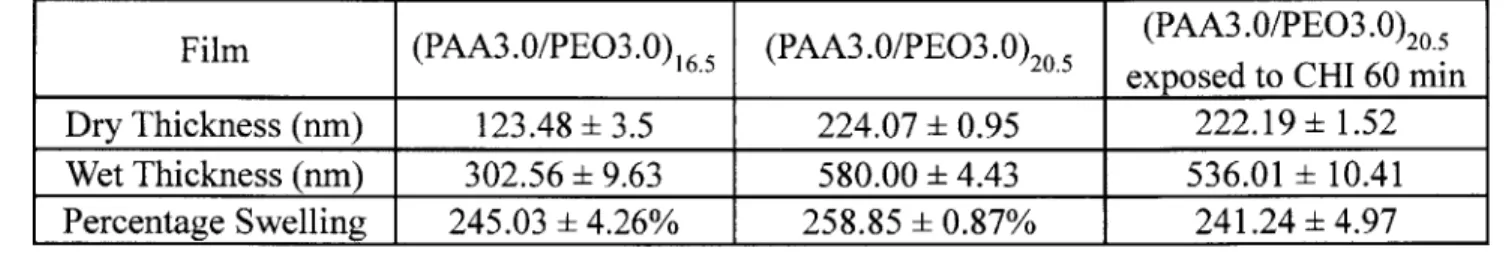
Table 4-4: Swelling of (PAA3/PEO3) in pH3 water as measured by wet ellipsometry ... 45
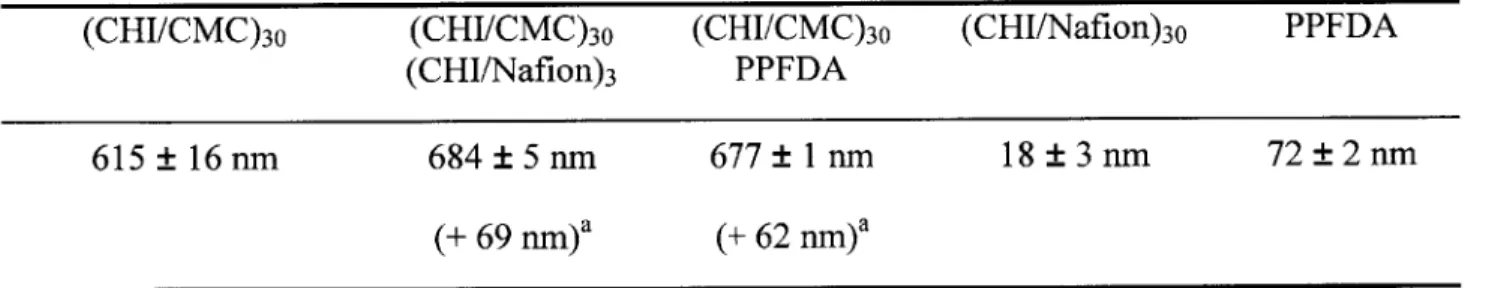
Table 5-1: Thickness of the multilayer films used in this work. ... 56
Table 6-1: Atom ic Com position Ratios... 87
Table 6-2: IMFP information used for modeling from Tanuma et al.(1 10). Also shown is the relationship between the Intensity (I) of each electron from different depths (d) within the film depending on its IM FP (k)... 88
Table 6-3: Detailed XPS Acquisition Parameters for BCP Depth Profiling ... 90
3. INTRODUCTION AND BACKGROUND
3.1 Introduction
My thesis is focused around the versatile potential of structured polyelectrolyte
multilayer thin films. These easy-to-fabricate polymeric thin films can have an exceptionally wide range of applications depending on the materials and the chosen nanostructure. The Rubner and Cohen groups alone have researched functional films that are antibacterial(l), anti-fogging(2), optically active(3), drug delivery systems(4), stimuli-responsive(5) and many other properties.
My thesis focuses on two areas. First I study the nanostructure of stratified
polyelectrolyte multilayer films primarily through the use of depth profiling X-ray Photoelectron Spectroscopy (XPS) to fundamentally understand how thin film structure and function relate. This method has the unique capability to determine the atomic and chemical state of a thin film with depth with nanometer resolution without any chemical labeling or modification. Exploring the application of this technique I probed the nanostructure of functional thin films for applications in antifogging surfaces and solid block copolymer batteries. In the second area of my thesis I apply insights derived from this powerful technique to effectively create functional biomedical materials including flat anisotropic polymeric particles we call 'cellular backpacks' and also orientation controlled microtubes. I show the how the film polymeric film nanostructure controls the function in vitro and in vivo.
3.2 Nanostructured Thin Films
One method to fabricate nanostructured films is through the use of polyelectrolyte multilayers (PEMs). These films are formed by dipping a surface of any shape into a solution of
species that adsorbs and forms a conformal layer. The advantages of this method include that it is simple to perform, aqueous based, and can contain a diversity of materials. Previous work has used proteins(6), small molecules(7), nanoparticles(8), natural and synthetic polymers(9, 10),
DNA(1 1), inorganic platelets(12) and many other materials as material to build functional thin films.
The film growth can be driven by a variety of interactions including hydrogen bonding, biological recognition, hydrophobicity and covalent interactions, but the most common method is electrostatic interactions as first described by Decher in the 1990s. The figure below shows the process of using electrostatic interactions to create a bilayer of polymers on a surface (13).
A
2
L
3
4II
B
1 Poyanion 3. Polycafion
2. Wash 4. WaSh
Figure 3-1: Procedure to create electrostatic Polyelectrolyte Multilayers (PEMs) A) The surface is alternately dipped in solutions of oppositely charged polymers and rinsed in between. B) The polymers are adsorbed and sequentially build a film. - Adapted from (13)
Depending on the choice of materials, PEMs can have a wide range of applications. For applications in biology, the PEM technique is especially relevant since the active materials can be deposited under physiological conditions, allowing for the incorporation of biomolecules. As a result, PEMs are important to biomedical problems such as drug delivery, tissue engineering and biomedical materials (14). Another application of PEMs explored is the control of water
condensation for applications in antifogging surfaces. Enabled by the capability to easily deposit films using the layer-by-layer assembly method, we studied the antifogging properties of a variety of materials ranging from hydrophilic biopolymers and hydrophobic fluorine containing polymers.
Furthermore, by altering the materials included, the films can become stimuli responsive. One type of stimuli responsive PEM of particular interest are hydrogen bonding films. If a film of hydrogen bonding polymers is raised above a critical pH value, then the ionization of the polymers will result in the film dissolving. This can be used to create free floating films which have a variety of biomedical applications (15, 16). The nomenclature for PEM films for the rest of this thesis follows the convention ("poly 1 "X/"poly2"Y)z, where X and Y represent the pH of the polymer solutions used during assembly, and Z is the total number of bilayers deposited.
3.2.1 Fundamental Studies of Nanostructured Films
Functional thin films often require stratified structures with a distinct purpose for each layer and nanometer level control over the structure(1 7). However, due to dynamic diffusion of the species between layers, the composition and function of these layers may not be as desired. Analysis of the diffusion of species between layers has proven difficult with other methods (FRET, neutron reflectivity, confocal microscopy, FTIR, SIMS), but high-resolution depth profiling X-ray Photoelectron Spectroscopy (XPS) using polymer-friendly cluster-ion C60 sputtering can detect new details. This technique has never before been applied to functional nanostructured films, and allows for the direct determination of the composition and chemical bonding properties of polymeric films.
Applying this technique to a model nanostructured film in Chapter 4, we explored common issues in the field such as the dynamic competition between hydrogen bonding and electrostatic interactions during fabrication, blocking interlayer diffusion, the exchange of film components with a surrounding solution, and the kinetics of interlayer diffusion. Using high resolution depth profiling XPS we analyzed the diffusion of chitosan, a commonly used biopolymer, within the PEM. Furthermore, we quantified the effect of this diffusion on the film structure and function and finally showed a method to stop this interlayer diffusion. We propose that our results address some common issues of interlayer diffusion and could be applied to multiple fields utilizing organic thin films.
I further applied this technique to two very distinct problems: one in surface science and
one in polymer batteries. In Chapter 5, in collaboration with Hyomin Lee of the Rubner/Cohen Group, we analyzed the molecular profile and nanostructure of zwitter-wettable surfaces to understand the role of polymer interlayer diffusion on antifogging and antifrosting surfaces. Zwitter-wettable surfaces are unique surfaces with the capability to absorb molecular water directly into the film, yet still present a hydrophobic character to macroscopic water droplets. This uncommon combination provides the ability to overcome the limitations of current hydrophilic anti-fogging surfaces.
In Chapter 6, I demonstrate the resolution limits of the depth profiling technique to resolve the structure of lamellar block copolymer systems. This work is in collaboration with Ming Luo of the Epps Group at the University of Delaware. We analyze aligned lamellar films of polystyrene-b-poly(oxyethylene methacrylate) that have been swollen with lithium salts for applications in solid state lithium-ion batteries. This block copolymer architecture is an exciting type of solvent-free polymer electrolyte, since the PEO based region can solubilize the lithium
ions while the polystyrene can provide the mechanical rigidity needed to maintain the separation of the anode and cathode(1 8). For this application, we are interested in whether XPS depth profiling can resolve the distribution of lithium within the nanostructured PEO region. Previous research has seen significant increases in conductivity with larger (higher molecular weight) domains and it has been hypothesized that the lithium ions are concentrated in the center of the POEM. However, the experimental proof is limited(19). Using depth profiling XPS, we believe that better analysis capabilities may enable a thorough understanding of the phenomenon and potentially allow for more effective polymer electrolyte design.
3.2.2 Biomedical Applications of Nanostructured Films
The second area of my thesis is focused on the design of nanostructured materials for biological applications. In particular, I have chosen to focus on drug delivery since effective material delivery to desired regions in the body has the potential to greatly improve human health. Drug delivery has been enabled by designing the surface chemistry and, more recently, the shape of particles for therapeutic targeting (20). In particular, recent research from the Mitragotri group at UCSB clarified the effect of shape on cellular response and applied these insights for enhanced drug delivery(21). Furthermore, recent studies have started using cell-mediated drug delivery which uses the cell's natural function, such as homing to inflammation or disease sites, to deliver the desired therapeutic materials(22). This synergistic combination has great potential to increase the efficiency of drug delivery in the future.
In Chapter 7, I discuss the development of a uniquely shaped polymeric particle termed a cellular backpack that conjugates strongly to the surface of immune cells through specific interactions and has many applications in cell-mediated delivery. The technology was first
immune cells and UCSB. In general, backpacks are anisotropic, stratified polymeric particles that are hundreds of nanometers thick and microns wide(23). Since a backpack leaves most of the cell surface unaltered, the biological functions and characteristics of cells have not shown to be greatly changed upon its conjugation with the cell surface. Additionally, Swiston noticed that the backpacks were not being phagocytosed, and in partnership with the Mitragotri group at
UCSB, we further explored this potential. Our continuing collaboration with the Mitragotri group
has shown that the backpack is uniquely positioned for cell-mediated therapeutic delivery in areas such as inflammation or cancer.
Chapter 8 discusses cellular microtubes as another application of nanostructured materials for biomedical applications. The cellular microtube is built on the idea that shape, surface chemistry and size can be designed to increase the function of a material. In particular, it has been found that the local shape of an anisotropic particle in contact with the cell determines the internalization rate of the particle(24). This insight drives the desire to design anisotropic particles that orient themselves on the surface of living cells to either promote or resist internalization depending on the desired purpose. For example, one can imagine using the controlled orientation interactions of anisotropic particles to form stable cell-biomaterial hybrids for cell-mediated drug delivery. Inspired by the use of chemically non-uniform Janus or patchy particles to control the local orientation of synthetic particles in colloid systems(25), we designed a tube-shaped, chemically non-uniform microparticle with the capability to control its orientation on cell surfaces. This advancement opens the possibility to design new cell-biomaterial hybrids for a variety of biomedical applications.
4. DEPTH PROFILING XPS ANALYSIS OF INTERLAYER DIFFUSION IN POLYELECTROLYTE MULTILAYERS
Reproduced with permission from Gilbert, J.B, Rubner, M.F, and Cohen, R.E. PNAS, 2013 110
6651-6656. Copyright 2013 National Academy of Sciences, USA.
4.1 Introduction
Layer-by-Layer assembly of polyelectrolyte multilayers (PEMs) allows for the precise deposition of ultrathin organic films that can conformally coat features of any shape and size. These films can incorporate a variety of species, leading to a wide range of applications including antifogging(26), anti-reflection(27), drug delivery(14, 23, 28-30), fuel cells(12) and responsive materials(31). Since the multilayer films are assembled through a sequential self-limiting adsorption process onto a substrate(13), a major advantage of the technique is the ability to constrain the location of certain materials within the film at the nanoscale by simply controlling the order of material deposition. Such nanoscale spatial control has allowed the creation of complex periodic heterostructures not easily realized by other deposition techniques(32). In some cases however, diffusion of the constituent macromolecular species in and out of the film may occur, changing the desired film stratification, composition, growth profile and properties(17). This type of diffusion, known as interlayer diffusion, is often detrimental to the desired properties but also could be an opportunity to impart new functions. Yet, interlayer diffusion has proven difficult to fully characterize and control and a more thorough understanding is needed.
Interlayer diffusion in PEM films can be detrimental if the desired stratified heterostructure is lost during the assembly process, a post-assembly treatment or in use. For example, in the cases of the sequential release of therapeutics(30), structural color(33), organic
LED devices(34), solar cells(35) and on-demand release of PEM films(23, 36), the loss of
stratification due to interlayer diffusion results in the loss of the desired function. However in other cases, such as surface planarization for the creation of higher efficiency dye-sensitized solar cells(35) or ordering of the internal or surface arrangement of PEM films(37, 38), interlayer diffusion can be harnessed to provide functional benefits. Interlayer diffusion can also be used to tune material properties such as the critical dissolution pH in hydrogen bonding systems through the addition of small amounts of electrostatic cross-links(36) or viscoelasticity through diffusion of stiffer polymer components(39). In all of these cases, interlayer diffusion must be understood and controlled.
Interlayer diffusion also affects the mechanism of PEM film growth. Some polymer systems show linear growth where the bilayer thickness is invariant with deposition cycles, while other systems show exponential growth with progressively increasing bilayer thicknesses(40). It is widely believed that exponential growth arises from rapid interlayer diffusion of polymers throughout the film during the fabrication steps(40, 41), however some disagree with this conclusion(42). Improved analysis techniques that provide spatial information about the location of specific molecules within a multilayer thin film are therefore clearly needed.
Due to the importance of understanding interlayer diffusion, a variety of techniques have been employed to analyze it with varying degrees of success. These techniques include confocal microscopy(43-45), fluorescence resonance energy transfer (FRET)(46, 47), FTIR(48), neutron reflectivity(49-5 1) and X-ray reflectometry(52). Confocal microscopy is limited in spatial
sensitivity since films much thicker than the typical PEM thickness (500 nanometers or less) are required due to a relatively low z-resolution(43-45). FRET is more sensitive but relies on fluorescent modification of polymers for indirect measurements of diffusion(46, 47). FTIR can provide valuable information on the exchange of polymers in solution with PEM film components, but commonly probes the full thickness of the film, limiting the ability to spatially resolve the effects of diffusion(48). Neutron reflectivity and x-ray reflectometry(49-52), require nuclear contrast and electron density contrast respectively in the film, and commonly require the use of special deuterated polymers. In comparison, x-ray photoelectron spectroscopy (XPS) is a
highly sensitive surface analysis method that probes the top 10 nm of a film. When combined
with sputtering or etching sources to slowly remove material between analysis cycles without damaging underlying material, depth profiling XPS enables high resolution chemical analysis of polymer films. The information provided by this technique could expand the understanding of how to control PEM structure, what compositional/structural changes occur with interlayer diffusion and when polymers in the film exchange with deposition/post-assembly solutions.
Development of less destructive sputtering or etching sources has been the enabling step in advancing polymer depth profiling capabilities. Many depth profiling techniques use single-atom sputtering sources like argon, applicable to inorganic materials but severely damaging to polymers(53-55). Only recently have cluster ion sources like C60+ been used in conjunction with XPS for analysis of polymer films with depth(53, 56, 57). Cluster ion C6o0 sputtering is much less damaging since the energy transfer from the ion to the material occurs primarily at the surface, minimizing the chemical damage deep into the film(58). Therefore most of the damaged material is removed from the surface, minimizing its interference with the proper analysis of the exposed surface (59).
One strategy in the fabrication of functional PEM films is the use of blocking layers to minimize interlayer diffusion. Earlier studies(30, 44, 60-62) have shown that the properties of a successful blocking layer depend on the diffusing species under consideration and the conditions of diffusion. Some have found that covalent cross-linking is the only way to stop interlayer diffusion of polymers(30, 63) while others have noted that electrostatic interactions can be utilized to stop interlayer diffusion (44, 64, 65). Of interest to this study is how blocking layers
enable the controlled production of free-floating PEM films by maintaining the desired dissolution properties of a sacrificial region that anchors a pH stable PEM film to a substrate surface. Once released, these free-floating assemblies have been used for tissue engineering(66) and drug delivery(23, 29).
In this paper we designed a model system that enables the study of common attributes of interlayer diffusion found in many PEM systems including blocking layer effectiveness. The sacrificial component of this model PEM system is a hydrogen bonded region (poly(acrylic acid)/poly(ethylene oxide)) that is insoluble at low pH but becomes soluble at a critical higher
pH. A pH stable PEM system based on chitosan and hyaluronic acid (HA) is assembled on top of
this sacrificial region with the goal of creating an on-demand pH triggered release of the chitosan/HA multilayer films. A related approach has previously been used by us to create cellular backpacks that attach to immune system cells via specific interactions between HA and CD-44 receptors on the cell surface(23). From these earlier studies, it became apparent that the assembly of chitosan/HA onto a hydrogen bonded region rendered the entire multilayer system insoluble under pH conditions that should dissolve the sacrificial region. Thus, this work seeks to determine if interlayer diffusion of chitosan/HA causes the changes in solubility and how suitable blocking layers can prevent these changes. From a fundamental perspective, this model
system allows the exploration of elements such as the competition between hydrogen bonding and electrostatic interactions in multilayers, the design of an effective blocking layer, the exchange of film components with a surrounding solution and the extent and kinetics of interlayer diffusion. Utilizing XPS depth profiling data acquired with C60+ cluster ion sputtering,
we find that chitosan diffuses effectively into the hydrogen bonded region of the multilayer film and displaces the hydrogen bonded component poly(ethylene oxide). In addition, we show that this interlayer diffusion process can be blocked completely with only a single adsorbed layer of a polycation.
4.2 Experimental Set-up
The model PEM films examined in this work were assembled on glass slides coated with an 80nm poly(diallyldimethylammonium chloride) (PDAC) and poly(styrene sulfonate) (SPS) adhesion promoting multilayer. Above this adhesion layer is a hydrogen bonded film comprised of poly(acrylic acid) (PAA) and poly(ethylene oxide) (PEO). The solubility of this hydrogen bonded PEM system is pH sensitive and above a pH of 3.6, it will dissolve in water(67). Figure 4-1 shows a cartoon representation of the multilayer heterostructures examined in this work along with the experimentally determined thicknesses of the various regions of the multilayer. In the top case (Figure 4-1A), the experiments involved immersing a hydrogen bonded multilayer film in a chitosan solution for varying amounts of time. In the bottom case (Figure 4-1B), blocking layers containing varying numbers of poly(allylamine hydrochloride) (PAH) and SPS layers were deposited on top of the hydrogen bonded region followed by the assembly of a hyaluronic acid (HA) and chitosan (CHI) multilayer.
A
Chitosan Diffusion Test ThicknessExposed to pH 3 CHI solution forX min-+
Hydrogen Bonded Region: (PAA3/PE03) -+ -475nm
Adhesion Layer: (PDAC4/SPS4) > ~80nm
B
Blocking Layer Test Thickness(HA3/CHI3)-+ ~20nm
Electrostatic Blocking Layer (PAH3/SPS3)-> 0-1 Onm
Hydrogen Bonded Region: (PAA3/PE3)-+ -300nm
Adhesion Layer (PDAC4/SPS4)-> ~80nm
Figure 4-1: Schematic of systems used to test (A) chitosan diffusion into the hydrogen bonded region and (B) electrostatic blocking layer effectiveness. The number after the polymer abbreviation is the deposition solution pH.
These stratified films were dried and then analyzed using depth profiling XPS paired with
C6o sputtering to collect CIs, Ols, N Is and Si2p high resolution spectra. It is important to note
that prolonged X-ray exposure and C6o0 sputtering can alter the chemical composition of PEMs and decrease the interface resolution (56, 68). As described in Fig. S1, the choice of XPS data
acquisition parameters and sputtering conditions is very important since long periods of X-ray exposure reduced the 0 to C ratio and in particular the signal of the carboxyl peak at -289eV(69). As a result we chose acquisition parameters and C60+ sputtering conditions to
minimize the total X-ray exposure time while still obtaining an acceptable resolution and signal to noise ratio at each point in the depth profile.
4.3 Diffusion of Chitosan in Hydrogen Bonded Multilayers
To explore the question of whether the adsorbed chitosan diffuses into the swollen hydrogen bonded region and by how much, the nitrogen signal from the amine on chitosan was analyzed as a function of depth for hydrogen bonded multilayers exposed to a 0.1% (w/v) chitosan solution at pH 3 for a specified amount of time. The chitosan solution acted as an infinite supply for diffusion of chitosan into the hydrogen bonded region. All samples were
rinsed with water for four minutes and dried with nitrogen gas prior to analysis. The compiled spectra for chitosan exposure times of 1, 3, 10 and 60 minutes (CHI 1, CH13, CHI 10 and CH160) are plotted in Figure 4-2A-D. Color was added to highlight the approximate locations of the distinct regions of the PEM film, using the same color scheme shown in Figure 4-IA. The depth of the (red) chitosan region was determined by analyzing the intensity of the N Is signal with depth. When the Ni s signal dropped to background levels the spectrum was colored yellow to denote the hydrogen bonded region. Finally, the (black) adhesion layer starts when the Nis signal increases at the base of the film due to the presence of nitrogen-containing PDAC.
A 3000 1minCHI B 3ooo 3min CHI
E 4 _ no CHI 20002000 3.5 - - 1in CH
m
3mm~ CHI S31 -lmin CHI 800 -00 60mmn CHI 400 404 402 400 3W6 400 4 402 25 Thickness above gas (nm) Binding Energy (*V) Thickness above glass (nm) Binding Energy (eV) 2C~~~~ 10min - CHI 3oo ao oi ~
C 3000 lommnCHI D 00i 8OinH
20W0 20001
8 . 0 . 1 820 0 402 400 00 400 200 0
ThFig ness ab gless (nm) na e y (*v) Thickness above glass (nm) Binding Enery (eV) Thickness above glass (nm)
Figure 4-2: Diffusion of chitosan into hydrogen bonded films. Spectra of hydrogen bonded
(PAA3/PEO3) films exposed to chitosan solution for different amounts of time. (A) 1 min exposure (B) 3 min exposure (C) 10 min exposure (D) 60 min exposure to chitosan. The color scheme is the same as that of Figure IA. Red spectra represent chitosan infused areas, yellow spectra represent the hydrogen bonded (PAA3/PEO3) area and black spectra represent the (PDAC4/SPS4) adhesion layer. (E) Quantification of A-D to determine the atomic concentration of nitrogen with depth in the film. Data points are individual dots and line shown is the result of a Savitzky-Golay five point quadratic algorithm.
The spectra from Figure 4-2 were analyzed to determine the atomic percentage of nitrogen with depth as seen in Figure 4-2E. A film not exposed to chitosan is shown in Figure 4-7. The concentration of nitrogen in the multilayer film increased systematically with time of exposure to the chitosan solution. Also, the maximum depth at which an appreciable nitrogen
signal was observed increased with time. Separate experiments showed that the PDAC from the adhesion layers does not enter the hydrogen bonded region during the assembly process even after many hours at pH 3 (Figure 4-7). Thus, the only source of nitrogen in the film, above the 80nm adhesion layer, is from the chitosan that diffused from the top of the hydrogen bonded region. For the samples CHI 1, CHI3, and CHI 10 the location of the diffusion front, (where NI s concentration is 50% of the maximum value), advanced 181, 238 and 299 nm respectively as measured in dry films. Since the final dry thickness remained relatively constant, independent of chitosan diffusion depth, the diffusion of chitosan does not greatly expand or collapse the film. As a result, the dry diffusion distance of chitosan directly correlates with the thickness of the portion of the (PAA3/PEO3) film that was altered by chitosan diffusion. Therefore, to estimate the diffusion coefficient, the chitosan penetration distances were multiplied by a factor of 2.5 to account for the 250% swelling of the (PAA3/PEO3) film in pH 3 water (Table 4-1 and Table 4-4). After 60 minutes in the chitosan solution (CHI60), the chitosan has diffused through the entire hydrogen bonded region as seen by the uniformly high nitrogen content throughout the film in Figure 4-2E. These results clearly show that the adsorbed chitosan diffuses into the hydrogen bonded region. Chitosan is known to be highly diffusive due to a lower charge density than typical polyamines like PAH and the presence of multiple hydrogen bonding acceptors(45, 46).
Table 4-1: Diffusion of Chitosan in a Swollen Hydrogen Bonded Film
Dry film Swollen film 2
Sample t (sec) distance (nm) distance (nm) D (cm /sec)
CHI 1 min 360 181 452 1.42E-12
CHI 3 min 720 238 594 1.23E-12
CHI 10 min 900 299 748 1.56E-12
Dry distance multiplied by 2.5 to account for 250% film swelling at pH 3
To estimate the diffusion coefficient of chitosan into the hydrogen bonded region we used the data in Table 4-1 and the characteristic diffusion length, L= 4L (70). As seen in
Table 4-1 the calculated diffusion coefficient is consistent for the three time points sampled and is -1.4* 1012 cm2/sec. Recent reports on interlayer diffusion coefficients in polyelectrolyte
multilayers range from 1020 cm2/sec for SPS in linearly growing (PAH/SPS) films(49) to 10-7
cm2/sec for poly(L-lysine) in exponentially growing poly(L-lysine)/hyaluronic acid films(40).
This wide range of reported interlayer diffusion coefficients is due to a fundamental difference in the film growth mechanism between linearly and exponentially growing films. In linear growth conditions, the deposited polymers generally interact only with the top surface and thus generally have interlayer diffusion coefficients below 10-' 7 cm2/sec(49-5 1). In comparison, exponentially
growing systems require some amount of interlayer diffusion to occur during the dipping cycle(40) and as a result have higher reported interlayer diffusion coefficients in the range of 10
16 Cm2/sec to 10-7 Cm 2/sec depending on the conditions and polyelectrolytes used(40, 46). A
recent paper by Lundin et al. (46) used fluorescence resonance energy transfer (FRET) and showed that the interlayer diffusion of chitosan in exponentially growing films made of chitosan and heparin was ~10~" cm2/sec for 150kDa chitosan. Our reported interlayer diffusion