Publisher’s version / Version de l'éditeur:
Journal of ASTM International, 6, 9, pp. 1-43, 2009-10-01
READ THESE TERMS AND CONDITIONS CAREFULLY BEFORE USING THIS WEBSITE. https://nrc-publications.canada.ca/eng/copyright
Vous avez des questions? Nous pouvons vous aider. Pour communiquer directement avec un auteur, consultez la
première page de la revue dans laquelle son article a été publié afin de trouver ses coordonnées. Si vous n’arrivez pas à les repérer, communiquez avec nous à PublicationsArchive-ArchivesPublications@nrc-cnrc.gc.ca.
Questions? Contact the NRC Publications Archive team at
PublicationsArchive-ArchivesPublications@nrc-cnrc.gc.ca. If you wish to email the authors directly, please see the first page of the publication for their contact information.
NRC Publications Archive
Archives des publications du CNRC
This publication could be one of several versions: author’s original, accepted manuscript or the publisher’s version. / La version de cette publication peut être l’une des suivantes : la version prépublication de l’auteur, la version acceptée du manuscrit ou la version de l’éditeur.
For the publisher’s version, please access the DOI link below./ Pour consulter la version de l’éditeur, utilisez le lien DOI ci-dessous.
https://doi.org/10.1520/JAI101270
Access and use of this website and the material on it are subject to the Terms and Conditions set forth at
Assessing the effectiveness of wall-window interface details to manage
rainwater - selected results from window installation to a wall sheathed
in extruded polystyrene
Lacasse, M. A.; Manning, M. M.; Ganapathy, G.; Rousseau, M. Z.; Cornick,
S. M.; Bibee, D.; Shuler, D.; Hoffee, A.
https://publications-cnrc.canada.ca/fra/droits
L’accès à ce site Web et l’utilisation de son contenu sont assujettis aux conditions présentées dans le site LISEZ CES CONDITIONS ATTENTIVEMENT AVANT D’UTILISER CE SITE WEB.
NRC Publications Record / Notice d'Archives des publications de CNRC:
https://nrc-publications.canada.ca/eng/view/object/?id=c966d7b0-b7f3-46d4-8f9e-30e116a2b853 https://publications-cnrc.canada.ca/fra/voir/objet/?id=c966d7b0-b7f3-46d4-8f9e-30e116a2b853http://www.nrc-cnrc.gc.ca/irc
Asse ssing t he e ffe c t ive ne ss of w a ll-w indow int e rfa c e de t a ils t o
m a na ge ra inw a t e r - se le c t e d re sult s from w indow inst a lla t ion t o a
w a ll she a t he d in e x t rude d polyst yre ne
N R C C - 5 0 0 3 1
L a c a s s e , M . A . ; M a n n i n g , M . M . ; G a n a p a t h y , G . ;
R o u s s e a u , M . Z . ; C o r n i c k , S . M . ; B i b e e , D . ;
S h u l e r , D . ; H o f f e e , A .
F e b r u a r y 2 0 1 0
A version of this document is published in / Une version de ce document se trouve dans:
Journal of ASTM International, 6, (9), pp. 1-43, October 01, 2009, DOI:
10.1520/JAI101270
The material in this document is covered by the provisions of the Copyright Act, by Canadian laws, policies, regulations and international agreements. Such provisions serve to identify the information source and, in specific instances, to prohibit reproduction of materials without written permission. For more information visit http://laws.justice.gc.ca/en/showtdm/cs/C-42
Les renseignements dans ce document sont protégés par la Loi sur le droit d'auteur, par les lois, les politiques et les règlements du Canada et des accords internationaux. Ces dispositions permettent d'identifier la source de l'information et, dans certains cas, d'interdire la copie de documents sans permission écrite. Pour obtenir de plus amples renseignements : http://lois.justice.gc.ca/fr/showtdm/cs/C-42
M. A. Lacasse1, M. Manning1, G. Ganapathy1,M. Rousseau1, S. M. Cornick, D. Bibee2, D. Shuler3 and A. Hoffee4
Assessing the Effectiveness of Wall-Window Interface Details to Manage Rainwater - Selected Results from Window Installation to a Wall Sheathed in Extruded Polystyrene
REFERENCE: M. A. Lacasse, M. Manning, G. Ganapathy,M. Rousseau, S. M. Cornick, D. Bibee, D. Shuler, A. Hoffee, “Assessing the Effectiveness of Wall-Window Interface Details to Manage Rainwater - Selected Results
from Window Installation to a Wall Sheathed in Extruded Polystyrene, Up Against the Wall - An Examination of
Building Envelope Interface Techniques and Systems: Journal of ASTM International (JAI) Vol. 6 No.
ABSTRACT: The detailing of wall-window interfaces and the consequences of defective installation of windows is an on-going concern in North America. This manuscript concerns laboratory evaluation of the water leakage performance of a select set of window-wall interface details. The details were for windows with mounting flanges installed in wood-frame walls sheathed with rigid extruded polystyrene foam. The tests were performed on a single full scale test assembly in which two identical windows were installed by two similar but nonetheless different means. Each detail included a sill pan intended to collect water that gained entry into the assembly and thus was designed to be robust (tolerant of flaws). Tests were performed over a series of different water loading (spray) rates, and over a series of different air pressure differentials at each spray rate. Air leakage rates through the window opening were monitored; they were controlled by a unique methodology. Leakage paths were introduced in the window frames and these paths were alternatively blocked or opened to permit evaluation of the performance of the installation details under two different assumed conditions of window leakage. Air pressure distribution within the assemblies was monitored during spray testing. The wall assembly were designed to permit observation of water entry in it, and to allow measurement of water entry to, or drainage from, various locations within the assembly. Results on water entry and management for the two wall-window interface configurations are given and effectiveness of the details is discussed.
KEYWORDS: laboratory tests, rainwater intrusion, wall-window interface, watertightness, window installation details, wind-driven rain, extruded polystyrene foam sheathing, flashing
1
National Research Council Canada, Institute for Research in Construction, 1200 Montreal Road, Building M-20, Ottawa, ON, K1A 0R6 Canada
2
The Dow Chemical Company, 2878 Canyon Road, Granville, OH, 43023 3
Owens Corning, One Owens Corning Parkway, Toledo, OH 43659 4
Introduction
The control of rain penetration is evidently a key functional requirement for exterior walls. Lack of attention to either the selection of wall components or to their installation and detailing may result in the premature
deterioration of wall elements. Deficient installation and detailing of windows has accounted for a significant number of premature failures of building envelopes in recent years [1, 2, 3, 4]. A survey of building envelope failures in the coastal region of British Columbia indicated that 25% of the moisture problems associated with water ingress into wall assemblies were directly attributed to penetration through the windows or the window-wall interface [1]. The issue of building envelope failure associated with deficient installation of windows is not limited to coastal climates
For example, numerous recent failures of newly-constructed building envelopes have occurred in the state of Minnesota [3]. The building inspection division of the town of Woodbury has reported that an appreciable number of homes built since 1990 have experienced major durability problems. Specifically, 276 of 670 stucco homes built in Woodbury in 1999 (ca. 41%) experienced severe within-wall damage within six years. The primary causes for failure were window leaks, lack of kickout flashing at eave ends of roof-to-wall junctures, and improper deck flashing [3]. Cautley [5 ] also found that water intrusion associated with windows can occur in contemporary residential buildings in an upper Midwestern state. Cautley’s study involved instrumentation of walls in a newly-constructed home in Wisconsin. The instrumentation detected several episodes of wetting of wall framing below windows, each of which was preceded by a rainstorm.
The state of California has taken interest in understanding the level of risk associated with different window installation methods and has recently sponsored a test program to evaluate the performance of different window installation details [4].
Clearly the problem of water penetration at window openings persists and not only in coastal areas for which the perception is that climate loads are severe. Although coastal climates may indeed be severe, details that promote the entrapment of water and that are not fault tolerant are likewise susceptible to premature deterioration, even in areas of apparently reduced “climate loads”. Carll [6] makes the point regarding the need for additional information related to moisture loads on buildings and the need to characterize the degree of water entry in relation to such loads.
Two studies that addressed the watertightness of windows and the wall-window interface were conducted by Ricketts [7, 8] on behalf of the Canada Mortgage and Housing Corporation. A wide range of factors was found to contribute to water leakage, but the principal paths for leakage were those associated with the wall-window interface. The two principal paths were: (1) through the window assembly (extending into the adjacent wall
assembly), and (2) through the window to wall interface (extending into the adjacent wall assembly). The investigator found that for the most part, the criteria for water penetration control cited in standard specification CSA A440 [9] do not address leakage associated with these two paths. The CSA standard concerns selection of window units, and does not address installed performance; it does not require testing of installed assemblies. Finally, it was noted that the specification [9] does not consider local exposure conditions as would be affected by local topography or by building features such as overhang protection.
There is widespread interest in obtaining a better understanding of the comportment of different window installation methods over a range of climate loads. To this end, laboratory investigations have been undertaken by the Institute for Research in Construction (IRC) to evaluate different wall-window interface details and their ability to manage rainwater entry. The investigations have focused on assessing the robustness of specified window installation details. They have addressed what occurs for example, when sealant (“caulking”) joints around window perimeters fail, or when window units develop leaks. T hey have also addressed the influence of airtightness of installations on their resistance to water leakage Results of IRC studies relating to window installation practice in Canada are reported National Research Council of Canada (NRCC) publications [10, 11]. Results relating to installation practice in the United States are reported in the Journal of ASTM International [12].
This paper concerns laboratory evaluation of the watertightness of a select set of wall-window interface details. The details are for windows with mounting flanges installed in wood-frame walls sheathed with rigid extruded polystyrene (XPS) foam. The use of XPS sheathing in low-rise wood-frame homes typically results in lesser energy expenditure for space conditioning [13, 14]. XPS sheathing can shed water, and is not prone to deterioration due to moisture uptake1. These characteristics can allow XPS to be used as a wall’s concealed water-resistive barrier (WRB).
Window installation details for flanged windows installed in walls with XPS sheathing have been suggested in the EEBA Water Management Guide [15]. Some of the details described in the Guide may not however be practical to implement, and the Guide does not indicate whether the details it suggests have been evaluated by testing.
A set of two wall-window interface details, and variations on their implementation were evaluated in the investigation reported in this paper. The details were for fixed polyvinyl chloride (PVC) windows incorporating mounting flanges. Results on water entry for the different wall-window interface configurations are given and the effectiveness of different details is discussed. Insights into the relative importance in respect to watertightness afforded the different components incorporated in the various installation methods are provided.
1
Experimental Approach to Evaluating Water Management of Window Interface Details
Although watertightness studies undertaken in the laboratory do not directly relate to expected long-term performance, the laboratory tests can identify the response of wall assemblies to specific exposures that simulate rain events. Laboratory exposures can be selected to simulate the most extreme storm at a specified locale that would be expected to occur over a specified recurrence period. In this way, establishing the response of wall assemblies to simulated events is an indirect means of determining the likely risk of water entry over a given period for a specific climate region. Laboratory testing may also provide a measure of the expected risk of water entry associated with different installations methods, and their relative fault tolerances [16, 17].
The test program described in this manuscript followed that used in previous studies [10, 11, 12]; the ability of different wall-window installation details to manage rainwater was determined on the basis of watertightness tests and the response of the respective interface details to simulated conditions of wind-driven rain.
Description of Test Apparatus
The Dynamic Wind and Wall Test Facility (DWTF), used to subject similar specimens to simulated wind-driven rain conditions in previous studies [10, 11, 12, 16] was used in this investigation. The facility is capable of subjecting full-scale test specimens (nominal size 2.44 by 2.44-m) to static levels of air pressure differential or to air pressure differentials that fluctuate dynamically; the dynamic pressure fluctuation capabilities of the facility were not however used in this investigation. The facility provides a means to assess the air leakage characteristics of test specimens; this capability was utilized in this investigation. The apparatus contains a pressure regulated water spray system that simulates the action of rain deposition on the cladding surface. Water can be applied at a specified rate to the front face of the specimen through an array of spray nozzles.
Summary of Test Protocol
The test protocol was adapted from previous work [16], and a review of wind-driven rain loads as might be experienced across Canada [18]. The protocol was patterned in part on existing North American water penetration standard test methods such as ASTM E331 [19]. The protocol consisted of three (3) stages:
Stage 1: The air leakage characteristics of the wall assembly were determined at this stage, as was pressure distribution across the wall assembly. In this investigation, the air leakage characteristics of the
test wall sections were adjusted by the method described in Lacasse et al. [20] to have nominal air leakage rates of 0.3 or 0.8 L/(s-m2) at 75 Pa air pressure differential across the test specimen. As described in Lacasse et al. [20] the adjustment was made by either plugging or unplugging holes in a rigid acrylic sheet situated as an interior rebate return on the interior surface of the test specimen. The number of holes and their arrangement was determined during this air leakage
characterization stage and a sufficient number to yield the 0.3 L/(s-m2) or the 0.8 L/(s-m2) value at 75 Pa as required in the test protocol.
Stage 2: Water spray testing was conducted at this stage, and at this stage test specimens did not contain any known deficiencies through which water entry might be anticipated. Testing was performed over a series of spray rates, and over a series of differential pressures at each spray rate. The series of spray rates were 0.8, 1.6 and 3.4 L/(min.-m2), and differential pressure at each spray rate ranged from 0 to 700 Pa. Testing over the full series of spray rates was conducted with the specimen adjusted to the condition that corresponded with the 0.3 L/(s-m2) air leakage condition. The specimen was then adjusted to the 0.8 L/(s-m2) air leakage condition and re-tested over the full series of spray rates.
Stage 3: Water spray testing was again conducted at this stage, but this time with known deficiencies in the specimen through which water entry was expected. Testing was performed over the same series of spray rates and differential pressures as in Stage 2, with the specimen adjusted to each of the air leakage conditions described above.
The objective of first test stage of the protocol was to assure that spray tests on different specimens would nominally be conducted at or near the same air leakage rate. As indicated previously, information was also gathered at this stage on the pressure distribution across the wall, in particular in locations at or near water collection points. This identified the approximate air pressure differential across different elements in the wall when the wall was subsequently exposed to water spray. The desired nominal leakage through the ABS was achieved (as indicated previously by the method described by Lacasse et al. [20])
The water penetration tests conducted during Stage 2 were to simulate an installation, carefully assembled from components without flaws under favorable working conditions, and in “new” condition. The ability of the wall-window interface details to manage water given a deficiency along one of the interfaces was assessed in
Stage 3. Deficiencies, purposely introduced in the specimens consisted of small openings that perforated the window frame at the lower corners of the window. Such deficiencies might simulate the failure of corner joints brought about by the effects of aging or the imperfect jointing that is apparent in certain windows. In this situation, the sensitivity of water penetration through relatively larger deficiencies to the rate of water impinging on the façade can be evaluated. Deficiencies introduced in the first line of defense against water entry provide a path for water entry behind the face of the window. This, in turn, permits evaluating the ability of the wall-window interface detail to collect and evacuate water to the exterior of the assembly. Such an approach may also permit replicating
inadequate construction installation and helps determine the fault tolerance of the installation detail with respect to water management.
Specimens were thus subjected to simulated wind-driven rain conditions for specified periods of time; these conditions replicated the main features of rain events. Rates of water drainage from the sill area of the rough opening and from behind the cladding (at the base of the wall) were determined by measuring the rate of water collected from these locations. The test protocol permitted comparisons of water entry results among the different wall-window interface details with regard to water entry and with regard to how that water was managed.
Generic Description of Test Specimen
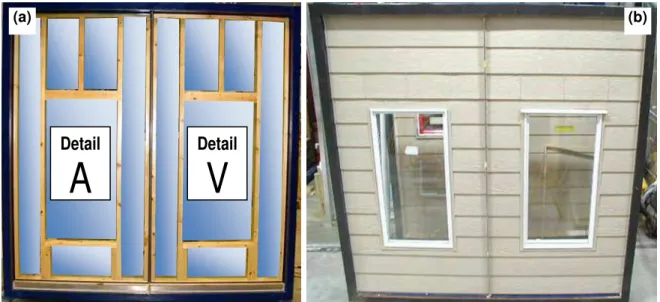
Test specimens were of 2.44-m by 2.44-m (8-ft. by 8-ft.) dimension. A test specimen contained two windows, each measuring 600 mm by 1200 mm window (nominal size: 2-ft. by 4-ft.), installed in an opening measuring 625-mm by 1250-mm (Figure 1). Installation details for the window on the left side of a test specimen differed in one regard from the installation details for the window on the right side of the specimen. Entry of water around either window opening was collected in troughs located beneath the respective sill areas of the openings. Water was also collected at the base of the wall behind the cladding. The window-wall combinations evaluated were determined by the interests of an industry group. Additional details regarding the test specimen configuration are provided below.
A number of different wall assemblies were evaluated; these varied in a number of different ways. For brevity, one type of wall assembly is however described here. The wall assembly was intended to be representative of low-rise residential construction except that clear acrylic sheet was used in lieu of interior gypsum wallboard. Each specimen consisted of: 38 by 138 mm (nominal 2-in. by 4-in) wood studs, transparent acrylic sheet attached to the inside of the wood frame, (serving as the principal element of the air barrier system) XPS foam installed on the
exterior of the wood frame (serving as a sheathing board and a water-resistive barrier), and horizontal lap hardboard siding installed directly over the XPS sheathing (not on furring strips). The clear acrylic sheet used in lieu of gypsum wallboard allowed observation of water penetration into the rough opening or into stud cavities. The expectation was that the location and timing of water ingress could readily be observed using this technique.
Figure 1 — (a) schematic of front elevation of 2.44-m by 2.44-m (8-ft. by 8-ft.) specimen showing location of 600 mm by 1200 mm (2-ft. by 4-ft.) windows and adjacent wood framing studs. Detail “A” might be representative of
installation details used in current practice whereas detail “V” a variation on that practice; (b) photo of a completed specimen clad with hardboard siding
Wall-Window Details for Test Specimen
Test results for a selected test specimen, designated specimen W3, are discussed in this manuscript. Each of the windows in this specimen were installed in an opening that included a sloped-sill pan flashing nominally capable of drainage. The basic issue under investigation in this specimen was the influence of incorporating a
non-hardening sealant behind the mounting flanges at the head and jambs of the window. Hence the window on the “B-side” (base-case side) of the specimen was installed with sealant applied behind the head and jamb flanges, whereas the window on the “V-side” (variation case side) did not have sealant behind its flanges.
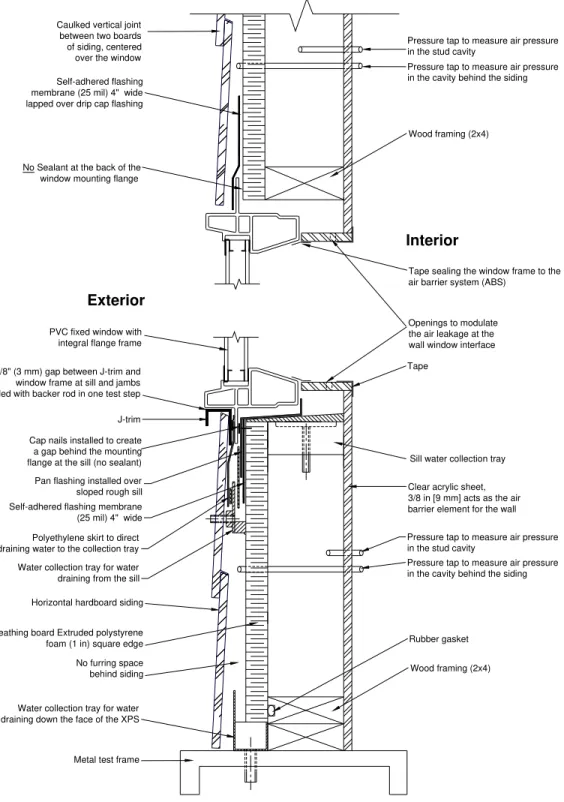
A summary of the construction details for both sides of specimen W3 is presented in Table 1. A vertical sectional view of the V-side of the specimen (without sealant behind flange) is given in Figure 2. Horizontal sectional views of the B- and V-sides are provided in Figure 3 and Figure 4 respectively. Of note is that no sheathing membrane is used in either assembly; the 25-mm (1-in.) thick XPS foam board acts as the water-resistive barrier (WRB). (b) (a)
Detail
Detail
V
A
Of interest as well, is the use of cap nails, as can be seen in Figure 2, to create a gap behind the window mounting flange along the sill such that drainage from the sloped sill can readily be accommodated. Also, no sealant was applied at this location. Following installation of the window, a self-adhered, 200-mm (4-in.) wide flashing membrane was used to seal the fastener heads and flange ends at the head and along the jambs.
Table 1
–
Summary of construction details for specimen W3Item
V-side
Without sealant
B-side
With sealant
Interior surface Acrylic sheet Same
Framing 2 by 4 in. wood studs Same
Insulation in stud cavity None Same
Sheathing board 1-in. (25 mm) XPS Foam Same
Sheathing membrane None Same
Window Fixed solid PVC windows, with integral flange; 600 mm by 1200 mm (2 ft wide X 4 ft high)CSA ratings: Air leakage: 0.25 m3/h-m; Water resistance: B7; Wind load resistance: C4
Same
Siding Horizontal hardboard siding installed directly over the XPS sheathing and terminated at the window sill and jambs with J-channel trim; no trim used at head .
Same
Wall/window Interface:
Window anchoring XPS foam sheathing extended under the flange, up to the framing around the window, and fasteners were placed through the foam into the framing
Same
Sill of R.O. Sloped (by placing a tapered piece of wood over the rough sill)
Same
Protective treatment of R.O. frame
Drained pan flashing placed over the sloped sill
surface. Pan flashing sealed to the rough jambs Same
Joint between window frame and cladding system
3-mm (1/8”) gap between J-trim and perimeter of window frame, without use of backer rod or sealant;
Test Trial Set 2: rubber gasket introduced in this joint for test trials.
Same
Joint between the window flange and the backup wall
As per ASTM E2112 method A-1: 200-mm (4 in.) self-adhered flashing membrane sealed to outside face of window flange at jambs and head, and on face of XPS at sill; Without sealant applied to back of window flange
Same except:
Sealant applied to back of window flange at head and jambs (sill left open for drainage)
Joint between window frame and rough opening
Test Trial Set 3: Spray-in-place polyurethane foam applied, from the interior along head and jambs. This changed the air leakage characteristics of the assembly, making the assembly essentially airtight around the window perimeter
Same
Joint between window frame and interior layers
Construction tape and/or sealant joins window frame to interior sheet of acrylic, creating plane of airtightness
Same
Pressure tap to measure air pressure in the stud cavity
Pressure tap to measure air pressure in the cavity behind the siding
Tape sealing the window frame to the air barrier system (ABS)
Wood framing (2x4)
Interior
Exterior
Self-adhered flashing membrane (25 mil) 4" wide lapped over drip cap flashing Caulked vertical joint between two boards of siding, centered
over the window
No Sealant at the back of the window mounting flange
1/8" (3 mm) gap between J-trim and window frame at sill and jambs filled with backer rod in one test step
Self-adhered flashing membrane (25 mil) 4" wide Pan flashing installed over sloped rough sill Cap nails installed to create a gap behind the mounting flange at the sill (no sealant)
No furring space behind siding Sheathing board Extruded polystyrene foam (1 in) square edge Horizontal hardboard siding J-trim PVC fixed window with
integral flange frame
Tape
Sill water collection tray
Pressure tap to measure air pressure in the cavity behind the siding Pressure tap to measure air pressure in the stud cavity
Clear acrylic sheet, 3/8 in [9 mm] acts as the air barrier element for the wall Openings to modulate the air leakage at the wall window interface
Water collection tray for water draining from the sill Polyethylene skirt to direct draining water to the collection tray
Water collection tray for water draining down the face of the XPS
Metal test frame
Wood framing (2x4) Rubber gasket
Figure 2 – Schematic drawing of XPSA W3 V-side Vertical Wall Section: without sealant behind the window flange; Note that the drawings are not accurate to the point of providing in depth details of the components; i.e. the size and
spacing between components may have been modified to better depict individual items; e.g. the thickness and configuration of the siding edges have been modified as its location in relation to the WRB.
Figure 3- XPSA W3 B-side Horizontal Wall Section, with sealant behind the window flange Wood framing (2x4)
Interior
Exterior
Horizontal hardboard siding Sheathing board extruded polystyrene foam (1 in)Pressure tap to measure air pressure in the stud cavity
Pressure tap to measure air pressure in the cavity behind the siding
3/8 in [9 mm] clear acrylic sheating acting as the air barrier system (ABS) Openings to modulate
the air leakage at the wall window interface
J-trim Self-adhered flashing membrane (25 mil) 4" wide
1/8" (3 mm) gap between J-trim and window frame at sill and jambs
Sealant at the back of the window mounting flange at head and jambs
Figure 4 - XPSA W3 V-side Horizontal Wall Section, without sealant behind window flange Wood framing (2x4)
Interior
Exterior
Horizontal hardboard siding Sheathing board extruded polystyrene foam (1 in)Pressure tap to measure air pressure in the stud cavity
Pressure tap to measure air pressure in the cavity behind the siding
3/8 in [9 mm] clear acrylic sheating acting as the air barrier system (ABS) Openings to modulate
the air leakage at the wall window interface
J-trim
Self-adhered flashing membrane (25 mil) 4" wide
1/8" (3 mm) gap between J-trim and window frame at sill and jambs
No Sealant at the back of the window mounting flange at head and jambs
Description of Test Trials and Deficiencies Incorporated in Cladding
Four (4) sets of test trials were undertaken as follows: Trial 1: Specimen nominally in “as is” condition;
Trial 2: With a rubber gasket inserted at the head and jambs at the cladding to window frame interface; Trial 3: With gasket from trial 2 removed and an interior air seal, consisting of spray polyurethane foam,
at the interface between the rough opening and the interior edges of the window frame;
Trial 4: With foam interior air seal (as in Trial 3) and with drip cap flashing added at the head of the window.
A schematic representation of each of the four test trials is given in Figure 5. All four sets of trials also included tests undertaken with deficiencies incorporated at the lower corners of the windows as shown in Figure 5b. These deficiencies were approximately 1 mm (0.039 in.) in diameter and were sealed with a sealing compound for those test sequences in which no deficiencies were being tested.
As well, tests were conducted at two nominal ABS leakage rates, of 0.3 and 0.8 L/(s-m2) respectively (referred to as the 03 ABS and the 08 ABS condition respectively), as previously described in the test protocol. Finally, tests were also conducted at three (3) different spray rates (0.8, 1.6, 3.4 L/(min.-m2), the highest spray rate being the default rate specified in ASTM E331. For each test sequence, at a given water spray rate and ABS leakage, results were obtained at pressures varying between 0 and 700 Pa (2.81-in. of water; 14.6 psf).
Figure 5 — (a) Set of four (4) pictorial representations of test trials (T1 to T4) showing front elevation (cladding exterior) of 2.44-m by 2.44-m specimen (8-ft. by 8-ft.) for T1, T2 and T4 and specimen interior of T3. Location of deficiencies at corners of windows are given on respective exterior elevations; (T1) test trial 1 – test as is; (T2) Test trial 2 – shows location of rubber gasket; (T3) Test trial 3 – shows location of spray in place foam; (T4) Test trial 4 – shows location of drip cap flashing (b) ca. 1-mm diam. (0.039-in.) deficiency at lower corner of window.
(b)
Deficiency at window corners Deficiency at window corners Rubber “gasket” along
wall-window interface
Spray in place foam along head and jambs
Drip-cap head flashing
Deficiency at window corners
(a)
T 1 T 2
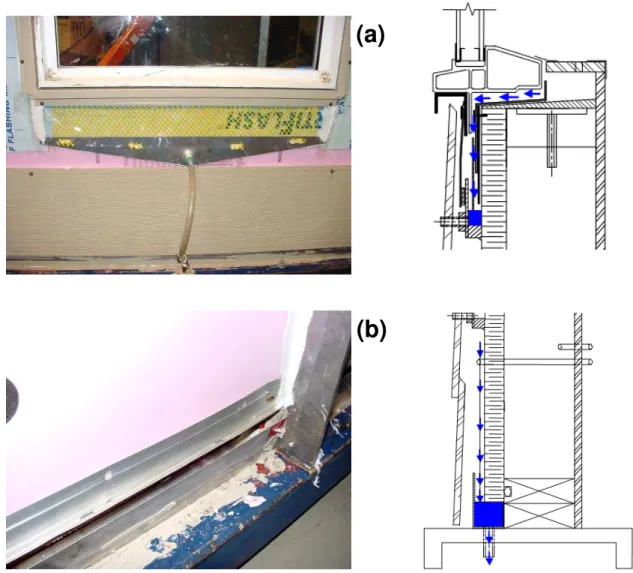
Water collection troughs—Two (2) sets of water collection troughs were used to obtain a measure of water entry
behind the cladding and in the sub-sill area: (i) water accumulating in and drained from the sill could be collected in a trough as shown in Figure 6a; (ii) Collection trough at the base of the wall as shown in Figure 6b. The intent of the placing a collection trough at the base of the wall was to collect water that may have passed the cladding and found its way to the WRB and thereafter the base of the wall. Nominally, this permitted quantifying the amount and rate of water entry along these different paths and differentiating the significance between these paths given different test conditions.
(a)
(b)
Figure 6 — Photos and related pictorials of collection troughs (a) trough for collection of water that drains from sill (b) trough for collection of water behind cladding at base of wall.
Selected Results
A selected set of results from each of the four (4) test trials are provided. The results are reported in terms of collection rates in the different troughs in relation to the pressure differential across the specimen for specified test conditions prescribed for each test sequence. Water spray was deposited over the wall cladding at the three prescribed rates as provided in the test protocol and description of test trials; for each of these spray rates pressure was applied to the exterior of the wall at seven different levels: 0, 75, 100, 200, 300, 500, and 700 Pa. Specimens in a pristine condition are first tested and thereafter, deficiencies are introduced in the wall, as previously described, and the series of tests repeated for each deficiency and at two different levels of nominal air barrier system (ABS) leakage (i.e. 0.3 L/(s-m2); 0.8 L/(s-m2)).
Results for Test Trial Set TI
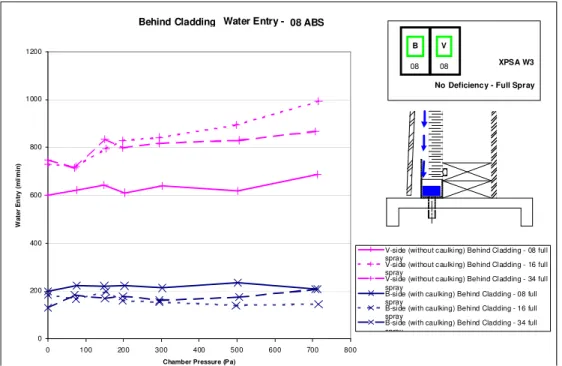
Collection of water behind cladding—Significant quantities of water evidently passed behind the cladding
during this trial (when there were open joints between the cladding system and the window). Significantly greater rates of water collection are observed at the base of the wall than at the trough that collected water from the sill pan. Figure 7, indicates that water collection rates ranged from 170 ml/min to 1000 ml/min; these rates were higher than collection rates from the trough that collected water from the sill pan, even under the most extreme conditions and when defects were introduced into the window frames that resulted in water penetration through them.
Water Entry - 0 200 400 600 800 1000 1200 W a ter E n tr y (ml /mi n )
Figure 7 – Water collection rates at base of wall (behind cladding), Trial T1 - No Deficiency; 08 ABS
0 100 200 300 400 500 600 700 800
Chamber Pressure (P a)
V-side (without c aulking) Behind Cladding - 08 full spray
V-side (without c aulking) Behind Cladding - 16 full spray
V-side (without c aulking) Behind Cladding - 34 full spray
B-side (with caulking) Behind Cladding - 08 full spray
B-side (with caulking) Behind Cladding - 16 full spray
B-side (with caulking) Behind Cladding - 34 full spray
Behind Cladding 08 ABS
No Deficiency - Full Spray XPSA W3
B V
08 08
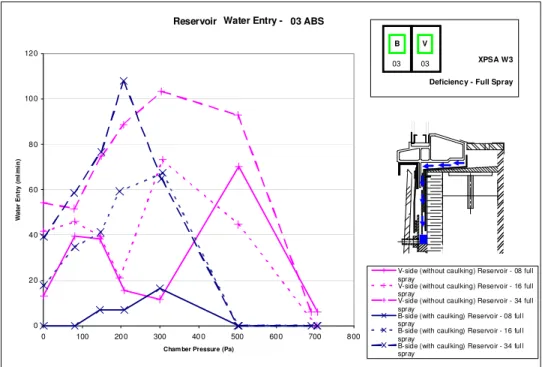
Drainage from the sill pan - no deficiencies—Smaller rates of water collection (<20 ml/min) were evident for
the trough accommodating drainage from the sill pan as compared to rates obtained at the base of the wall behind the cladding (Fig. 8 – No deficiency; 03 ABS). Rates of drainage from the sill pan on the B-side (with sealant behind flanges) were greater than of the V-side (without sealant). This was the case, even when the installations were adjusted to the relatively restrictive air leakage condition (03 ABS) and when no differential air pressure was exerted across the specimen (0 Pa). At the less restrictive air leakage condition (Fig. 9 – No deficiency; 08 ABS), both sides showed small increases in rates of collection of water draining from the sill pan (<20 ml/min).
Figure 8 - Water collection rates from sill pan, Trial T1 - No Deficiency, 03 ABS Water Entry - 0 20 40 60 80 100 120 0 100 200 300 400 500 600 700 800
Cham ber Pressure (Pa)
W a ter En tr y (ml /mi n )
V-side (without caulking) Reservoir - 08 full spray
V-side (without caulking) Reservoir - 16 full spray
V-side (without caulking) Reservoir - 34 full spray
B-side (with caulking) Reservoir - 08 full spray
B-side (with caulking) Reservoir - 16 full spray
B-side (with caulking) Reservoir - 34 full spray
Reservoir 03 ABS
N o Deficiency - Full Spray XPSA W3
B V
03 03
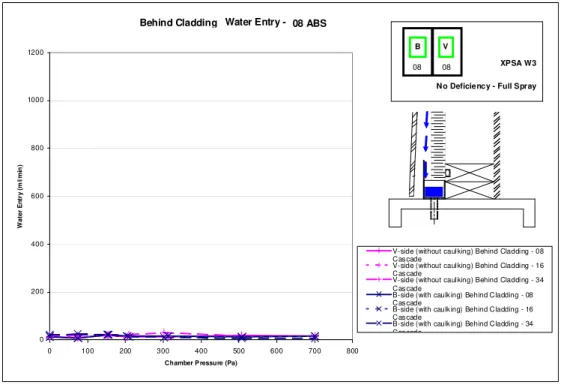
Figure 9 - Water collection rates from sill pan, Trial T1 - No Deficiency, 08 ABS
Water Entry - 0 20 40 60 80 100 120 0 100 200 300 400 500 600 700 800
Cham ber Pressure (Pa)
W a ter En tr y (ml /mi n )
V-side (without caulking) Reservoir - 08 full spray
V-side (without caulking) Reservoir - 16 full spray
V-side (without caulking) Reservoir - 34 full spray
B-side (with caulking) Reservoir - 08 full spray
B-side (with caulking) Reservoir - 16 full spray
B-side (with caulking) Reservoir - 34 full spray
Reservoir 08 ABS
N o Deficiency - Full Spray XPSA W3
B V
Water leakage at the window head on the V-side of the specimen (no sealant behind jamb or head flanges) was observed at 700 Pa air pressure level at any of the three spray rates (0.8, 1.6 and 3.4 L/(min.-m2)).
Drainage from the sill pan - with deficiencies—Higher drainage rates were recorded on both the B-side (with
sealant) and V-side (without sealant) of the specimen at pressure differentials up to the 300 Pa as compared to the drainage rates recorded from test sequences with no deficiency (Figure 10 and Figure 11). This was the case regardless of the condition of the ABS. At the 500 Pa pressure level, drainage on the B-side (with sealant) was arrested and water began to accumulate in the sill pan, whereas drainage on the V-side (without sealant) drainage form the sill pan continued, although in some tests the drainage rate was reduced as compared to the rates obtained at lower pressures. At the 700 Pa pressure level, drainage on both sides had ceased and water was observed to overflow the sill pan and enter the stud cavity. As well, drainage from the sill on the B-side was evident at pressures differentials of up to 200 Pa and up to 300 Pa for drainage from the sill on the V-side.
Figure 10 - Water collection rates from sill pan, Trial T1 – Deficiency at window corners, 03 ABS Water Entry - 0 20 40 60 80 100 120 0 100 200 300 400 500 600 700 800
Cham ber Pressure (Pa)
W a te r En tr y (ml /mi n )
V-side (without caulking) Reservoir - 08 full spray
V-side (without caulking) Reservoir - 16 full spray
V-side (without caulking) Reservoir - 34 full spray
B-side (with caulking) Reservoir - 08 full spray
B-side (with caulking) Reservoir - 16 full spray
B-side (with caulking) Reservoir - 34 full spray
Reservoir 03 ABS
Deficiency - Full Spray XPSA W3
B V
Figure 11 - Water collection rates from sill pan, Trial T1 – Deficiency at window corners, 08 ABS Water Entry - 0 20 40 60 80 100 120 0 100 200 300 400 500 600 700 800
Cham ber Pressure (Pa)
W a te r E n tr y ( m l/ mi n )
V-side (without caulking) Reservoir - 08 full spray
V-side (without caulking) Reservoir - 16 full spray
V-side (without caulking) Reservoir - 34 full spray
B-side (with caulking) Reservoir - 08 full spray
B-side (with caulking) Reservoir - 16 full spray
B-side (with caulking) Reservoir - 34 full spray
Reservoir 08 ABS
Deficiency - Full Spray XPSA W3
B V
08 08
Results for Test Trial Set T2
As indicated previously and depicted in Figure 5, in this set of test trials, the joint between the cladding and the exterior window frame, was sealed with a rubber gasket along the head and jambs.
Collection of water behind cladding—Comparison of Figures 7 and 12 indicates that there was a significant
reduction in the amount of water collected at the base of the wall behind the cladding with the gasket in place. On either side of the specimen, the rate of water collection was reduced to ca. 10% of the nominal rate collected prior to sealing the head and jambs with the gasket.
Drainage from the sill pan—There was little change in the amount of water reaching the sill pan and which
subsequently drained to the collection trough in this test trial as compared to Test Trial Set T1. Collection rates and visual observations closely resembled those from the initial test trials that did not incorporate a rubber gasket along the perimeter joint between the cladding and window frame. Without deficiencies (Figure 13) very small rates of water were collected (< 20 ml/min) in the trough that collected water from the sill pan. However, with deficiencies at the window corners (Figure 14), water readily penetrated to the sill pan; pan drainage at a rate of up to 71 ml/min (B-side at 03 ABS) was recorded. At pressures levels above 300 Pa (6.27 psf), drainage rates diminished, and water was seen to accumulate in the sill pan. At 700 Pa (14.62 psf), drainage was completely arrested and eventually
water completely filled the pan. Once filled, additional water that entered the sill pan spilled over its back dam into the stud cavity. As was the case for Test Trial Set T1, for this Test Trial, drainage from the sill was evident at pressures differentials of up to 200 Pa (4.18 psf), on the B-side and up to 300 Pa (6.27 psf) for drainage of the sill on the V-side.
Water entry at window head—No water entry was observed at the head of the V-side (without sealant) as was
observed in Test Trial Set 1, even at the highest pressure level.
Water Entry - 0 200 400 600 800 1000 1200 0 100 200 300 400 500 600 700 800
Chamber P ressure (Pa)
W ater E n tr y (m l/ mi n )
V-side (without caulking) Behind Cladding - 08 Cas cade
V-side (without caulking) Behind Cladding - 16 Cas cade
V-side (without caulking) Behind Cladding - 34 Cas cade
B-side (with caulk ing) Behind Cladding - 08 Cas cade
B-side (with caulk ing) Behind Cladding - 16 Cas cade
B-side (with caulk ing) Behind Cladding - 34 Cas cade
Behind Cladding 08 ABS
N o Deficiency - Full Spray XPSA W3
B V
08 08
Figure 12 - Water collection rates at base of wall (behind cladding) Trial T2 - with rubber gasket; No Deficiency; 08 ABS
Figure 13 - Water collection rates from sill pan, Trial 2 with Rubber Gasket - No Deficiency; 08 ABS Water Entry - 0 20 40 60 80 100 120 0 100 200 300 400 500 600 700 800 Chamber Pressure (P a) W a ter E n tr y (ml /mi n )
V-side (without caulking) Reservoir - 08 Cascade
V-side (without caulking) Reservoir - 16 Cascade
V-side (without caulking) Reservoir - 34 Cascade
B-side (with caulking) Reservoir - 08 Cascade
B-side (with caulking) Reservoir - 16 Cascade
B-side (with caulking) Reservoir - 34 Cascade
Reservoir 08 ABS
No Deficiency - Full Spray XPSA W3
B V
08 08
Figure 14 - Water collection rates from sill pan, Trial 2 with Rubber Gasket; Deficiency at window corners; 08 ABS
Water Entry - 0 20 40 60 80 100 120 0 100 200 300 400 500 600 700 800 Chamber Pressure (P a) W a ter E n tr y (ml /mi n )
V-side (without caulking) Reservoir - 08 Cascade
V-side (without caulking) Reservoir - 16 Cascade
V-side (without caulking) Reservoir - 34 Cascade
B-side (with caulking) Reservoir - 08 Cascade
B-side (with caulking) Reservoir - 16 Cascade
B-side (with caulking) Reservoir - 34 Cascade
Reservoir 08 ABS
Deficiency - Full Spray XPSA W3
B V
Results for Test Trial Set T3
In this test trial, spray-in-place polyurethane foam was placed between the rough opening and the window frame to nominally provide a heightened degree of airtightness at the interior of the window assembly. As indicated previously, the rubber gaskets used in Test Trial Set T2 were removed thus providing an open perimeter joint between the cladding and the exterior surfaces of the window frame. As regards the specimen’s exterior surfaces, essentially the same conditions were in effect during this Test Trail Set as during Test Trial Set T1.
Collection of water behind cladding—As was the case in Test Trial Set 1, significant amounts of water passed
behind the cladding to the collection trough at the base of the wall (Figure 15). Rates of water collection were slightly higher than those of Test Trial Set T1. Interestingly, water entry behind the cladding showed a higher degree of dependence on water spray rate than had been observed during Test Trial Set T1.
Drainage from the sill pan—Little or no water was collected at the trough servicing the sill pan when no
deficiencies were present at the windows (Figure 16), whereas with deficiencies, water evidently was introduced to the sill pan (Figure 17). The maximum drainage collection rate in this instance was ca. 110 ml/min. Rates of water collection from the sill pan were comparatively higher than the base condition (without foam), particularly at higher pressure levels. Visual observations for both sides of the wall also showed that the sill pan overflowed after only a few minutes at the 500 Pa (10.44 psf) pressure level (08 ABS leakage condition), indicating a higher rate of water entry than in the original trials. As in previous trials, sill pan drainage was almost completely arrested at the 700 Pa (14.62 psf) pressure level whereas drainage from the sill pan was evident at pressures differentials of up to 300 Pa (6.27 psf).
Water entry at window head—No water leakage was observed at the head on the V-side (without sealant) of
the window, even at the highest applied pressure (700 Pa; 14.62 psf) (as was observed in Test Trial Set T1). This is a similar result to that obtained for Test Trial Set T2.
Water Entry - 0 200 400 600 800 1000 1200 0 100 200 300 400 500 600 700 800
Chamber P ressure (Pa)
W ater E n tr y (m l/ mi n )
V-side (without caulking) Behind Cladding - 08 Cas cade
V-side (without caulking) Behind Cladding - 16 Cas cade
V-side (without caulking) Behind Cladding - 34 Cas cade
B-side (with caulk ing) Behind Cladding - 08 Cas cade
B-side (with caulk ing) Behind Cladding - 16 Cas cade
B-side (with caulk ing) Behind Cladding - 34 Cas cade
Behind Cladding 08 ABS
NoDeficiency -Foam-no rubber seal
XPSA W3
B V
08 08
Figure 15 - Water collection rates at base of wall (behind cladding) Trial 3 - with foam; No Deficiency; 08 ABS
Figure 16 - Water collection rates from sill pan, Trial T3 - with foam; No Deficiency; 08 ABS
Water Entry - 0 20 40 60 80 100 120 0 100 200 300 400 500 600 700 800 Chamber Pressure (P a) W a ter E n tr y (ml /mi n )
V-side (without caulking) Reservoir - 08 Cascade
V-side (without caulking) Reservoir - 16 Cascade
V-side (without caulking) Reservoir - 34 Cascade
B-side (with caulking) Reservoir - 08 Cascade
B-side (with caulking) Reservoir - 16 Cascade
B-side (with caulking) Reservoir - 34 Cascade Reservoir 08 ABS NoDeficiency -Foam-no rubber seal XPSA W3 B V 08 08
Figure 17 - Water collection rates from sill pan, Trial T3 - with foam; Deficiency at window corners; 08 ABS Water Entry - 0 20 40 60 80 100 120 0 100 200 300 400 500 600 700 800 Chamber Pressure (P a) W a ter E n tr y (ml /mi n )
V-side (without caulking) Reservoir - 08 Cascade
V-side (without caulking) Reservoir - 16 Cascade
V-side (without caulking) Reservoir - 34 Cascade
B-side (with caulking) Reservoir - 08 Cascade
B-side (with caulking) Reservoir - 16 Cascade
B-side (with caulking) Reservoir - 34 Cascade
Reservoir 08 ABS
Deficiency -Foam-no rubber seal-wet XPSA W3
B V
Results for Test Trial Set T4
The specimen was modified to include drip cap flashing at the head of both sides of the specimen. The foam used to form an air seal between the rough opening and the interior perimeter of the window frame for Test Trial Set 3 was left in place for most of Test Trial Set 4; the foam was removed for testing at the highest spray rate.
Collection of water behind cladding—The amount of water collected at the base of the wall behind the cladding
remained high despite the installation of the drip cap flashing (Figure 18). Addition of the drip cap flashing evidently did not reduce the amount of water that penetrated behind the cladding.
Drainage from the sill pan—Either with or without the drip cap installed at the head of the window, and with
no deficiencies introduced at the window corners, water collection rates for troughs servicing the drainage from the sill pan were low; less than 15 ml/min and 6 ml/min with and without the cap installed respectively (Figure 16 and Figure 19). With deficiencies at the lower window corners, results with and without drip cap flashing were similar (Figure 17 and Figure 20). As well, water drainage from the sill pan ceased on the B-side (sealant) at approximately 500 Pa (10.44 psf) pressure level whereas water drainage on the V-side (without sealant) did not drop off at high test pressures; for both sides however drainage from the sill pan could be achieved at a pressure differential of 300 Pa (6.27 psf). Essentially, the addition of drip cap flashing did not reduce the amount of water reaching the rough sill.
Water entry at window head—No water was observed at the head on either side of the test specimen, even
when the interior foam seal (which had been installed for Test Trial Set 3) was removed. It thus appears that addition of the drip cap helped prevent water entry at this location on the V-side.
Figure 18 - Water collection rates at base of wall (behind cladding) Trial T4 - with foam and drip cap head flashing; No Deficiency; 08 ABS
Water Entry - 0 5 10 15 20 25 30 35 40 0 100 200 300 400 500 600 700 800
Chamber Pressure (Pa)
W a ter E n tr y (ml /mi n )
V-s ide (without caulking) Reservoir - 08 Full Spray
V-s ide (without caulking) Reservoir - 16 Full Spray
V-s ide (without caulking) Reservoir - 34 Full Spray
B-s ide (with caulk ing) Reservoir - 08 Full Spray
B-s ide (with caulk ing) Reservoir - 16 Full Spray
B-s ide (with caulk ing) Reservoir - 34 Full Spray Reservoir 08 ABS NoDeficiency-Headflash-Foam N o rubberseal-fs XPSA W3 B V 08 08 Water Entry - 400 600 800 1000 1200 1400 1600 1800 2000 W a ter En tr y (ml /mi n ) Behind Claddin 0 200 0 100 200 300 400 500 600 700 800
Chamber Press ure (Pa)
V-side (without caulking) Behind Cladding - 08 Full Spray
V-side (without caulking) Behind Cladding - 16 Full Spray
V-side (without caulking) Behind Cladding - 34 Full Spray
B-side (with caulking) Behind Cladding - 08 Full Spray
B-side (with caulking) Behind Cladding - 16 Full Spray
B-side (with caulking) Behind Cladding - 34 Full Spray g 08 ABS NoD eficiency-Headflash-Foam-No rubberseal-fs XPSA W3 B V 08 08
Figure 19 - Water collection rates from sill pan, Trial T4 - with foam and drip cap head flashing; No Deficiency; 08 ABS
Figure 20 - Water collection rates from sill pan, Trial T4 - with foam and drip cap head flashing; Deficiency at window corners; 03 ABS
Water Entry - 0 10 20 30 40 50 60 70 80 90 0 100 200 300 400 500 600 700 800
Chamber Pressure (Pa)
W a ter E n tr y (ml /mi n )
V-side (without caulking) Reservoir - 08 Full Spray
V-side (without caulking) Reservoir - 16 Full Spray
V-side (without caulking) Reservoir - 34 Full Spray
B-side (with c aulking) Res ervoir - 08 Full Spray
B-side (with c aulking) Res ervoir - 16 Full Spray
B-side (with c aulking) Res ervoir - 34 Full Spray Reservoir 03 ABS Deficiency_H eadflash-Foam-N o rubberseal-fs XPSA W3 B V 03 03 Discussion
A brief discussion on the results derived from tests follows in same order as was previously presented and relevant implications in respect to the design, installation, and testing of assemblies are considered.
Collection of water behind cladding
The specimen configuration that incorporated the rubber gasket between the window perimeter and the cladding system (the configuration for Test Trial Set 2) showed the least amounts of water entry behind the
cladding. Open joints, which were present in the other three specimen configurations, permitted water entry behind the cladding. The addition of the drip cap head flashing resulted in essentially no reduction in the measured rates of water collection at the base of the wall from behind the siding. This suggests that a good portion of the water
collected at this location probably entered through the horizontal joint beneath the window (between the cladding and the window frame). Further water penetration tests would be needed to confirm this assumption.
The amounts of water collected from the sill pan area were essentially unrelated to the amounts collected at the base of the wall behind the cladding. Although it would be desirable to limit the amounts of water that get behind the cladding, the test specimen showed an ability to drain water from behind the cladding, down the face of the foam sheathing board. Drainage via this path was appreciable even though the cladding was not spaced from the
sheathing. No water penetration through the XPS sheathing was observed, although it should be noted that the foam sheathing was continuous (it did not include any joints).
Implication—In the test specimen evaluated, sealing of joints between the cladding and the window frame did
not appear to be absolutely necessary, owing to the drainage capabilities of the cladding system. The drainage capabilities of the cladding system, combined with the water penetration resistance of the XPS sheathing, prevented water that penetrated behind the cladding from entering wall framing cavities. However, the ability of the cladding system to itself tolerate substantial and chronic water penetration without deterioration is in doubt. Limiting water penetration past the cladding system would also limit the likelihood of water leakage through deficiencies in XPS sheathing board that acts as WRB.
Open joints would likely be less of an issue for cladding placed on furring strips or hollow-backed vinyl siding, as water entry behind the cladding would drain even more freely to the base of the wall than was the case in the specimen tested in this investigation.
Hollow-backed vinyl siding is typically installed with open joints and J-trim at the window interface. The use of J-trim with lap siding, as in the specimen tested, is not common, but has advantages. The J-trim made it possible to use preformed gasketing as a perimeter seal between the window and the lap siding (which has a stepped profile between siding courses). Preformed gasketing is simpler to install than are sealant joints; joints made with gasketing are also more convenient to maintain.
Drainage from the sill pan
Protection of the rough sill and the adjacent jambs with a sill pan will help ensure the long-term performance of the window installation, provided that drainage occurs from the sill pan. A functional sill pan will protect the framing members if at some point over the life of the assembly water entry to the rough opening occurs.
Test results from the four trials, with the windows configured to contain deficiencies (Table 2), indicate that water entry around (or more likely through) the window was less on the V-side of the specimen, (where sealant behind the jamb and head flanges was omitted), than on the B-side of the specimen (where there was sealant behind the jamb and head flanges). The table indicates that at test pressures up to and including 200 Pa. rates of collection from the sill pan on the V-side of the specimen were consistently less than on the B-side of the specimen.
Table 2 – Water collection rates (ml/min.) from sill pan in relation to nominal pressure levels (Pa) for walls with deficiencies at window corners and tested at a water spray rate of 3.4 L/min-m2 and 03 ABS leakage.
Water collection rates (ml/min.) B-side (sealant) at
Water collection rates (ml/min.) V-side (without sealant) at Test Trial
Set Nominal Test pressure levels (Pa) Nominal Test pressure levels (Pa)
0 75 150 200 0 75 100 200
T1 39 59 77 108 54 52 75 89
T2 32 49 54 72 0 7 9 9 T3 23 59 56 69 0 10 35 40 T4 43 51 49 63 21 22 22 26
Additionally, at higher pressure levels (i.e. > 200 Pa; 4.2 psf), significant accumulation of water in the sill pan was observed on the B-side of the specimen. The accumulation was brought about by both increased water entry to the sill area and reduced drainage from the pan (given that pressure differentials were present across the drainage path from the pan, and were in a direction that would oppose drainage). Nonetheless, drainage from the sill pan occurred on both sides of the specimens up to 300 Pa (6.27 psf) pressure differential. When accumulation was observed, water was seen to “bubble” in the sill pan area as a consequence of air flow through the drainage opening, through the same tube from which water would drain, but in the direction opposite to that of drainage. At
heightened pressure levels (i.e. 500 and 700 Pa; 10.44 and 14.62 psf), accumulation in the sill pan in some instances exceeded pan capacity, resulting in pan overflow, and thereafter spillage into the stud cavity. Visual observations relating to accumulation and bubbling of water in the sill pan are presented in Table 3.
Table 3 – Visual observations of water in sill pan for walls with deficiencies at window corners and tested at 03 ABS leakage
Test Trial Set
B-side (sealant) V-side (Without sealant)
Water in sill pan seen “bubbled” but did not “overflow” occurred only at 700 Pa for all water spray rates (water from head likely increased amount of water to sill pan)
Water in sill pan “bubbled” but did not
“overflow” the pan; occurred only at 700 Pa and 3.4 L/(min-m2) water spray rate
T1
Water “bubbled” but did not “overflow” the pan; Bubbling at > 300 Pa at all water spray rates Water “overflowed” only at 700 Pa and
3.4 L/(min-m2) water spray rate T2
At a water spray rate of 3.4 L/(min.-m2) and pressure levels > 300 Pa, some “bubbling” but no “overflow” occurred at lower water spray rates, little water was visible in the pan.
Water “bubbled” and “overflowed” to rough sill at 500 Pa; condition similar for all water spray rates
T3
Water “bubbled” at 500 Pa and “overflowed” to rough sill at 700 Pa; condition similar for all water spray rates
No “bubbling” and no “overflow” occurred even at 700 Pa for all water spray rates
T4
During test trial set T1, the response was essentially the same on either side of the test specimen; on the V-side of the specimen water penetration around the window head was observed, which appeared to find its way to the sill pan. During Test Trial Sets T2, T3, and T4 pan overflow occurred on the B-side of the specimen, with the spray and pressure levels at which overflow occurred varying between trial Sets. In contrast, pan overflow was not observed on the V-side of the specimen during Test Trial Sets T2, T3, or T4, regardless of spray rate or air pressure
differential (although “bubbling” was sometimes observed).
The heightened vulnerability of the B-side of the specimen to overflow of the sill pan may be explained in part by the pressure differentials that arise in the window rough opening when the specimen is tested in wet conditions. When subjected to air pressure differential in a dry condition, B- and V-sides of the specimen showed similar pressure drops at the window interface (Figure 21 and 22), although the pressure drops were slightly higher on the B-side. In these figures, the pressure drops at the window interface in relation to the pressure across the specimen are given for both ABS leakage conditions (03 and 08 ABS).
In Figures 21 and 22 the solid lines indicate trends in pressure drop across the window flanges with the specimen at the more restrictive (03) ABS condition, while the dotted lines indicate the corresponding trends at the less restrictive (08) ABS condition. At a chamber pressure of 700 Pa (14.62 psf), the pressure drop values at the 03 ABS condition on the B-side of the specimen ranged from 117 to 212 Pa while the corresponding values at the 08
ABS condition that ranged from 297 and 584 Pa (Table 4). At a lower ABS leakage condition, the pressure drops across the window flanges were obviously lower. These phenomena are apparent for the B- as well as the V-side, although as indicate previously the pressure drops were slightly higher on the B-side of the specimen (Table 4).
Table 4 – Ranges in window interface pressure drops (Pa) at 500 Pa chamber pressure at different ABS leakage conditions for the B- and V-side when tested under dry or wet conditions
B-side (with sealant) V-side (without sealant)
Leakage
condition Dry Wet Dry Wet
03 ABS 86 to 154 (68) 84 to 481 (397) 61 to 114 (53) 66 to 300 (234)
08 ABS 214 to 467 (253) 240 to 504 (264) 167 to 332 (165) 398 to 490 (92)
When tested in a wet condition, pressure drops across the window flanges increased in relation to those recorded under dry conditions (Figure 23 and 24). The largest relative increases in pressure drop across the window flanges, between dry and wet conditions, were recorded on the B-side of the specimen when the installation was in the more restrictive (03) ABS condition (Table 4). Although the pressure drops across the window flanges with the specimens in a wet condition are not drastically higher on the B-side, they nonetheless are higher than on the V-side of the specimen. Higher pressure drops provide for a greater driving force for water entry across the flanges and a greater resistance to drainage from the sill pan.
It is thought that sealant application behind the window flanges blocks the larger air leakage paths, and the smaller paths that remain are easily occluded by water once the assembly becomes wet. Once occlusion of the small pathways by water occurs the pressure drops across them (and any other remaining passageways) are increased; this can in turn cause greater amounts of water entry to the sill.
Window Interface Pressure Drop 0 100 200 300 400 500 600 700 0 100 200 300 400 500 600 700 800
Chamber Pressure (Pa)
P res s u re D ro p ( P a)
B-side No Def - 03 ABS B-side No Def - 08 ABS B-side Def - 03 ABS B-side Def - 08 ABS B-side No Def with seal - 03 ABS B-side No Def with seal - 08 ABS B-side Def with seal - 03 ABS B-side Def with seal - 08 ABS B-side No Def with Foam - 03 ABS B-side No Def with Foam - 08 ABS B-side Def with Foam - 03 ABS B-side Def with Foam - 08 ABS
B-side No Def with Drip Cap and Foam - 03 ABS B-side No Def with Drip Cap and Foam - 08 ABS B-side Def with D rip Cap and Foam - 03 ABS B-side Def with D rip Cap and Foam - 08 ABS B-side (with caulking)
XPSA W3
B V
Figure 21 - Pressure drops for XPSA W3 B-side (With Sealant) wall/window interface, when dry
Window Interface Pressure Drop
0 100 200 300 400 500 600 700 0 100 200 300 400 500 600 700 800
Chamber Pressure (Pa)
P res s u re D ro p ( P a)
V-side No Def - 03 ABS V-side No Def - 08 ABS V-side Def - 03 ABS V-side Def - 08 ABS V-side No Def with seal - 03 ABS V-side No Def with seal - 08 ABS V-side Def with seal - 03 ABS V-side Def with seal - 08 ABS V-side No Def with Foam - 03 ABS V-side No Def with Foam - 08 ABS V-side Def with Foam - 03 ABS V-side Def with Foam - 08 ABS
V-side No Def with Foam and Drip Cap - 03 ABS V-side No Def with Foam and Drip Cap - 08 ABS V-side Def with Foam and Drip Cap - 03 ABS V-side Def with Foam and Drip Cap - 08 ABS
XPSA W3
B V
V-side (without caulking)
Window Interface Pressure Drop 0 100 200 300 400 500 600 700 0 100 200 300 400 500 600 700 800
Chamber Pressure (Pa)
P res s u re D ro p ( P a)
B-side No Def - 03 ABS B-side No Def - 08 ABS B-side Def - 03 ABS B-side Def - 08 ABS B-side No Def with seal - 03 ABS B-side No Def with seal - 08 ABS B-side Def with seal - 03 ABS B-side Def with seal - 08 ABS B-side No Def with Foam - 03 ABS B-side No Def with Foam - 08 ABS B-side Def with Foam - 03 ABS B-side Def with Foam - 08 ABS
B-side No Def with Drip Cap and Foam - 03 ABS B-side No Def with Drip Cap and Foam - 03 ABS - cascade B-side No Def with Drip Cap and Foam - 08 ABS B-side No Def with Drip Cap and Foam - 08 ABS - cascade B-side Def with Drip Cap and Foam - 03 ABS B-side Def with Drip Cap and Foam - 03 ABS - cascade B-side Def with Drip Cap and Foam - 08 ABS
B-side (with caulking)
XPSA W3
B V
Figure 23 - Pressure drops for XPSA W3 B-side (with sealant) wall-window interface when wet, 3.4 spray rate
Window Interface Pressure Drop
0 100 200 300 400 500 600 700 0 100 200 300 400 500 600 700 800
Chamber Pressure (Pa)
P res s u re D ro p ( P a)
V-side No Def - 03 ABS V-side No Def - 08 ABS V-side Def - 03 ABS V-side Def - 08 ABS V-side No Def with seal - 03 ABS V-side No Def with seal - 08 ABS V-side Def with seal - 03 ABS V-side Def with seal - 08 ABS V-side No Def with Foam - 03 ABS V-side No Def with Foam - 08 ABS V-side Def with Foam - 03 ABS
V-side (without caulking)
XPSA W3
B V
Water entry at window head
Water entry at the head of the V-side was only observed for Test Trial Set T1 and only at the 700 Pa pressure level. Reducing the water loading in the proximity of the head flange, as was achieved by the placement of a rubber gasket (in Test Trial Set 2), or by restricting the number of openings through which air and water could pass, as was accomplished by the use of spray-in-place polyurethane foam around the interior perimeter of the window (in test Trial Set 3), reduced the likelihood of water entry. In both trails leakage at the head flange was in fact eliminated.
Over the course of installing the drip cap for Test Trial Set 4, a minute, (barely perceptible) discontinuity was found at the intersection between two of the self-adhered flashing sheets (between one of the jamb sheets and the head sheet), in other words, near an upper window corner. It is supposed that this deficiency permitted entry of water behind the flange during extreme test conditions. That such a deficiency was evident even though care and attention was brought to the installation process suggests that many such occurrences are likely in the field; the evidence of water entry at window penetrations bears this out. However, the installation of a drip cap flashing was shown to solve this problem provided the installation is itself correctly done. Methods other than the use of a drip cap flashing at the head should also be investigated as possible solutions to reducing the likelihood of water entry at this vulnerable location.
Implications—Should a window be installed without application of a sealant behind the mounting flange,
measures ought to be taken to ensure that a robust water management design is afforded not only at the sill, but at the head of the window as well. This may evidently be accomplished by the installation of a drip cap flashing.
Although a wind pressure of 700 Pa (14.62 psf) coincident with rain is rarely encountered, even in climates subject to tropical storms, tests undertaken in such extreme conditions often reveal weak links in the wall system.
Relating test conditions to weather parameters
A summary of extreme wind-driven rain (WDR) conditions in over a range of return periods (in years) is provided in Table 6 for five different locations across the United States [21]. Information on rates of wind driven rain deposition (L/(min-m2)) and driving rain wind pressures (DRWP) are given as average extreme hourly values. The DRWP is the velocity pressure (Pa) exerted on a surface (e.g. wall) normal to the wind direction during rain. A word of caution is justified; the WDR and DRWP values listed in the Table for Miami are probably over-estimates for the shorter return periods (i.e. ≤ 10 years), and under-estimates for the longer return periods (≥ 20 yrs). The