ARCHITECTURE OF NEAR REAL-TIME MONITORING SYSTEMS FOR WATER DISTRIBUTION SYSTEMS
by
Sebastian K. B6gershausen
Bachelor of Science in Civil Engineering The George Washington University, 1997
Submitted to the Department of Civil and Environmental Engineering in
Partial Fulfillment of the Requirements for the Degree, o%4ACHEfTms 71
OFTECHNOLOGY
MASTER OF ENGINEERING
JUN
04
?qnIn Civil and Environmental Engineering
LIBRARIES at the
MASSACHUSETTS INSTITUTE OF TECHNOLOGY 7 ARKER
June 2001
@2001 Sebastian K. B6gershausen. All rights reserved.
The author hereby grants to MIT permission to reproduce and to distribute publicly paper and electronic copies of this thesis document in whole or in part.
Signature of Author:
Department of Civil and En'Vi'ronmental Engineering May 11, 2001
Certified by:
George Kocur Senior Lecturer, Civil and Environmental Engineering Thesis Supervisor
Accept.ed by:
/7r -'Oral Buyukozturk
Massachusetts Institute of Technology
Architecture of Near Real-Time Monitoring Systems for Water Distribution Systems Sebastian B6gershausen
ARCHITECTURE OF NEAR REAL-TIME MONITORING SYSTEMS FOR WATER DISTRIBUTION SYSTEMS
by
Sebastian K. Bogershausen
Submitted on May 11, 2001, to the Department of Civil and Environmental Engineering in Partial Fulfillment of the Requirements
for the Degree of
MASTER OF ENGINEERING In Civil and Environmental Engineering
ABSTRACT
The town of Arlington, Massachusetts, is planning to improve its existing water meter reading process by installing wireless transmitters on the 12,200 meters throughout the town. A web-based Java software program was developed at MIT to manage the readings (as frequent as every ten minutes) from this monitoring system and perform analytical tasks to prepare billing reports, analyze usage patterns, detect leaks, notice water theft, and find deteriorating meters. This thesis describes the system architecture of this water distribution management software, how it compares to large regional supply systems, and what possibilities monitoring networks of this kind have in the future.
Thesis Advisor: George Kocur
Massachusetts Institute of Technology
Architecture of Near Real-Time Monitoring Systems for Water Distribution Systems Sebastian B6gershausen
ACKNOWLEDGEMENTS
I am eternally grateful to those who made it possible for me to pursue and fulfill
one of my dreams:
Col. & Mrs. Charles and Irene Hertel Mr. Bob Gladstone
Dr. George Kocur, Massachusetts Institute of Technology Dr. Majid Manzari, The George Washington University Dr. Irving Shames, The George Washington University
And sincerest thanks to my friends and colleagues who worked on the Arlington Project with me:
Mr. Brad Butler, MIT Mr. Mameet Khanolkar, MIT
Mr. Kent Larson, Town of Arlington Water Department Mr. Marcis Kempe, MWRA
Massachusetts Institute of Technology
Architecture of Near Real-Time Monitoring Systems for Water Distribution Systems Sebastian B6gershausen TABLE OF CONTENTS 1 INTRODUCTION ... 6 2 LITERATURE REVIEW ... 8 2 .1 O VERVIEW ... 9
2.2 AUTOMATION LEVELS IN WATER SUPPLY SYSTEMS ... 9
2.3 MEASUREMENT AND CONTROL VARIABLES...10
2.4 ARCHITECTURE OF A WATER SUPPLY SYSTEM...11
2.5 USE OF TELEMETRY IN WATER MANAGEMENT...15
2.6 DISTRIBUTION MODELING...19
2.7 APPLICATIONS IN LEAK DETECTION PROCESSES ... 19
3 PERFORMANCE AND OPERATIONS OF THE MWRA MONITORING SYSTEM.25 3 .1 S C O P E ... 25
3.2 HYDROLOGICAL MONITORING... 26
3.3 BIOCHEMICAL MONITORING...28
3.4 SIMULATION/MODELING ... 30
3.5 MW RA's SCADA SYSTEM...31
4 ARLINGTON REMOTE MONITORING SOFTWARE GENERAL DESCRIPTION..32
4 .1 O VERVIEW ... 32
4.2 SOFTWARE FUNCTIONALITIES ... 33
4.2.1 Bill Preparation... 34
4.2.2 Meter Watch...34
4.2.3 Leak Detection ... 35
4.2.4 Usage Pattern Analysis... 36
4.2.5 Meter Accuracy Validation... 36
4.2.6 Water Theft Detection ... 37
4.2.7 Administrative Functions ... 38
4.3 SOFTWARE IMPLEMENTATION AND APPLIED TECHNOLOGIES ... 38
5 SOFTWARE ARCHITECTURE AND FUNCTIONAL MODEL DESCRIPTION...40
5.1 USAGE SCENARIO ... 40
5.1.1 User Profile ... 40
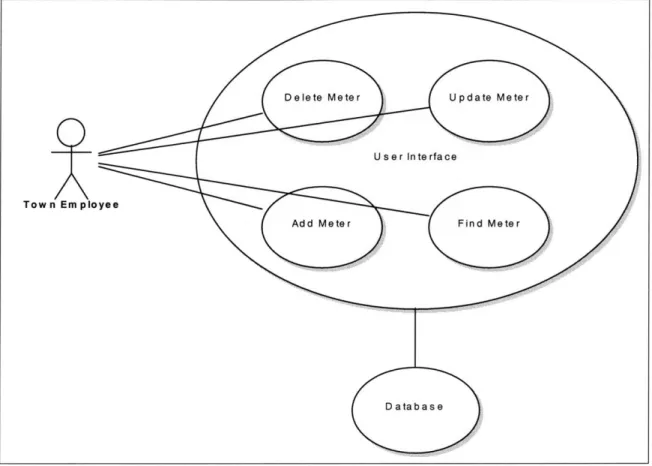
5.1.2 Administration of the Data Tables Use Case ... 40
5.1.3 Configuration and Operation of the Reporting Tools Use Case ... 43
5.1.4 Viewing of the Report Results Use Case... 44
5.1.5 Bill Preparation Use Case ... 45
5.1.6 Usage Pattern Analysis Use Case... 47
5.1.7 Meter Watch Functionality Use Case ... 49
5.1.8 Future Enhancements... 50
5.2 FUNCTIONAL MODEL AND DESCRIPTION ... 50
5.2.1 Bill Preparation Functionality... 50
5.2.2 Meter Watch Functionality... 54
5.2.3 Usage Pattern Analysis ... 57
5.2.4 Database Access ... 59
5.2.5 Administrative Functions ... 63
Massachusetts Institute of Technology
Architecture of Near Real-Time Monitoring Systems for Water Distribution Systems Sebastian B6gershausen
5.2.6 Software Interface Description ... 67
5.3 BEHAVIORAL MODEL AND DESCRIPTION...67
5.3.1 Description of Software Behavior ... 68
5.3.2 Process State Diagram ... 70
6 CO NCLUSIO NS ... 71
7 REFERENC ES ... 73
LIST OF FIGURES FIGURE 2-1 - DISTRIBUTION SYSTEM COVERAGE ... 12
FIGURE 2-2 - OVERALL CONTROL AND MANAGEMENT...14
FIGURE 2-3 - TYPICAL TELEMETRY SYSTEM USING RADIO COMMUNICATIONS ... 15
FIGURE 2-4 - COMPUTER CONTROL AND TELEMETRY ... 18
FIGURE 2-5 - SIMPLE TIME-LAGGED NETWORK PROBLEM...21
FIGURE 2-6 - SAMPLE NETWORK FOR TRANSIENT ANALYSIS...23
FIGURE 3-1 - MWRA FAILURE REPORTS...27
FIGURE 4-1 - HIGH-LEVEL ARCHITECTURE OF WATER SYSTEM...33
FIGURE 4-2 - SOFTWARE ARCHITECTURE ... 39
FIGURE 5-1 - USE CASE DIAGRAM FOR ADMINISTRATION OF METER TABLE ... 41
FIGURE 5-2 - REPORT CONFIG USE CASE ... 44
FIGURE 5-3 - RUN ANALYSIS USE CASE ... 44
FIGURE 5-4 - VIEW REPORTS USE CASE ... 45
FIGURE 5-5 - BILL PREPARATION USE CASE ... 46
FIGURE 5-6 - USAGE PATTERN ANALYSIS USE CASE...48
FIGURE 5-7 - METER WATCH USE CASE...49
FIGURE 5-8 - BILL PREP CLASS DIAGRAM...52
FIGURE 5-9 - BILL PREP SEQUENCE DIAGRAM ... 53
FIGURE 5-10 - METER WATCH CLASS DIAGRAM...55
FIGURE 5-11 - METER WATCH SEQUENCE DIAGRAM...56
FIGURE 5-12 - USAGE PATTERN CLASS DIAGRAM...57
FIGURE 5-13 - USAGE PATTERN SEQUENCE DIAGRAM ... 58
FIGURE 5-14 - DATABASE ACCESS CLASS DIAGRAM ... 60
FIGURE 5-15 - DATABASE ACCESS USING ONLY DBBEAN SEQUENCE DIAGRAM...61
FIGURE 5-16 - DATABASE ACCESS USING DBRESULTS SEQUENCE DIAGRAM ... 62
FIGURE 5-17 - CLASS DIAGRAM FOR ADMINISTRATIVE CLASSES...64
FIGURE 5-18 - UTILITY CLASSES DIAGRAM ... 65
FIGURE 5-19 - UPDATE METER SEQUENCE DIAGRAM...66
FIGURE 5-20 - PROCESS STATE DIAGRAM FOR METER AND METER READ...70
Massachusetts Institute of Technology
Architecture of Near Real-Time Monitoring Systems for Water Distribution Systems Sebastian B6gershausen
1
Introduction
The Department of Public Works of the town of Arlington, Massachusetts, decided in the year 2000 to improve their existing water meter reading process
by installing wireless transmitters on all the roughly 12,200 meters throughout the
town. The town's incentive to install this system was to improve the knowledge and understanding of the local water usage, optimize the billing service, and potentially lower the operating cost of the water department.
Three students from the Massachusetts Institute of Technology's Master of Engineering program in Information Technology for Civil Engineering worked over a period of nine months to build a functional software package to run this system. We met with the client (Arlington's Department of Public Works) to collect the requirements and gather all necessary information to be able to build the software.
Work began in September 2000 through requirements collection and documentation, client meetings and discussions with the regional water distribution agency, the Massachusetts Water Resources Authority (MWRA). By December 2000, we had developed a prototype that showed all features we intended to implement. In the month of January we substantially revised the system based on client feedback and designed each functional element of the system in further detail. The software code was written in February and March 2001 with final changes and enhancements being made over the following months.
The software is intended to provide functionality for the manager of a local water distribution system to capture and control the daily readings of a wireless meter reading network. This system provides the pathways to store data in retrievable locations and performs analytical functions to analyze usage patterns, detect leaks, search for a loss of meter accuracy, etc. Some of these functions require interactions with the regional water authority and potentially also their operations software.
This thesis seeks to explain the architecture of the local monitoring system - how it operates and interfaces with the regional system, how it compares to large-scale water operations software packages (SCADA systems - Supervisory Control And Data Acquisition systems) and what potential systems such as this have for future applications. It is logically divided into chapters that increase in technical depth and detail in relation to the system.
The first chapter describes the technical literature that is available today regarding water distribution software systems and what tasks these programs perform. Topics vary from hardware to software and hydrological modeling
Massachusetts Institute of Technology
Architecture of Near Real-Time Monitoring Systems for Water Distribution Systems Sebastian B6gershausen
systems. The next chapter is a description of the MWRA operations and performance monitoring systems; a discussion of the process, types and locations of monitoring systems that the MWRA employs, and how this relates to a local monitoring network.
Chapter four describes in general the intent of the software package developed at MIT and what the exact functionalities are that need to be implemented to have this system fully functional. It also covers the technologies used to create this program and how they are applied to the problems at hand. Chapter five follows up on this by describing in detail the application that has been developed,
as well as exhibiting standard use cases and sequences.
Massachusetts Institute of Technology
Architecture of Near Real-Time Monitoring Systems for Water Distribution Systems Sebastian B6gershausen
2 Literature Review
Chapter Sources Overview
(Refer to References at the end of this thesis for exact publishing information) 2.2 Automation Levels in Water Supply Systems
Automation Levels in Water Supply Systems
by Edmundo Koelle
in
Water Supply Systems - State of the Art and Future Trends Edited by E. Cabrera and F. Martinez
2.3 Measurement and Control Variables
Measurement and Control Variables
by Edmundo Koelle
in
Water Supply Systems - State of the Art and Future Trends Edited by E. Cabrera and F. Martinez
2.4 Architecture of a Water Supply System
Public Water Supply - Models, Data and Operational Management Dusan Obradovic and Peter Lonsdale
2.5 Use of Telemetry in Water Management
Operational Control of Water Systems M.A. Brdys and B. Ulanicki
and
Communications in Advanced Technology in Water Management Edited by K. F Roberts, Written by J. G. Hurcom
2.6 Distribution Modeling
Operational Control of Water Systems M.A. Brdys and B. Ulanicki
2.7 Applications of Distribution Modeling in Leak Detection Processes
Network monitorinq and the algorithmic location of leaks under steady and unsteady conditions
by James A. Liggett in
Water Supply Systems - State of the Art and Future Trends Edited by E. Cabrera and F. Martinez
And Analysis of Water Distribution Systems Thomas M. Walski
and
Identifying and Reducing Losses in Water Distribution Systems James W. Male
Massachusetts Institute of Technology
Architecture of Near Real-Time Monitoring Systems for Water Distribution Systems Sebastian B6gershausen
2.1 Overview
This chapter explores the existing technical literature that pertains to the architecture of a data management system of a water supply organization. This material is important for understanding the effect of computer hardware and software on the water industry and the possibilities that they provide. Although the literature ranges over a wide area of topics, the intent of this review is to provide a backdrop of understanding to the implications of a wireless water meter reading system and the software for its management.
2.2 Automation Levels in Water Supply Systems
An automated water supply system is a water distribution network that has an operational computer system that controls (or suggests actions to control) the flow and distribution of the water. Possible actions that can be controlled are such things as opening and closing valves, activating pumps, adjusting pressure
by increasing tank fill levels, etc. In addition to controlling the parameters of the
distribution network, the system also allows the interpretation of data that is collected from points in the network such as meters, pumps, tanks, etc.
The basic system architecture of an automated water supply network is composed of a number of elements that act in concert to perform the acquisition of data, the supervision of the system operation and diagnostic consumption reporting. A system that fulfills these needs is called a SCADA system -Supervisory Control and Data Acquisition system. The SCADA system generally has two physical components: remote stations and a central computer.
Remote Stations are installed at strategic points in the distribution network, such as pump stations, storage tanks, meters and flow control valves. Each remote terminal is composed of a microprocessor with analog and digital input and output interfaces and is connected to the local instruments and actuators. The remote unit provides the acquisition of data and its transmission to the central computer. It can also receive commands from the central computer and perform actions based on this input.
The central computer receives the signals transmitted by the remote station and processes them, producing graphical and/or numerical information for analysis by
the operator.
In order to create an automated water supply network to control the distribution and not only provide operational supervision, it is necessary to develop computational programs that will process the information received by the central computer and propose a "Plan of Maneuvers". The orders of this plan are then transmitted to the remote stations, where the corresponding action is performed.
Massachusetts Institute of Technology
Architecture of Near Real-Time Monitoring Systems for Water Distribution Systems Sebastian B6gershausen
The levels of automation for water supply systems may be classified as follows:
Level 0 Non-programmed local automatic control (sensors)
Level 1 Programmed local automatic control and automatic control valves
Level 2 SCADA system without automatic control action
Level 3 SCADA system with automatic control
At level 0 and level 1, the decision-making process depends entirely on the experience of a system operator. No decisions are made based on integrated information at a centralized location, but on a local basis instead. In liberally dimensioned water networks where demands are served by a small number of tanks, operation at level 0 or 1 can be enough for the necessities, although the system performance will not be optimal. However, potential side effects can be pressure variations and intermittent service, due to the (relative) lack of integrated control over the network.
Distribution of water in large urban centers is operated at level 2 and the operation of many of the control points in the network is activated remotely after much interpretive and simulation work has been performed. Automating this process of decision-making (or decision proposal) leads to level 3, which is the level that many water distribution authorities are currently in the process of developing or installing.
Even though the computational capabilities of computers today are certainly sufficient to perform highly complex distribution simulations and decision-support analysis, there are still difficulties in obtaining adequate physical data for the calibration of these models and thus the operator's interference is still necessary to make corrections to the proposed Plan of Maneuvers. Also, the problem of attempting to predict long-term usage is made severely more difficult due to meteorological conditions and local contingencies.
2.3 Measurement and Control Variables
The components that make up the measurement body of an automated supply network are the source of all the data that guides the distribution. The integration of these instrumentations and a SCADA system forms a controlled hydraulic network, so it is necessary to be aware of the measurements that need to be taken as well as what controls should be implemented.
The minimum set of measurements and controls to be made may be grouped in the following manner:
Massachusetts Institute of Technology
Architecture of Near Real-Time Monitoring Systems for Water Distribution Systems Sebastian B6gershausen 1. Measurements " Tank levels " Pressure in pipelines " Flow rate * Chlorine residual " Turbidity
* Control valve degree of opening
* Local temperature 2. States of Apparatus
* Pump (on/off)
" Shut-off valve (closed/open)
* Remote terminal (connection enabled/disabled)
" Power (on/off) " Control (local/remote) " Safety parameters 3. Controls " Pump (on/off) " Valve (open/closed) " Alarms " Vibrations " Temperatures * Actuator
There are a variety of tools that allow the measurement and control of the distribution, and it is beyond the scope of this thesis to evaluate the differences between the types and manufacturers. For the purposes of the installation of a wireless meter reading system, the above list needs to be amended to include water meters and their states (registering/not registering).
2.4 Architecture of a Water Supply System
The control of even a relatively small distribution network can present a challenging problem to the designer, since there are several seemingly conflicting interests. For example, a system with many alternate paths and redundant supply sources provides a greater level of security of the supply, whereas a distribution tree with one source that branches out to ultimately serve every user is easier to manage since the flow is easier to ascertain and the number of pipes is reduced. In addition, not all systems only serve their customers, but also act as transmission lines to the next contiguous town or distribution system.
Massachusetts Institute of Technology
Architecture of Near Real-Time Monitoring Systems for Water Distribution Systems Sebastian B6gershausen
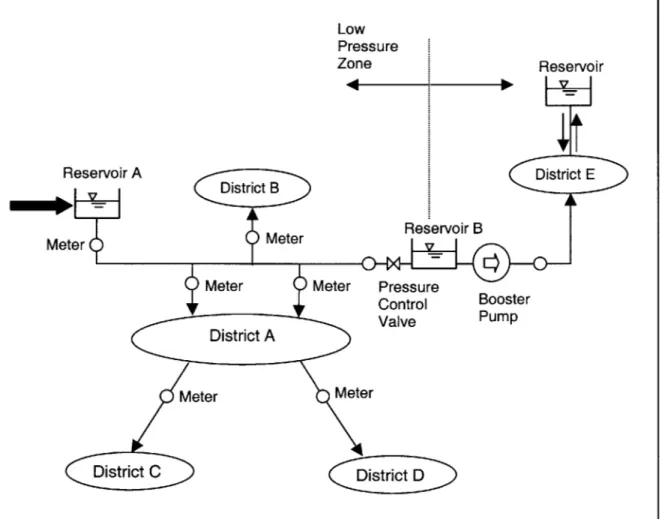
Although it can be difficult to integrate many of these conditions into one design, the most influential design parameters of a water supply system remain constant: Geographic contingencies determine well and tank locations and pressure zones and govern most of the system layout. A system of valves controls where and how the water will reach the customer and regulates the pressure zones. Between distribution districts, meters need to be installed to ascertain usage data for each district.
Low F Reservoir A Meter District B Meter 'ressure one Reservoir District E Reservoir B
Meter Meter Pressure Control Valve District A Meter Meter District C Booster Pump
Figure 2-1 - Distribution System Coverage
Reproduced from Public Water Supply - Models, Data and Operational Management
by Dusan Obradovic and Peter Lonsdale
Figure 2-1 shows part of an urban distribution network that requires a high and low pressure zone based on its geographic layout. Water flows from the supply source into the main reservoir A and from there to the lower reservoir B by gravity. A pressure-reducing valve controls the inflow into reservoir B. Several lower districts are served from this reservoir. A booster pump brings water up in elevation to district E and reservoir C.
Massachusetts Institute of Technology
Architecture of Near Real-Time Monitoring Systems for Water Distribution Systems Sebastian B6gershausen
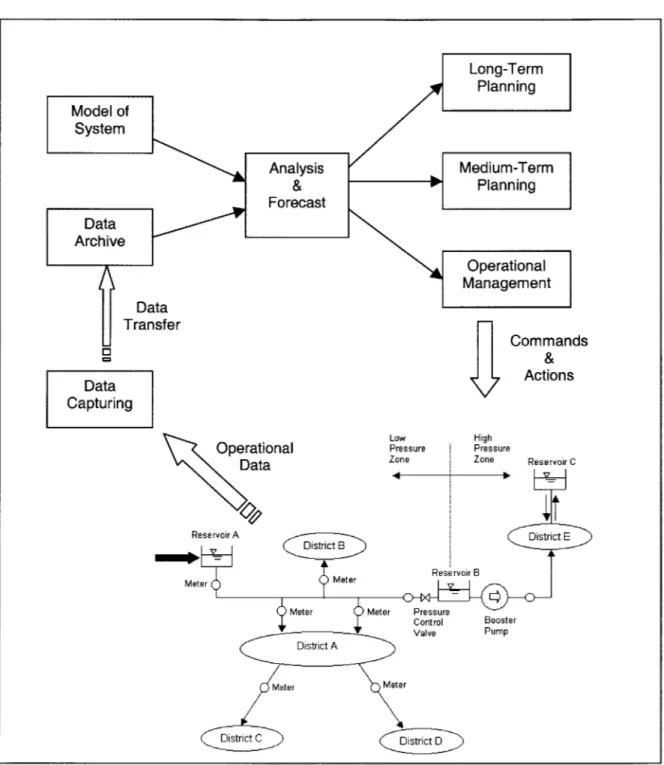
All districts are monitored at the district level and at the consumer level. The
readings from these meters, as well as data from the pressure valves, tank levels, etc. are transferred to an operational management system that allows the creation of a feedback loop of operational data and resulting actions and commands (see Figure 2-2).
Data describing the current state and performance are captured and sent to the central operations center. This information is analyzed (preferably with a model of the system, see 2.6 - Distribution Modeling), a forecast of future developments is made and managers at various levels take appropriate action. Examples are: * Long-term management - planning of new resources to meet future potential
shortfalls
" Medium-term management - changing operating regimes to take advantage of cheaper tariffs
" Short-term management - redeployment of manpower and equipment to reduce leakage
Massachusetts Institute of Technology
Architecture of Near Real-Time Monitoring Systems for Water Distribution Systems Sebastian B6gershausen Long-Term Planning Model of Analysis Medium-Term & r Planning Forecast Data
Ar
Operational Management Data Transfer -Comman & Data Capturing R Met ds Actions Low HighOperational Pressure Pressure
Dat Zone Zone Reservoir C
ese rvoir A DititBDistrict E
eReservoir A Ditstrrit B
DititAValve Pump
Meter Meter
District CD
Figure 2-2 - Overall Control and Management
Reproduced f rom Public Water Supply - Models, Data and Operational Management
by Dusan Obradovic and Peter Lonsdale
Massachusetts Institute of Technology
Architecture of Near Real-Time Monitoring Systems for Water Distribution Systems Sebastian B6gershausen
2.5 Use of Telemetry in Water Management
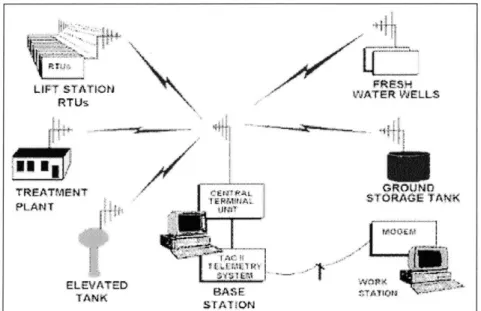
Water distribution networks are spatially distributed over a wide area and require communication links connecting distant sites with control computers. A collection of hardware and software that enables remote sensing and actuating is called a telemetry system. The origin of the data to be transferred by the communications system is in most cases sensors, which are installed in the supply system at key locations. The system state is continuously monitored and the collected information is stored, processed and finally used to decide on a control action. The control decisions are transformed into physical action by specialized actuators.
N
L2
L W T S1 A fON
RTUs, V~AT ER WELLS
TREATMENT P1 ANTF ELEV,.ATED TANK' ST-A-Ti STORAGE TANK< f O
Figure 2-3 - Typical Telemetry System using Radio Communications
The areas in which telecommunications play a key role can be considered in three categories:
" Monitoring and control of the processes (water treatment/distribution)
" Operation of support processes (customer billing systems, infrastructure management systems, materials management systems)
" Managerial control of field operations
In the past, monitoring systems were designed to transfer data from monitoring locations to a central computer through the use of a modem and via public switched telephone network (PSTN). These developments commenced in the 1980's with relatively simple machines that dialed a master receiving station
Massachusetts Institute of Technology
Architecture of Near Real-Time Monitoring Systems for Water Distribution Systems Sebastian B6gershausen
following the initiation of an alarm condition, and then transferred digitized structures of site address and plant state. Rapid development continued throughout the 1980's, culminating in highly sophisticated intelligent outstations able to pass on data at a much faster rate and in more accurate and secure form.
PSTN provided a cost effective means of communication for plant data recovery
where continuous real time supervision is not necessary and as such was suitable to service installations such as meters or apparatus that only needs to send exceptional changes.
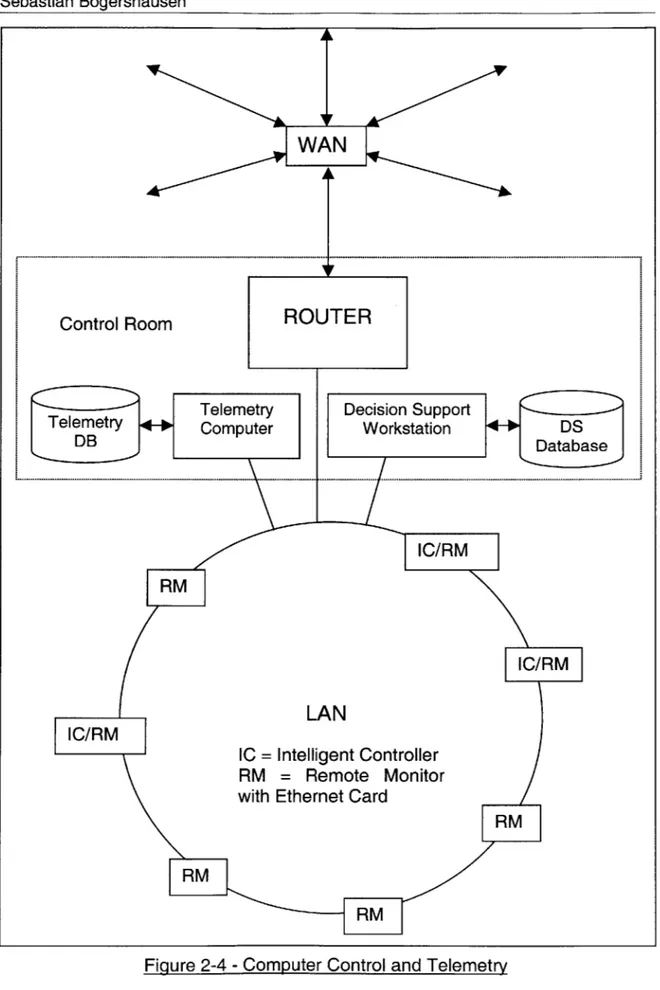
Today, water monitoring systems only make limited use of the PSTN to transfer data. Three hardware layers characterize modern systems: The telemetry system, the local control room and the coordination level (see Figure 2-4). The telemetry system transmits data in both directions between the physical system and the computer using communication links. The computer and other auxiliary equipment in the control room are interconnected by a local area network (LAN). For large water networks, there is normally another decision level that communicates with the local control rooms through a wide area network (WAN). Machines on the LAN are connected through an Ethernet card and TCP/IP protocol, which allows all machines and monitors to communicate with each other. The top level in the decision hierarchy coordinates the activities of many local control centers.
An operator in the control room receives on-line measurements from the process and executes the control decisions. The operator must be provided with an efficient interface to obtain the system behavior and to implement control commands. The telemetry computer runs software for the data communication, data processing and the data presentation. The database plays the role of enabling access to information regarding the history of the water network behavior.
The communication units shown in Figure 2-4 provide an interface between the control computer and the transmission lines. Data are coded by modem for transmission purposes and sent into the line. On the other end of the connection they are decoded by a similar modem. The transmission using modems is not limited to PSTN lines, but these days can also occur over leased-lines, digital subscriber lines (DSL) and cable TV networks.
The major communication routes that connect the important sites of the water distribution system (large pump stations and treatment works) are implemented as high-speed data highways. To transmit high volumes of data, optical fibers are often employed. Measurements are taken at regular intervals and are transmitted to the telemetry database. Optical fibers are particularly attractive because of their high capacity and immunity to electromagnetic interference.
Massachusetts Institute of Technology
Architecture of Near Real-Time Monitoring Systems for Water Distribution Systems Sebastian B6gershausen
For less critical sites where quantity transmitted is less, medium speed communication links are sufficient, such as phone lines, radio transmitters or serial cables. The phone lines can be owned by a water company or leased from a telecommunications company. Leasing the phone lines is expensive, so normally these are only used for batch transmission at times of cheap telephone tariffs. Data are stored locally by a data logger and then sent as one batch to the central computer. Radio links are useful in rural areas for widely distributed water networks. Remote monitoring and control can be performed without cables or line rentals. Radio telemetry can be installed quickly and relocated as site requirements change. Wireless data technologies are becoming more viable and will most likely see their level of use increase, due to their great versatility and ease of use and maintenance. As the reliability of wireless data systems
increases, so will their use.
The intelligent controllers and remote monitors shown in Figure 2-4 interact directly with the physical system. The intelligent controllers are equipped with processors and memory so that they can store measurements, execute commands sent from the decision centers or run their own programs. They have a number of serial 1/O ports served by 1/O cards. I/O cards handle the following functions and signals: A/D (analog-to-digital), D/A conversions, digital signals, analog signals, pulse input and stepper motor output, etc. The remote monitors perform only basic functions such as meter reading and actuating pumps and valves. They have analog and digital inputs and outputs to interact with the analog and digital instruments.
Early distributed control systems used proprietary hardware interfaces, protocols, modems and transmission parameters. Much effort has been made to achieve some standardization. Interface standardization facilitates both development and maintenance of control schemes. Standards define factors, such as circuit board design, cable connector pin assignment, and signal levels. The best recognized standards are: IEEE Standard 488, CAMAC, and EIA Standards. IEEE standards define the electromechanical aspects of parallel transmission. The CAMAC standard provides the interfaces for parallel, bit serial, and byte serial communication, and has found major use in the nuclear industry and process control applications. The Electronic Industries Association (EIA) standards
RS232, RS422 and RS449 define bit serial synchronous and asynchronous
environments and are used in data processing as well as in process control. These days, RS422 and IEEE4888 are being displaced by direct LAN (Ethernet) connections.
Massachusetts Institute of Technology
Architecture of Near Real-Time Monitoring Systems for Water Distribution Systems Sebastian B6gershausen
WAN
Control Room ROUTER
Telemetry Decision Support
Telemetry Computer Workstation DS
DB Database IC/RM RM IC/RM
LAN
IC = Intelligent Controller RM = Remote Monitorwith Ethernet Card
RM
RM
Figure 2-4 - Computer Control and Telemetry
Massachusetts Institute of Technology
Architecture of Near Real-Time Monitoring Systems for Water Distribution Systems Sebastian B6gershausen
2.6 Distribution Modeling
Algebraic relationships can be established to derive static models for pipes, valves and pump stations in a water distribution network. Differential equations serve to create dynamic models for more complex networks or reservoirs. There are passive elements (pipes and valves), which dissipate energy, and active elements (pumps), which supply energy to the network. An important aspect from the modeling point of view is that the pressure head decreases along the passive elements and is increased by the active elements. The structure of the network is described by a node-branch incidence matrix, where the rows correspond to the network nodes and the columns are associated with the branches of the network. In general, an overall mathematical model of the network can be put either into nodal or loop form, depending on its independent parameters. A mixed nodal-loop version can also be derived. Most commercial packages today utilize nodal formulations.
From each node to the next one, a hydraulic relationship is created based on traditional fluid dynamics. Thus based on the pressure head at the reservoir and knowing all the losses that occur between the reservoir and a node in question, an estimate of the resulting head can be calculated. Creating a network of such relationships allows a more complex and therefore meaningful analysis. Such a simulation model can improve the performance of a remotely monitored system mainly in aiding the leak detection process as well as system verification to estimate whether use for a location is reasonable.
The model is derived in terms of unknown nodal heads and unknown branch flows. During simulation applications, heads at the non-reservoir nodes are unknown heads, while branch flows present unknown flows. In the case of estimation, a situation may be more general and depend upon available data. Data can be filled in at known nodes, as long as one can be sure that this additional data is consistent with the boundary conditions that govern the simulation.
2.7 Applications in Leak Detection Processes
Every water distribution system has leaks and their detection can be problematic as the distribution lines are often buried or otherwise inaccessible. However, it is of interest to perform leak detection and eradication because of possible increases in system performance and reduction in the operating cost. Methods that can be employed to detect leaks are:
Massachusetts Institute of Technology
Architecture of Near Real-Time Monitoring Systems for Water Distribution Systems Sebastian B6gershausen
" Periodic pressure surveys attempt to find leaks by calculating an expected friction (or other) head loss through the pipe, which can be compared to the measured on-site head.
" Listening devices for sonic leak detection listen to the sound of the flow through a pipe. When water escapes from an orifice, it causes a vibration in the 500 - 800 Hz range. This sound travels along the pipe wall and can be
heard at a considerable distance by an observer with the proper equipment. " Infrared surveys search for escaped water by looking at a temperature
profile of the area around the pipe.
" Ground-penetrating radar searches for motion in the vicinity of a buried pipe " Analysis of the changes in the ratio of daytime to nighttime consumption
allows a numerical comparison to estimate if there are any losses through the pipe.
A monitoring system that captures information about the pressure and flow
through the network can greatly aid in the detection of leaks. Flow meters and pressure gauges monitor the system continuously and provide a very large amount of data. Based on this data, the health of the distribution system can be analyzed.
There are two possible methods of analysis: Steady state and non-steady-state.
A steady state analysis assumes that the supply network is entirely static, all
pressures are at design levels, and that there is no other flow in the system other than the flow in question. A non-steady state analysis prepares a more realistic estimate of the network by allowing the pressures and flows to vary throughout the entire system, while still trying to ascertain the pressure and flow conditions at a specific location. The design and operation of water distribution systems has traditionally been done by steady state techniques. For design purposes steady state methods are adequate, but a large distribution system never really attains equilibrium in operation. Thus, for monitoring purposes, a transient analysis is more applicable. Also the analysis is an inverse analysis, meaning that we know the output from measurements and wish to find the system characteristics that produced that output.
James A. Ligget describes in Network monitoring and the algorithmic location of
leaks under steady and unsteady conditions a computer program written to solve a transient state distribution network problem and searches for leaks. This program takes simultaneous differential equations and solves them based on data received from the monitoring system and boundary conditions. Each equation describes the state of a node in the distribution network. A node can be a key point where flow parameters like velocity and pressure are monitored, or simply an intermediary location for which flow characteristics are calculated. The four methods that this program employs are outlined below.
Massachusetts Institute of Technology
Architecture of Near Real-Time Monitoring Systems for Water Distribution Systems Sebastian B6gershausen
1. Forward calculations for flows and pressures
This mode is the standard analysis for transient states in looped and branched networks. It can compute the results of pumps coming online, valve closures, etc.
2. Time lagged calculations for leak areas
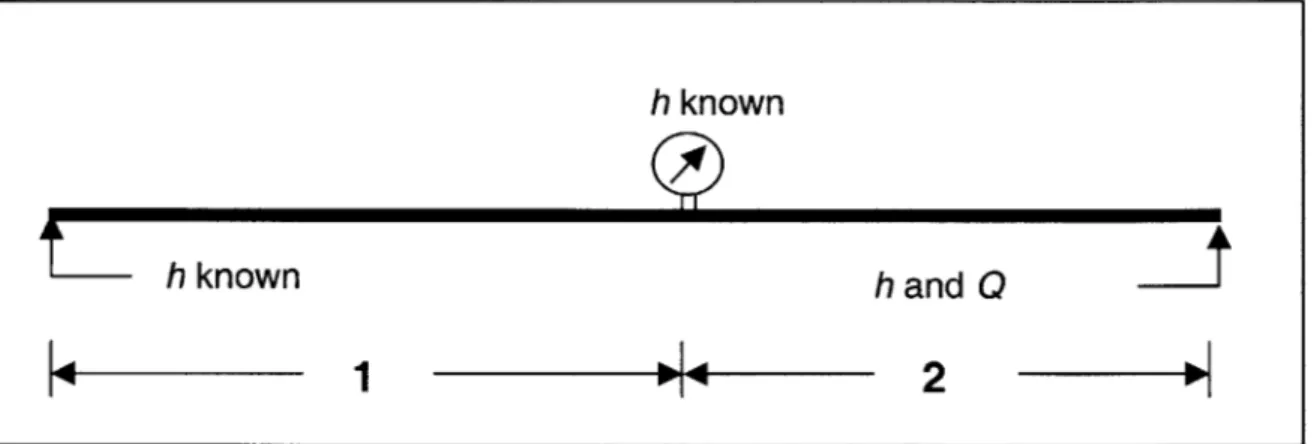
Information from advanced time is used to compute what must have occurred at a previous time. As the simplest such problem, consider Figure 2-5. Normal boundary conditions are given at the left end of the pipe but no conditions are given at the right end. A pressure measurement is made at some intermediate point. A transient calculation can be carried forward using the left boundary condition and the pressure measurement in the normal manner. The conditions at the right end can be computed by carrying information in the positive time direction along the forward characteristic and in the negative time direction along the backward characteristic.
h known
h known hand 0
1
"42
Figure 2-5 - Simple Time-lagged Network Problem
Reproduced f rom Network monitoring and the algorithmic location of leaks under steady
and unsteady conditions by James A. Ligget
3. Inverse calculation for calibration and/or leak areas
The inverse calculation makes use of the forward calculation, which can be in the time-lagged mode. This function takes data for the parameters at known nodes and attempts to find a distribution pattern that fits this data. For the purposes of finding leaks, the transient calculation has two large advantages over the steady state calculation: (a) Pressure waves are less affected by friction than the general flow and thus the precise friction values become less important to the calculation (the computation is less sensitive to friction) and (b) Most networks operate the majority of the time in a transient mode so that the monitoring operation does not need to wait for stationary periods to take pertinent readings for this analysis.
Massachusetts Institute of Technology
Architecture of Near Real-Time Monitoring Systems for Water Distribution Systems Sebastian B6gershausen
4. Location of sudden breaks
This part of the program acts as a monitoring function for the system. The algorithm is triggered by a pressure jump of predetermined magnitude over a short period of time in any of the measurement locations. The time of passage of the surge past several pressure gauges can often locate the position of the origin
of the surge given the wave speed in the pipes in a manner similar to that used to locate earthquakes. A node can then be placed in that position (if the surge is not already located at a node), and the system is reconfigured to calculate water loss.
Process
First the geometry of the system must be resolved. Aside from general topology, the resolution of geometry includes the identification of boundary conditions and measurement points. In preparation for calculation, the program may place nodes in the system that are not specified by the user for the purpose of controlling the Courant number. (The Courant number is a non-dimensional number used in computational fluid dynamics that is defined as flow velocity multiplied by time step divided by unit length.) The method of characteristics uses temporal interpolation to resolve the differences in time of the end points of the characteristics at the nodes. To maintain an accurate solution with minimum diffusion, an attempt is made to keep to Courant number in the neighborhood of one.
The program next determines the paths. These are the routes of shortest wave travel times between the boundary nodes or the measurement point and all other nodes in the system. The paths are used both to determine time lags and to locate surges in the break location subroutine.
The time lags for each node are calculated. The time lag depends on the distance of the node from the nearest boundary condition or measurement point, the number of unknowns at the node and the time lags of each of the neighboring nodes. The equation formulation follows in which the location of each term in a coefficient matrix is found. The path determination, time lags and equation formulation form the parts of the program that contain the logic to proceed with the transient calculation.
Once the time lags have been calculated and the simultaneous equations established, an analysis can be run to perform the time-lagged problem for leaks or the inverse problem for leaks and/or calibration.
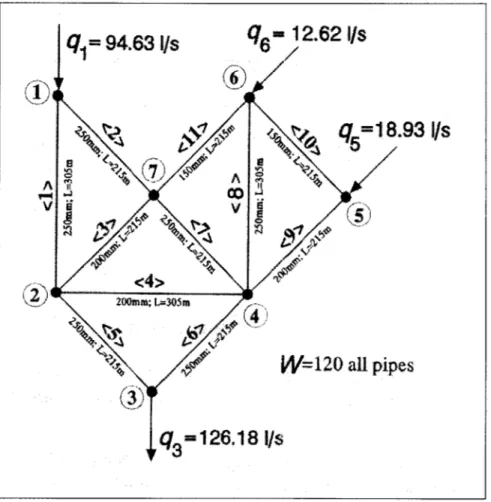
As an example, consider the flow network shown in Figure 2-6. The inflow in node 1 is pressure dependent and the inflows in nodes 5 and 6 are constant. The outflow in node 3 is also pressure dependent. This flow network is translated into
Massachusetts Institute of Technology
Architecture of Near Real-Time Monitoring Systems for Water Distribution Systems Sebastian B6gershausen
a set of simultaneous equations, using the four indicated flows as boundary conditions and with an equation for every node. Readings from the monitoring system can either provide additional data to be taken into account in the calculations, or they can serve as data against which to compare the results of a calculation based purely on the boundary conditions.
A primary difficulty with transient analysis of actual pipe networks is that the
boundary conditions are seldom known and the discharge is not monitored on a continuous basis. However, given enough transient data, a calibration program should be able to estimate those discharges.
ti:~
Av'1
4q,94.63
1/s
<4>
/
2 2/
4',<p.9
1/ %' A.V. 120 all pipes
tq
3=126.18
1/s
Figure 2-6 - Sample Network for Transient Analysis
From Network monitoring and the algorithmic location of leaks under steady and
unsteady conditions by James A. Ligget
The results of the analysis are values for the pipe friction and leak area (size of leak), which can be plotted against actual data to determine similar trends. For each node, a profile can be established which indicates the performance. Since most leaks in distribution systems are the locations of pipe joints, the profiles
Massachusetts Institute of Technology
Architecture of Near Real-Time Monitoring Systems for Water Distribution Systems Sebastian B6gershausen
(and nodes) are frequently created at pipe joint locations, in addition to the measuring nodes. The program can perform several iterations of each calculation to attempt to meet actual data from the monitoring systems and thus create
relatively reliable results.
Massachusetts Institute of Technology
Architecture of Near Real-Time Monitoring Systems for Water Distribution Systems Sebastian B6gershausen
3 Performance and Operations of the MWRA Monitoring
System
The town of Arlington receives its water from the regional water resources authority and so interfaces with their distribution network at several key points. The regional authority has its own monitoring network that is currently totally independent from the system that we have built. However, it is not unreasonable to assume that at some time in the future, information from these two data and distribution networks will be exchanged to create a more efficient system. For this purpose, the author interviewed the regional water resources authority to determine their operating standards and how, where and when their monitoring system works.
3.1 Scope
The current system the Massachusetts Water Resources Authority (MWRA) employs to manage and operate their distribution network is logically divided between the drinking water distribution and sewerage disposal operations. For the purpose of this document, the focus will mainly be on the drinking water distribution aspects. Where technology implications overlap or complement in an
important manner between the two systems, this will be taken into account. The monitoring of the drinking water distribution occurs in two categories: " Hydrological Parameters
" Biochemical Parameters
The hydrological parameters are monitored for billing and performance analysis purposes, while the biochemical properties of the water are measured to ensure the health of the public and validate treatment operations. MWRA employees can view the results of the monitoring and measurement in near-real time by accessing a centralized server. Using an application called "Process Book", the data can be viewed either graphically or numerically and under varying time aspects. From the captured data, weekly and monthly reports are generated and circulated through the various departments to ensure an agency-wide understanding of the current system performance.
This chapter describes the scope of the monitoring, how wireless monitoring is used, and how this large regional system interfaces with a local distribution network.
Massachusetts Institute of Technology
Architecture of Near Real-Time Monitoring Systems for Water Distribution Systems Sebastian B6gershausen
3.2 Hydrological Monitoring
Hydrological monitoring measures the status of a water distribution system in terms of: " Flow " Pressure " Velocity " Precipitation * Reservoir levels
Monitoring is the reporting of any of these parameters to a SCADA system (Supervisory Control and Data Acquisition), while metering records the quantity delivered to a specific location. Metering occurs for two reasons: Custody transfer of the water and system performance analysis. The custody transfer meters are located at the entrance into a town's distribution network and are read as frequently as every two seconds. The MWRA has roughly 160 meters to monitor, most of which are at custody transfer locations to towns. Accordingly, most the meters are large commercial meters, which are more susceptible to accuracy deterioration than the smaller meters used for individual households. From a management standpoint, knowing the consumption of a town is important since it serves as an indicator for the pressure requirements of a system. Pressure monitoring may provide instantaneous information, however, it is necessary to be able to anticipate a consumption rate for a distribution main in order to adequately size reservoirs, tanks, pipes, flows, etc. to provide the pressure necessary to meet usage and flow velocity requirements.
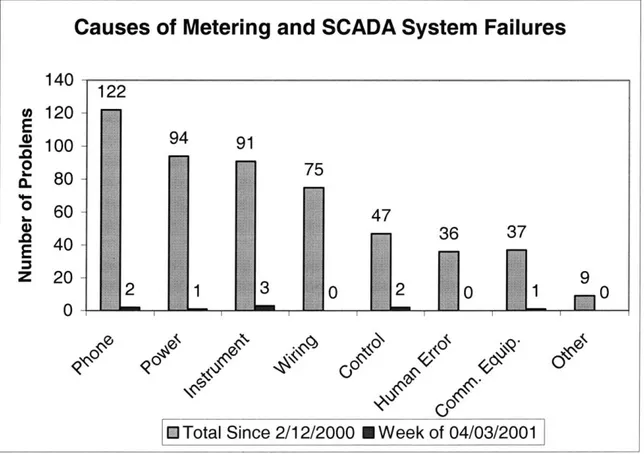
Meters, pressure monitors and reservoir level sensors report their readings over leased lines from the public switched telephone network (PSTN). Although a reading can be prompted at any given time (data pull), the standard operation is a data push to the server at pre-programmed time intervals. The largest problem the MWRA has encountered in operating their meter reading system is failure of the leased lines (see Figure 3-1). The causes for this vary; however, a frequent problem is that since the MWRA's leased lines are not used for telephone purposes, they do not have a dial tone. When telephone company employees are searching for empty lines to make a new connection, often they simply "listen" to the line and upon not hearing a dial tone, they assume that the line is unused and put a new connection on that line.
The MWRA issues two internal documents to keep track of system status and performance. The "Weekly Water Quality Report" and "Monthly Management Indicator Schedule" assemble data to enable operations staff to identify water source fluctuations, monitor process performance, and identify unusual patterns or anomalies. In regards to the metering operations, both of these documents
Massachusetts Institute of Technology
Architecture of Near Real-Time Monitoring Systems for Water Distribution Systems Sebastian B6gershausen
include detailed information regarding reservoir levels and precipitation, both of which are direct contributors to system pressure and flow conditions. Since the amount of water metered is dependent, among other things, on the water pressure, operations personnel relies on these documents to give an indication of how to react to current situations in the distribution network.
Throughout the MWRA's distribution system, there are pressure alarms that are customized for each location. If the pressure falls below a pre-determined value, the sensor will set off an alarm at the centralized operations control center. Although the MWRA's authority does not extend into a town's distribution network, it is possible for them to notice an unusual pressure drop in a distribution main further down the line than their apparatus reaches. Under these circumstances, the town water resources manager could be contacted for further action. 122 94 2 1 91 75 3 10
Causes of Metering and SCADA System Failures
140 120 100 -80 60 -40 20 -0 0 0
El Total Since 2/12/2000 E Week of 04/03/2001
IS, 'S C) 47 36 2 0 37 1 9 0
Figure 3-1 -MWRA Failure Reports
Reproduced from MWRA's "Weekly Water Field Operations Report", March 30, 2001, p.7 Page 27 of 73 0I
E
0 .0 0 0. -A- lwaa PMassachusetts Institute of Technology
Architecture of Near Real-Time Monitoring Systems for Water Distribution Systems Sebastian B6gershausen
3.3 Biochemical Monitoring
Biochemical monitoring occurs on every possible parameter that could affect the health of the public. Since the MWRA deals not only with the supply of the drinking water, but also the treatment of sewage, the water quality indicators that must be monitored extend past ensuring drinking water quality to also ensuring that effluent from their treatment facilities is of acceptable quality. The apparatus and processes of determining the water quality parameters are beyond the scope of this document, however, some meaningful information regarding the monitoring of these parameters has been collected.
The six general groups of water quality indicators are:
" Microbial
" Turbidity & Algae
" Corrosiveness (pH and alkalinity)
" Disinfectant residual
" Disinfectant by-products
" Mineral Analysis
Some of the specific parameters that are monitored are:
" Temperature * Algae
" PH & alkalinity * Giardia cysts
" Chlorine residual * Trihalomethanes (THM)
" Turbidity * Haloacetic Acids (HAA)
" Dissolved oxygen * Total organic carbon (TOC)
" Total dissolved solids * Odor & taste (non-electronic
* Fecal coliform levels monitoring)
The effect of an introduction of chemicals into a distribution network cannot be monitored immediately, but must be performed downstream after some mixing has taken place and the concentration of treatment chemical has balanced throughout the flow. For this reason, chemical monitors are frequently installed downstream from the point of introduction. The amount of the treatment chemical used needs to be proportionate to the flow, so it is also necessary to be monitoring the flow either directly at or shortly before the treatment location. Most chemical sensors are some form of a probe that is permanently immersed in the flow and registers the concentration of a substance. An inherent problem is the build up of clogs and biofilm on the sensor, which can result in inaccurate
readings. Because of this, there is some reluctance to put a lot of trust in the readings from chemical monitoring systems, unless they are frequently and
Massachusetts Institute of Technology
Architecture of Near Real-Time Monitoring Systems for Water Distribution Systems Sebastian B6gershausen
thoroughly maintained. In a system as large as the MWRA's, it can be difficult to ensure maintenance of such a nature.
Historical information is considered necessary to acquire a more reliable profile of the water quality. An experienced operations manager needs to evaluate the report of the concentrations of all dissolved chemicals as well as the quantity of the treatment chemicals used. Judging by the amounts of treatment chemicals used in the past under similar circumstances, he/she can ascertain how much trust can be given to the monitored profile.
The MWRA has a branch that deals specifically with industrial effluent and treatment plant effluent monitoring called TRAC (toxic reduction and control). For the most part, their duty is to locate dissolved and particulate metals in both sludge and effluent. Since sludge is frequently used as fertilizer, the presence of such substances needs to be monitored. One of the largest sources of metal contaminants is the use of molybdenum as a corrosion inhibitor in water that flows through cooling towers for large air-conditioning systems. The hotter the season, the higher the concentrations of molybdenum in the incoming water of a treatment plant will be.
The hardware used to transmit data from biosensors to the central operations control center is either leased lines from PSTN, hardwired cables (local in treatment facilities) or radio transmission. There have been attempts to install systems that use PSTN without leased lines, which instead use a modem to dial up the central control center and report a possible alarm status. However, these attempts have been unsuccessful since there were so many system failures that ultimately significantly reduced trust in the system. Some monitors did not report alarm status due to the power source running out (in the case of a battery driven unit), others reported alarm status erroneously. The MWRA is currently searching for a more reliable system that features a constant power source.
Corrosion monitoring of drinking water as well as sewage has been a crucial to the system performance determination, since it gives an indication of how soon maintenance work will need to be performed. This is an important consideration for the MWRA, and so an efficient and reliable system has been installed to monitor the aggressiveness of the environment. In addition to chemical sensors to acquire the pH and alkalinity of the water, this system includes sensors on the monitoring equipment to keep track of the performance of apparatus. Parameters such as temperature and vibration of pumps and meters are monitored to give an indication of system performance.
Massachusetts Institute of Technology
Architecture of Near Real-Time Monitoring Systems for Water Distribution Systems Sebastian B6gershausen
3.4 Simulation/Modeling
The MWRA uses simulations of their water operations for both of their networks, the distribution and sewage networks. Modeling is used for the hydrological design and planning of future conditions or system expansions. For the sewage network, it is also used to estimate the current system state and performance, since there is fewer accurate flow data available. Monitoring sewage flow is complicated since large suspended solids in the water can collide with measuring apparatus and break or clog the machinery.
Modeling the current performance of the network is useful when a measuring device is malfunctioning or other unknown factors become important. The known measurements and boundary conditions are used to create a simulation of the network and estimate unknown values at another point. Although known readings for flow are taken into account, the MWRA does not base their simulation entirely on this data. Measurement inaccuracies as well as erroneous information on the degree to which a valve is opened could easily produce inaccurate results from the simulation. To avoid these problems, the MWRA's modeling software calculates the pressure gradient throughout the network and bases the resulting estimates on this gradient instead. Taking into account the boundary conditions and the flow data, the simulation can neglect flow readings that are not within a reasonable threshold of where they should be based on the valve and reservoir conditions.
For the purposes of modeling a hypothetical situation such as partial network shutdowns due to maintenance, a proposed system expansion, or a rain storm, the MWRA collects data from their flow meters and attempts to use it directly (rather than calculate a gradient). Historical data can provide useful information on a town's usage or seasonal variations in inflow and outflow, and for estimating future conditions at a distinct location, operational managers at the MWRA tend to put more trust in this data than the results of a simulation. The collected data is fed into a model that calculates a system response and allows the manager to take appropriate action. Many times construction schedules and plans for line diversions to accommodate large inflows are made based on these simulations. The MWRA's simulations are also used to design system expansions and
perform optimization studies. Parameters that need to be taken into account for these applications include seasonal water table variations and precipitation data, flood plain modeling and backwater curve analysis. The network needs to be designed to meet safety conditions, but all within reason. Design for a 1000-year flood might be safe, but not cost efficient, while design for a 1-year flood is cost efficient, but not safe. The resulting design will thus have to take into account that at (rare) times, the network will be totally overloaded and unable to drain the water shed quickly enough to avoid flooding. An analysis of how much water the
Massachusetts Institute of Technology
Architecture of Near Real-Time Monitoring Systems for Water Distribution Systems Sebastian B6gershausen
system can handle and the magnitude and time-frame of build-up of overflow behind the system produces a backwater curve that allows the estimation of how long it will take to drain a flood and how high a flood level can be. In addition, the simulation can attempt to find an optimal path for draining the watershed, based on current network load and paths.
3.5 MWRA's SCADA System
The MWRA has a SCADA (Supervisory Control And Data Acquisition) system that runs on a central server and is administered by their MIS (Management Information Systems) department. The system runs the engineering and monitoring applications and allows the staff to access data and applications remotely. It manages both the sewage and drinking water operations and monitoring. There are two Oracle databases on the server; one holds the monitoring data for the drinking water and sewage systems, while the second database holds the TRAC (Toxic Reduction And Control) data.
The tool that staff uses to view the data on the SCADA system is called Process Book and utilizes a tab-based navigation system to view the results of the different biochemical and hydrological monitoring parameters. Process Book pulls together data sources from various different locations on the server to display the results and supports instant querying of some sources (most measurement parameters are updated every two seconds). For staff who need to work from their home, Process Book allows remote access with a dial-up modem.
The MWRA plans to make their SCADA system accessible over the Internet, which they anticipate to be useful to town water managers throughout eastern Massachusetts. A web site will display selected parameters to the MWRA customer who accesses it though a web browser. The system data are available in near-real time (the system updates every 15 seconds) and are viewable in number and graphic format.
The MWRA SCADA system is still under construction and it not anticipated to be fully completed until 2007. The process of designing the system began in 1986, but a full proposal was not completed until 1993. Installation began on pilot projects in 1996 and since then slowly but surely all apparatus and departments are switching over to the new system. This process is taking long because the operational area and complexity of the MWRA system is so large and in many cases customized applications need to be build to manage the data sources and transfer.
Massachusetts Institute of Technology
Architecture of Near Real-Time Monitoring Systems for Water Distribution Systems Sebastian B6gershausen
4 Arlington Remote Monitoring Software General Description
4.1 Overview
The Department of Public Works of the town of Arlington, Massachusetts, decided in the year 2000 to improve their existing water meter reading process
by installing wireless transmitters on all the roughly 12,200 meters throughout the
town. The town's incentive to install this system was to improve the knowledge and understanding of the local water usage, optimize the billing service, and potentially lower the operating cost of the water department.
Prior to the installation of the wireless monitoring system, the town received their readings by having a town employee connect a handheld meter-reading gun to the meter twice a year. This collected one reading that related six month's worth of flow. Upon installation of the transmitters, the town will be capable of taking readings as frequently as every 10 minutes, allowing a much higher accuracy in its water supply related analytical and administrative tasks.
The only type of reading the town monitors is the flow through each meter. There is currently no plan to install any other types of reading systems (pressure, biochemical composition, etc.) and for the purposes of the town, there will most likely not be a need for any other type of metering service. Although the Arlington's water supply network is divided into pressure zones, the pressure is maintained and monitored by the regional water resources authority and so relieves the town of Arlington from having to monitor these parameters. In addition to the consumer meters, the town will also monitor the flow through pressure relief valves that allow cross flow between the pressure zones.
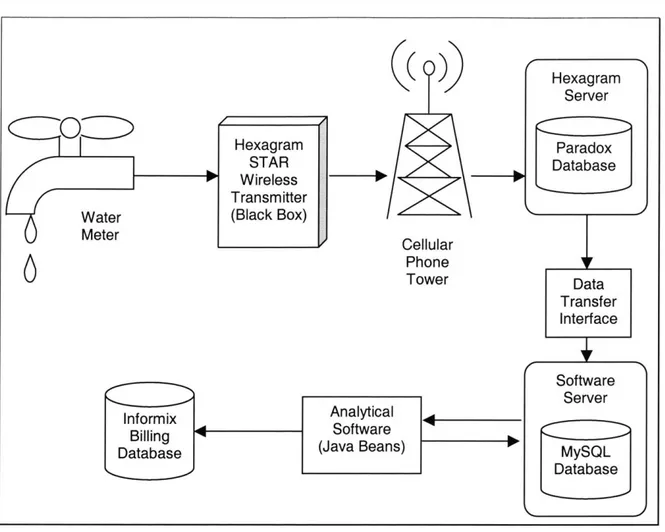
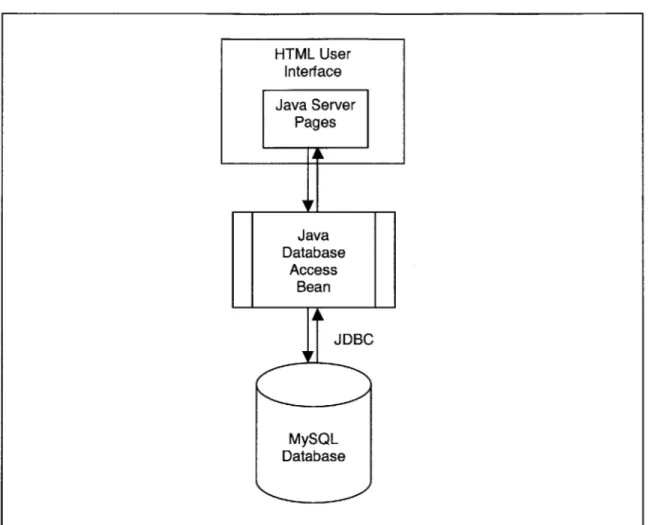
Water meters register the flow (normally an analog reading) and a Hexagram STAR AMR@ wireless transmitter sends the reading to a cellular tower. There are five of these towers placed on public buildings throughout the town that provide the cellular coverage. The readings are stored on a Hexagram server until they are downloaded to a MySQL database, which in turn resides on a server that is dedicated to the water management system. Also on this server is the analytical software required to perform several interpretive functions (see
below). The town Treasurer's current billing system, the ICS (Integrated Collection System), operates an Informix database that receives monthly data transfers from the MySQL database through the analytical software.
This high-level system architecture is shown below: