Automatically identifying critical
input regions and code in applications
The MIT Faculty has made this article openly available.
Please share
how this access benefits you. Your story matters.
Citation
Michael Carbin and Martin C. Rinard. 2010. Automatically identifying
critical input regions and code in applications. In Proceedings of
the 19th international symposium on Software testing and analysis
(ISSTA '10). ACM, New York, NY, USA, 37-48
As Published
http://dx.doi.org/10.1145/1831708.1831713
Publisher
Association for Computing Machinery
Version
Author's final manuscript
Citable link
http://hdl.handle.net/1721.1/62576
Terms of Use
Creative Commons Attribution-Noncommercial-Share Alike 3.0
Automatically Identifying Critical Input Regions and Code
in Applications
Michael Carbin
MIT CSAIL, MIT EECS Cambridge, Massachusetts, USA[email protected]
Martin Rinard
MIT CSAIL, MIT EECS Cambridge, Massachusetts, USA[email protected]
ABSTRACT
Applications that process complex inputs often react in dif-ferent ways to changes in difdif-ferent regions of the input. Small changes to forgiving regions induce correspondingly small changes in the behavior and output. Small changes to critical regions, on the other hand, can induce dispropor-tionally large changes in the behavior or output. Identifying the critical and forgiving regions in the input and the cor-responding critical and forgiving regions of code is directly relevant to many software engineering tasks.
We present a system, Snap, for automatically grouping related input bytes into fields and classifying each field and corresponding regions of code as critical or forgiving. Given an application and one or more inputs, Snap uses targeted input fuzzing in combination with dynamic execution and influence tracing to classify regions of input fields and code as critical or forgiving. Our experimental evaluation shows that Snap makes classifications with close to perfect preci-sion (99%) and very good recall (between 99% and 73%, depending on the application).
Categories and Subject Descriptors
D.2.5 [Testing and Debugging]: Code inspections and walk-throughs, Testing tools, Tracing; D.2.8 [Metrics]: Com-plexity measure, Software science; F.3.2 [Semantics of Pro-gramming Languages]: Program analysis
General Terms
Experimentation, Measurement
Keywords
Critical input, Forgiving input, Critical code, Forgiving code
1.
INTRODUCTION
Many applications process complex, highly structured in-puts. Small changes in some regions of the input can induce correspondingly small changes in the behavior and output of the application. We call such regions forgiving regions, because the application exhibits a small, forgiving response
Permission to make digital or hard copies of all or part of this work for personal or classroom use is granted without fee provided that copies are not made or distributed for profit or commercial advantage and that copies bear this notice and the full citation on the first page. To copy otherwise, to republish, to post on servers or to redistribute to lists, requires prior specific permission and/or a fee.
Copyright 200X ACM X-XXXXX-XX-X/XX/XX ...$10.00.
to changes in the region. But changes in other regions (such as regions that contain metadata summarizing the format of subsequent regions) can have a much larger impact — they can dramatically change the behavior and output of the application. We call such regions critical regions. Un-derstanding the differences between such input regions (and the corresponding critical and forgiving regions of code that process data derived from different input regions) can be important for a variety of software engineering tasks:
• Program Understanding: Information about which regions of the input each region of the application pro-cesses, along with an understanding of which regions of the input and application are critical and forgiv-ing, can help developers better understand the appli-cation’s structure and responses to different inputs. It can also productively inform activities such as mainte-nance and the development of new functionality. • Unsound Transformations: Principled but unsound
program transformations have been shown to provide a host of benefits, including enhanced robustness and security [25, 17, 20, 22], improved performance and power consumption [15, 22, 24, 10], and efficient paral-lel execution [14]. Distinguishing forgiving and critical code may help identify appropriate forgiving targets for unsound transformations that may change the re-sult that the computation produces.
• Defect Triage: Many software projects have more defects than they can reasonably attempt to correct. Because of the dramatic effect that critical input re-gions can have on the computation, it can be difficult to comfortably predict the consequences of defects in critical code (which processes critical data). An effec-tive defect triage policy may therefore prioritize defects in critical code over defects in forgiving code (which processes forgiving data).
• Test Input Selection: Because critical input regions can have such dramatic effects on the behavior of the computation, test suites should provide particularly detailed coverage of these critical regions. The rel-atively simpler response function of the application to forgiving input regions makes it feasible to include fewer test cases for these regions in the test suite. • Input Sanitization: Input sanitization is a common
approach to protecting applications that are exposed to potentially hostile inputs [23]. Understanding char-acteristics of the input format, including distinctions between critical and forgiving regions of the input, can be essential to engineering an effective sanitizer.
1.1
Critical Region Inference
We present a system, Snap, for automatically grouping related input bytes into fields and classifying each field and the corresponding regions of code that access data derived from that field as critical or forgiving. Snap’s classification algorithms work with trace information from instrumented executions of the application. The execution trace contains the sequence of executed branch instructions, which enables Snap to reconstruct the set of executed basic blocks. The influence trace records, for each executed instruction, the in-put bytes that influenced the operands of the instruction [9]. Given an application and several representative inputs, Snap performs the following steps:
• Baseline Execution: Snap executes an instrumented version of the application on a set of representative inputs to record its baseline execution and influence traces. Snap uses these traces to establish baselines for the normal behavior of the application.
• Input Specification Inference: Snap uses the base-line influence traces to group adjacent input bytes into fields — it groups adjacent bytes into the same field if they often both influence operands of the same ex-ecuted instructions (Section 3.2). Snap will generate the critical versus forgiving input region classification at the granularity of fields.
• Instrumented Executions on Fuzzed Inputs: Snap next generates a suite of fuzzed inputs. It generates each fuzzed input by fuzzing a different inferred field of an original representative input. Snap then executes the application on each fuzzed input to produce a set of execution traces, one for each fuzzed input. • Field Classification: Given the baseline execution
traces, the baseline influence traces, and the fuzzed execution traces, Snap uses hierarchical agglomerative clustering [28] to classify each input field as critical or forgiving (Section 3.4). If fuzzing the field causes a fuzzed execution trace to deviate significantly from the corresponding baseline execution trace, or if the field influences one or more operands of a large proportion of the executed instructions, Snap classifies the field as critical. Otherwise, it classifies the field as forgiving. • Code Classification: Given the input field
classifi-cations and the baseline influence traces for all repre-sentative inputs, Snap uses hierarchical agglomerative clustering [28] to classify each executed basic block as critical, forgiving, mixed, or neither (Section 3.5). Con-ceptually, a basic block is critical if the operands of its instructions are derived primarily from critical input fields. A basic block is forgiving if the operands of its instructions are derived primarily from forgiving input fields. A basic block is mixed if the operands of its instructions are influenced by the input, but neither critical nor forgiving fields dominate the influence. If the operands of the basic block’s instructions are not influenced by any fields of the input, then Snap classi-fies the block as neither.
1.2
Experimental Evaluation
To evaluate Snap’s automatic classification technique, we first acquired a set of benchmark applications and represen-tative inputs. We then used Snap to 1) group the bytes of the sample inputs into fields, 2) classify the input fields, and 3) classify the executed blocks of code.
1.2.1
Input Field Classification
We use manually developed test oracles (which are as-sumed to be completely accurate) to evaluate the accuracy of Snap’s input field classification. The test oracle for each benchmark application compares each fuzzed output (the output that the application produces when run on the corre-sponding fuzzed input) with the output that the application produces when run on the corresponding original (unfuzzed) representative input. The oracle uses this comparison to classify each input field as either critical or forgiving. Note that the test oracle is not required for a developer to use Snap in the field — we use the test oracle only as means to experimentally evaluate the accuracy of Snap’s classification for our benchmark applications.
To evaluate the accuracy of Snap’s input field classifica-tion, we compare its classification with the classification that the test oracle produces. This evaluation indicates that:
• Precision: The precision of the critical classification is extremely high — over 99% for all of our bench-marks. The precision numbers indicate whenever Snap classifies a field as critical, the oracle almost always also classifies the field as critical.
• Recall: The recall of the critical field classification is high, but not as high as the precision. Specifically, for our set of benchmark applications, the recall ranges from over 99% to as low as 73%.
1.2.2
Code Classification
We evaluate the utility of Snap’s code classification by manually examining classified regions of each benchmark application. In general, we find that there are two kinds of critical code regions: behavior-critical regions, which typ-ically process file metadata, select application features to in-voke, or manipulate application data structures, and output-critical regions, which typically process the central input file data (for our benchmark applications, image data). Snap classifies a code region as behavior-critical if it primarily accesses data derived from input fields that are critical be-cause they have a large impact on the behavior of the ap-plication (as measured by the set of executed basic blocks). Snap otherwise classifies a code region as output-critical if it primarily accesses data derived from input fields that are critical because they influence at least one operand of a large proportion of the executed instructions. Mixed regions are typically utilities invoked from a variety of contexts within the application.
1.3
Contributions
This paper makes the following contributions:
• Basic Concept: It identifies the concepts of critical and forgiving input fields and the corresponding con-cepts of critical and forgiving regions of code. • Automatic Inference Algorithm: It shows how
to use influence tracing, execution tracing, and input fuzzing (at the granularity of the inferred input fields) to automatically classify input fields and regions of code as critical or forgiving.
The automatic inference algorithm further divides crit-ical fields and data into behavior-critcrit-ical fields (changes to behavior-critical fields induce large changes to the set of basic blocks that the application executes) and output-critical fields (which influence a large propor-tion of the executed instrucpropor-tions).
• Experimental Results: It presents experimental re-sults that show that, for our set of benchmark pro-grams, Snap exhibits exceptional precision in its classi-fication of critical input fields and exceptional to good recall in this classification.
• Qualitative Evaluation: An examination of the clas-sified input fields and regions of code in our benchmark applications indicates that Snap can capture meaning-ful and usemeaning-ful distinctions between the different roles that fields and regions of code with different classifica-tions play in the computation.
Section 2 presents an example that illustrates how Snap automatically classifies input fields and regions of code. Sec-tion 3 discusses the design of Snap. SecSec-tion 4 presents the details of Snap’s implementation. Section 5 provides an ex-perimental evaluation of the quality and relevance of Snap’s classifications for several benchmark applications. Section 6 discusses several threats to the validity of our conclusions. Section 7 discusses the related work. We conclude in Sec-tion 8.
2.
EXAMPLE
The Graphics Interchange Format (GIF) is a widely used image file format. Each GIF file consists of the following data regions:
• Metadata: Regions of the input that define the struc-tural layout of the input itself. This information in-cludes the size of individual data items and field de-limiters that allow an application to navigate an input. • Parameters: Regions of the image that define param-eters that control various aspects of the computation and the output that it generates. These parameters include the height and width of the output and the compression type of the image.
• Palette: A region of the input that contains the color table of the image. Each entry in the color table spec-ifies a color value. The color of each pixel in the image is encoded by an index into the color table.
• Data: Regions of the input that contain the image data itself. Each region contains a compressed se-quence of indices into the color table. Each region occupies a contiguous block of the input file; a separa-tor character that appears before each region specifies the length of that region.
• Comments: Regions that contain textual comments associated with the image. These regions allow image encoders to embed extra annotations, such as the name of the encoder, into the image file.
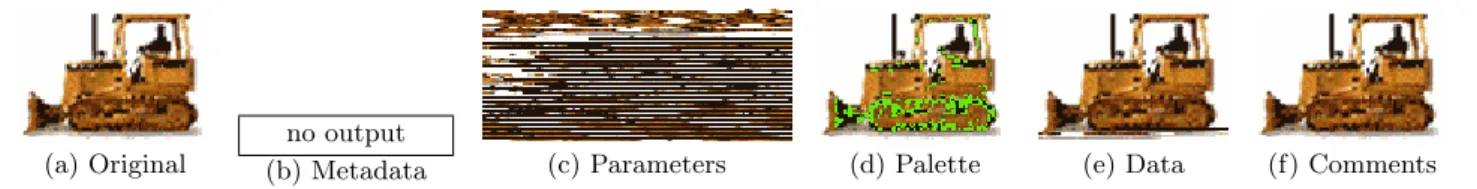
Changes or corruptions to different regions of a GIF file can have different effects on the final rendered image (and the be-havior of the application that decodes the image). Each im-age in Figure 1 (except for the original imim-age in Figure 1(a)) presents a decoded GIF image after randomly fuzzing one of the fields in the original GIF file.
This collection of images illustrates how fuzzing different regions can have dramatically different effects on the final decoded image. In particular, some input fields are critical to the quality (or even presence) of the decoded output im-age while other regions leave the decoded imim-age largely or even completely intact.
The metadata region of the input is critical because a metadata corruption makes the decoder unable to parse the
file and produce an output image. Similarly, a corruption to the critical parameters region causes substantial distor-tion in the output; the output has different dimensions and the content bears no resemblance to the output of the de-coder on the original image. Heavily referenced parts of the palette are also critical because changes to these parts of the palette can visibly distort large portions of the decoded im-age. Infrequently referenced portions of the palette (and, of course, portions that are not referenced at all) are forgiving because they have little or no impact on the decoded image. The data regions of the image are not necessarily critical to the quality of the output. The image for the data region (Figure 1(e)) shows the effects of fuzzing a data region (re-call that each data region contains a sequence of compressed color table indices) that occurs near the end of image. In this case, there is a small amount of localized distortion at the bottom of the image. In general, the criticality of a given data region depends on its position in the image file. Because of the compression algorithm used to encode the image, each encoded pixel influences all subsequent encoded pixels. So data regions that occur early in the file are critical, while data regions that appear late in the file are forgiving. The comments region of the input is forgiving. In this ex-ample, text comments have no semantic influence on image rendering and, therefore, do not affect the output.
Each of these input regions is typically processed by a different region of application source code: metadata navi-gation code is distinct and separate from the code that pro-cesses the parameters, palette, data, and comments. It is therefore possible extend the classification system to regions of code. For example, the DGifGetImageDesc function of the GIF image library reads and validates an image’s descriptor (which contains of the image parameters). It is therefore critical because a programmer error that causes this code to process the parameters incorrectly could cause substantial distortion in the output.
Snap contains a set of components that work together to automatically infer these kinds of classifications:
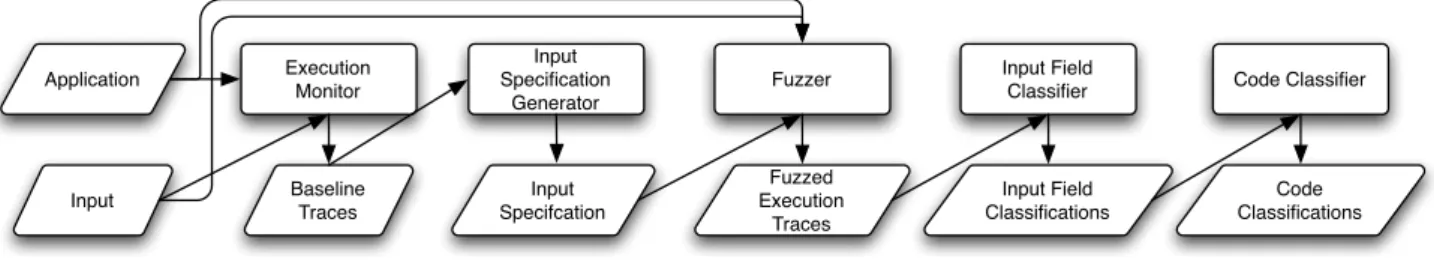
Execution Monitor: Monitors the execution of the de-coder on a GIF input to record the dede-coder’s execution and influence traces. Snap’s other components use the trace in-formation to group input bytes into fields, classify fields as critical or forgiving, and extend the field classification to the application code.
Input Specification Generator: Uses the influence trace to infer an input specification. This specification groups ad-jacent input bytes that appear in operands of the same in-struction together into fields. This component enables Snap to, for example, group the individual bytes of the GIF in-put fields that encode integer values (such as the width and height of the image) together into fields.
Fuzzer: Uses the inferred input specification to produce a suite of fuzzed GIF image files. Snap produces this fuzzed input suite by iterating over all the fields in the input field. It generates several fuzzed input files for each field by setting the field to extremal values (with the rest of the file left un-changed). Snap then executes the instrumented decoder on each fuzzed input file to produce an execution and influence trace for each fuzzed file.
Field Classifier: Uses the execution and influence traces from the executions of the decoder on the fuzzed input file suite to classify each field as either critical or forgiving:
(a) Original
no output
(b) Metadata (c) Parameters (d) Palette (e) Data (f) Comments Figure 1: Selectively Fuzzed GIF Images
• Behavior-Critical Fields: If fuzzing the field pro-duces a large change in the internal behavior of the decoder (i.e., produces large changes in the set of basic blocks that the decoder executes), then Snap classifies the field as critical. In our GIF example, Snap observes that fuzzing metadata and parameter fields produces large changes in the internal behavior of the decoder. It therefore classifies these fields as critical.
• Output-Critical Fields: If fuzzing the field does not produce large changes in the internal behavior, Snap next uses the influence trace from the execution on the original (unfuzzed) input to determine if the field influences more than a given threshold proportion of the executed instructions. If so, Snap classifies the field as critical, otherwise it classifies the field as forgiving. For example, Snap classifies parts of the color table as critical because many pixels in the image reference those parts (so those parts influence the operands of the many executed instructions that process those pix-els). It also classifies data regions that appear early in the file as critical because they influence operands of instructions in the decompression computation for all subsequent data regions. But it classifies data re-gions that appear late in the file as forgiving because they influence only a relatively small percentage of the executed instructions. Similarly, it classifies the com-ments region as forgiving because the comcom-ments influ-ence a very small percentage of the executed instruc-tions.
Code Classifier: Uses the influence traces from the origi-nal unfuzzed inputs to determine, for each basic block in the decoder, which input fields influence the values that the in-structions in the basic block manipulate. Snap then extends the field classification to classify each basic block as either critical, forgiving, mixed, or neither. In this example, Snap determines that the code that manipulates the metadata, parameters, and palette is critical, and code that manipu-lates the comments is forgiving. Although the code that manipulates the compressed pixel data touch fields of mul-tiple classifications (because early data regions are critical while late data regions are forgiving), the Code Classifier determines that data processing code primarily deals with critical data and classifies this code as critical. The Code Classifier additionally identifies general purpose utility func-tions used internally within the application as mixed because they are used in multiple contexts.
3.
SYSTEM DESIGN
In this section we discuss the design details of each of Snap’s components. Figure 2 presents the design of Snap as a box and arrow diagram. The boxes represent components; the arrows represent the primary interactions between com-ponents. We discuss each component in turn.
3.1
Execution Monitor
The Execution Monitor takes an instrumented application and a test input. It runs the application on the input and records the application’s execution trace and influence trace: • Execution Trace: The sequence of control transfer instructions (branch, function call, and return instruc-tions) executed during the run of the application. Each entry in the execution trace contains a reference to the executed control transfer instruction and the ba-sic block to which it transferred control. Snap uses the execution trace to compute the set of basic blocks executed during the run of the application.
• Influence Trace: The sequence of instructions exe-cuted during the run of the application, including in-formation that characterizes how input bytes influence the operands of the instruction. Each entry in the fluence trace contains a reference to an executed in-struction and (conceptually), for each operand of the instruction, a set of input bytes that influence the operand. The set is encoded as a tree that traces out the sequence of instructions that produced the value of the operand. Each internal node in the tree represents a previously executed instruction and the correspond-ing operand that it produced. Each internal node con-tains a list of references to the nodes that produced the executed instruction’s operands. Each leaf of the tree specifies a set of adjacent input bytes that were read from the input. To compute the set of bytes that in-fluence a given operand, Snap traverses the tree to find all input bytes in leaves reachable from the operand.
3.2
Input Specification Generator
The Input Specification Generator groups adjacent input bytes into fields. Let i and j denote two adjacent input bytes, Ei be the number of executed instructions whose
operands are influenced by i and not influenced by j, Ej
be the number of executed instructions whose operands are influenced by j and not influenced by i, and Eijbe the
num-ber of executed instructions whose operands are influenced by both i and j. We then define the affinity Aij of i and j
as follows:
Aij=
Eij
Ei+ Ej+ Eij
(1) The input specification generator groups i and j into the same field if 0.75 ≤ Aij. We empirically determined the
value of this threshold early on in the development process of Snap before applying Snap to the GIF and JPEG bench-marks. We found that, in practice, the threshold is robust — any value reasonably close to 0.75 is an effective threshold.
Input Specification
Generator
Input Specifcation
Fuzzer Input Field
Classifier Code Classifier
Fuzzed Execution Traces Execution Monitor Baseline Traces Input Field Classifications Code Classifications Application Input
Figure 2: The Design of Snap
3.3
Fuzzer
Given an input and a grouping of the bytes into fields, the Fuzzer produces a suite of fuzzed inputs by fuzzing each field of the input in turn. For each input field, the Fuzzer creates a collection of fuzzed inputs. Each fuzzed input is the same as the original input except for the value in the fuzzed input field, which (in the current implementation) is set to an extremal value (either all 0s or all 1s). Other fuzzing strategies (such as setting the input field to pseudorandomly selected values) are also possible. The rationale for using extremal values is that extremal values have been shown to push applications towards outlier behaviors [9]. In this way the Fuzzer produces a suite of fuzzed inputs, with each fuzzed input differing from the original input at one of the input fields. The Fuzzer then runs the application on each fuzzed input to produce a suite of fuzzed execution traces, one for each fuzzed input.
3.4
Field Classifier
The Field Classifier classifies each input field as either critical or forgiving. It first uses the behavioral distance to determine if the value of the field substantially influences the set of basic blocks that the application executes. If so, it classifies the field as critical and more precisely, as behavior critical. Otherwise, it uses the output influence to determine if the field influences one or more operands of a substantial proportion of the executed instructions. If so, it classifies the field as critical and more precisely, as output critical. Otherwise, it classifies the field as forgiving.
3.4.1
Behavioral Distance
The behavioral distance is a number in [0, 1] that measures the similarity between two executions of an application. If the behavioral distance is 0, the executions had identical behavior. If it is 1, the applications had no behaviors in common. We make this concept precise as follows. For an execution i of the application, Bi denotes the set of
exe-cuted basic blocks (the Field Classifier computes this set by inspecting the branch events of the execution trace). The behavioral distance is the normalized Hamming distance Dij
between the two sets of executed basic blocks:
Dij=
|Bi∆Bj|
|Bi∪ Bj|
(2) Here Biis typically the set of basic blocks for a baseline
execution; Bj is typically set of basic blocks for an
execu-tion on a fuzzed input. The results presented in Secexecu-tion 5 indicate that behavioral distances correlate with large dif-ferences in the qualitative behavior of the application.
The Field Classifier next uses this measure in combina-tion with hierarchical agglomerative clustering [28] to find,
for the application at hand, a good separation between criti-cal and forgiving input fields. The clustering algorithm first computes, for each field, the maximum behavioral distance (over all fuzzings of that field) between the baseline execu-tion and the execuexecu-tions on the corresponding fuzzed inputs. This maximum distance is the behavioral distance for that field. It then assigns each field to its own cluster, then iter-atively merges the two closest clusters (where the distance between two clusters is the minimum difference between the behavioral distance of a field in one cluster and the behav-ioral distance of a field in the other cluster). The result is a dendrogram, or binary tree. Each internal node of the tree represents a cluster that was produced during the merg-ing process. Each leaf node represents a smerg-ingle input field; the root node represents the cluster that contains every field. The root has two children, one of whose behavioral distances are smaller than the other. These two children are the crit-ical and forgiving field clusters; the forgiving cluster is the one whose fields have the smaller behavioral distances. In this way the classifier adapts its classification scheme to the characteristics of the application at hand.
3.4.2
Output Influence
The Field Classifier inspects the influence trace of the baseline execution to compute each field’s output influence. The output influence of a field is the proportion of the ex-ecuted instructions that have at least one operand whose value the field influences. The Field Classifier classifies all input fields with an output influence over a parameterized threshold as critical.
Output influence is designed to capture the influence of an input field on the quality of the output. In general, the threshold should be set according to a) the anticipated cor-relation between how often the application uses data derived from the field and b) the threshold above which quality loss constitutes a critical change in the output. For our experi-ments in Section 5 we set this threshold to be 0.1 (i.e., 10%).
3.5
Code Classifier
The Code Classifier first classifies all basic blocks whose operands are not influenced by the input as neither. It clas-sifies the remaining basic blocks as follows.
For each operand of each executed instruction, the Code Classifier computes the influence value of that operand, which is the mean, over all input fields that influence the operand, influence metric of the input field, where the influence met-ric is 0 if the field is forgiving and 1 if the field is critical. For each executed basic block, the Code Classifier then com-putes the mean and standard deviation, over all executions of the basic block, influence value of the operands that the execution of the basic block accesses.
The Code Classifier next uses hierarchical agglomerative clustering (see Section 3.4.1) on the standard deviations to divide the basic blocks into a cluster with low standard de-viations and a cluster with high standard dede-viations. Snap classifies all basic blocks in the high standard deviation clus-ter as mixed. It then classifies all basic blocks in the low standard deviation cluster as either forgiving (if the com-puted mean influence value is less than 0.5) or critical (if the mean is greater than 0.5).
The rationale for this classification scheme is that if there is a high standard deviation, then the basic block tends to access data that is significantly influenced by both forgiving and critical input fields. If there is a low standard devia-tion, the basic block tends to access data with one primary influence (either forgiving or critical) and the mean indicates which influence predominates.
4.
IMPLEMENTATION
As described in Section 3.1, the Execution Monitor records an application’s execution trace and influence trace during the execution of the application. Each trace can be viewed as a sequence of events in which each event corresponds to an executed instruction. Snap statically instruments the source of the application to produce a new, instrumented applica-tion. When executed, the instrumented application coor-dinates with a dynamically loaded runtime to manage and record the execution trace and influence trace.
4.1
Instrumentor
Snap contains a static source code instrumentor built on top of the Low Level Virtual Machine (LLVM) compiler infrastructure [11]. LLVM provides a language and plat-form independent Intermediate Representation (IR), an in-trospection library, and an extensible compiler that makes it possible to easily manipulate and generate native code for applications compiled to the LLVM IR. Though Snap’s work-flow currently works with the source of the application, the instrumentor could target any language, including assembly language, for which there exists a mechanism to translate the language to LLVM IR . The LLVM project currently pro-vides translators for C, C++, Microsoft Intermediate Lan-guage (MSIL), Java bytecode, Fortran, and Ada.
The instrumentor instruments the instructions with addi-tional code to coordinate with the runtime. Each fragment of instrumentation code calls into the runtime to record an entry in either the execution trace or the influence trace of the application.
4.1.1
Execution Trace
The instrumentor augments control transfer instructions (i.e. function call, function return, and branch instructions) with code that records the identifier of the control transfer instruction and the identifier of the basic block to which it transfers control. For example, the entry in the execution trace for a branch instruction contains the identifier of the branch instruction and the identifier of the basic block to which it transferred control.
4.1.2
Influence Trace
The instrumentor also augments each instruction with additional code to insert entries into the influence trace. For arithmetic/logical instructions (e.g., instructions with operands of integer or floating point type), the additional
code records an influence trace entry that captures the di-rect influence of the operands on the result of the instruction. The entry contains the identifier of the instruction and, for each operand of the instruction, a reference to the influence trace entry for that operand.
For instructions that dereference a pointer operand, the additional code records the direct influence information for the contents of the referenced memory. For example, the store instruction instrumentation records an entry that prop-agates influence from the stored operand to the memory lo-cation into which it stores the operand.
Although the instrumentor and runtime coordinate to track direct influence, the two components do not coordinate to track indirect influence. For load and store instructions, in-direct influence would additionally propagate the influence information for the pointer operand itself to either the out-put or inout-put operand, respectively. This information would, for example, propagate influence from the the index of an array access instruction to the accessed value. For control transfer instructions, the instrumentor and runtime do not coordinate to track indirect control influence information. For example, if an input field influences a branch condi-tion, the system will not propagate the influence informa-tion for the condiinforma-tional to the instrucinforma-tions that are control-dependent on the branch.
4.2
Runtime System
In addition to an instrumentor, the Execution Monitor also contains a runtime system. The runtime consolidates the majority of the logic required to access and manage the execution trace and the influence trace. Each fragment of instrumentation code typically contains at least one call into the runtime. The runtime provides the Execution Monitor with the following components:
Trace Manager: At its core, the trace manager maintains a large buffer of events. The trace manager provides an API that allows the Execution Monitor to record execution trace entries and influence trace entries to the buffer. As the Execution Monitor adds entries to the buffer, the trace manager first serializes and compacts the buffer. The trace manager then directs the buffer either to disk or to one of Snap’s analysis components (e.g. the Input Specification Generator).
Shadow Operands and Shadow Memory: For each in-struction that the application executes, the Execution Mon-itor tracks the influence information for the instruction’s input and output operands. The Execution Monitor uses shadow operands to hold influence information for instruc-tion operands and shadow memory to hold the influence information for memory locations.
Shadow Operand Stack: Applications compiled for LLVM may optionally pass function arguments and receive function return values as operands in addition to passing arguments through memory on the stack. The Execution Monitor uses the shadow operand stack to pass influence information for the arguments to a function call and receive influence infor-mation for the return values of a function call.
Shadow File System: The shadow file system provides the Execution Monitor with a mechanism to intercept UNIX file system calls, such as open, read, and write. This allows the Execution Monitor to automatically identify the appli-cation’s external inputs.
External Library Model: Although the Execution Mon-itor instruments the entire application, an application may invoke functions in a support library for which the source is not available. To more accurately capture the behavior of the application, the runtime contains a suite of models of the execution and influence traces for several commonly used library functions. For example, the runtime contains models for many functions in the C standard library, such as memcpy and memset.
5.
EVALUATION
This section presents our experimental evaluation of the quality of Snap’s input field and code classifications.
5.1
Benchmarks
We evaluate Snap’s classification approach on three bench-mark applications. All three are written in C; all three process image files to convert an image file into bitmap file (BMP format) for presentation to the user:
• GIF: The GIF benchmark processes image files in GIF format. It consists of 5K lines of code.
• PNG: The PNG benchmark processes image files in PNG format. It consists of 36K lines of code (including 11K lines of code from the zlib compression library). • JPEG: The JPEG benchmark processes image files in
JPEG format. It consists of 35K lines of code.
5.2
Test Oracle
To evaluate the accuracy of Snap’s input field classifica-tion, we developed a set of application-specific test oracles (which we assume classify input fields with perfect accu-racy). Given two outputs, one from an original (unfuzzed) input and the other from a corresponding fuzzed input (iden-tical to the original input except for the fuzzed field), each test oracle produces a test distance between the two outputs. The test distance is a number in the interval [0, 1], with 0 indicating identical outputs and 1 indicating maximally dif-ferent outputs. For all of our benchmark applications we use the normalized Hamming distance (as defined in Sec-tion 3.4.1) over the pixels in the final rendered image as the test distance.
Each oracle uses a test threshold (a number in the interval [0, 1]) to classify fuzzed input fields as critical or forgiving. In general, each input field may be fuzzed with several differ-ent values; each value produces a differdiffer-ent fuzzed input file. If all of the fuzzings produce test distances below or equal to the test threshold, the oracle classifies the field as forgiv-ing. Otherwise (i.e., if at least one of the fuzzings produces a test distance above the test threshold), the oracle classi-fies the field as critical. For each application, we determined an appropriate test threshold by visually examining pairs of outputs to find a value that, in our view, effectively sepa-rated acceptable from unacceptable BMP file conversions. For our set of benchmark applications we determined that an appropriate value for the test threshold was 0.1 (10%).
We emphasize once again that we use the test oracles only as part of our experimental evaluation as a means to enable us to evaluate the quality of Snap’s classifications for our benchmark applications. We anticipate that production de-velopers would use Snap directly without test oracles.
5.3
Methodology
Snap classifies the input fields and code as follows:
• Baseline Executions: We obtain five representative inputs for each application and use Snap to obtain ex-ecution and influence traces for each input.
• Input Specification Generation: As described in Section 3.2, Snap uses the influence traces to group adjacent input bytes into fields.
• Fuzzed Input Suite Generation: For each input field in each representative input, we use Snap to gen-erate two fuzzed inputs, one with the field set to all 0s, the other with the field set to all 1s.
• Fuzzing Input Executions: We use Snap to obtain influence and execution traces for each fuzzed input. • Input Field Classification: As described in
Sec-tion 3.4, Snap uses the influence and execuSec-tion traces from the fuzzed inputs to classify each input field as critical or forgiving.
• Code Classification: As described in Section 3.5, Snap uses the input field classification and influence traces from the original inputs to classify each basic block as critical, forgiving, mixed, or neither.
We evaluate the quality of Snap’s input field classifica-tions by comparing them to the input field classificaclassifica-tions that the test oracles produce. We evaluate the quality of Snap’s code classifications by manually examing the clas-sified code regions and evaluating the correlation between their classification and their purpose in the computation.
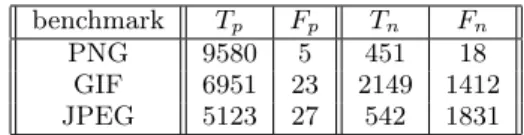
benchmark Tp Fp Tn Fn
PNG 9580 5 451 18 GIF 6951 23 2149 1412 JPEG 5123 27 542 1831 Table 1: Critical byte classification results
5.4
Input Field Classification Results
Table 1 presents the field classification results. The table presents four numbers for each benchmark:
• True Positives (Tp): The number of bytes that the
test oracle classifies as critical that Snap also classifies as critical.
• False Positives (Fp): The number of bytes that the
test oracle classifies as forgiving but Snap classifies as critical.
• True Negatives (Tn): The number of bytes that the
test oracle classifies as forgiving that Snap also classi-fies as forgiving.
• False Negatives (Fn): The number of bytes that the
test oracle classifies as critical but Snap classifies as forgiving.
In general, Snap performs well:
• Precision: On each benchmark, 99% of the input file bytes that Snap classified as critical (an input file byte is classified as critical if the field that contains the byte is classified as critical) were also classified as critical by the test oracle.
• Recall: Of the input file bytes that the test oracle classified as critical, Snap also classified 99%, 83%, and 73% of the bytes as critical for the PNG, GIF, and JPEG benchmarks, respectively. A lower value for re-call indicates that Snap misclassified a critical byte as forgiving.
Note that Snap’s recall on JPEG is substantially lower than its recall for the other benchmarks. We attribute this phe-nomenon to the fact that Snap only works with direct, and not indirect, influence. As discussed in Section 3.4.2 and Sec-tion 5.1, Snap classifies an input field as critical if, according to the influence trace, the field influences the operands of more than a threshold proportion of the executed instruc-tions. However, the influence trace only captures direct in-fluence — it does not capture indirect control-flow inin-fluence or indirect influence induced through pointer arithmetic or array indexing operations. The JPEG benchmark uses input bytes in pointer arithmetic. Because Snap does not track the indirect influence that these pointer arithmetic opera-tions induce, the output influence calculation undercounts the number of executed instructions that these bytes influ-ence. For this reason Snap misclassifies 27% of JPEG’s crit-ical bytes as forgiving.
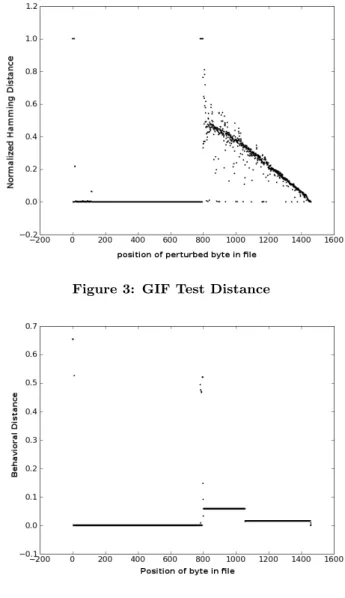
Figures 3, 4, and 5 present data for the GIF benchmark. These figures plot the mean (over all corresponding fuzzed inputs) test oracle test distance, Snap behavioral distance, and Snap output influence, respectively, as a function of the corresponding fuzzed input byte. These graphs illustrate how Snap’s behavioral distance and output influence met-rics correlate with different aspects of the test oracle’s test distance and how appropriately combining these two metrics enables Snap to identify critical input fields with excellent precision and excellent to very good recall.
Behavioral Distance: An examination of the behavioral distance data supports the following observations:
• Clean Separation: There is a clean separation in the behavioral distance between regions with large behav-ioral distance (greater than 0.4) and regions with small behavioral distance (less than 0.4).
• Large Behavioral Distance Implies Large Test Distance: If there is a large deviation in the behav-ior of an application (as measured by the behavbehav-ioral distance), then there is also a large deviation in the output — for every input region with a behavioral dis-tance greater than 0.4, the test disdis-tance is at least 0.9 (i.e., at least 90% of the output bytes are differ-ent). In general, regions that have large behavioral distances contain information such as the image pa-rameters (around byte 0) and metadata (around byte 800). Fuzzing these data typically leaves the applica-tion unable to successfully parse or process the input image file.
• Large Test Distance Does Not Necessarily Im-ply Large Behavioral Distance: For many input regions, the behavioral distance is small but the test distance is large. In general, these regions (approx-imately bytes 800 through 1200) contain image data. Fuzzing the image data typically does not dramatically change the computation that the application performs, but can produce a large change in the appearance of the rendered image.
Output Influence: A striking feature of the output influ-ence graph (Figure 5) is the downward-sloping line from byte 800 through byte 1200 (approximately). The image com-pression algorithm is the source of this line — essentially, each encoded pixel influences the values of all subsequent encoded pixels. So the proportion of the pixel decoding com-putation that each pixel influences is directly proportional to its position in the image file.
Figure 3: GIF Test Distance
Figure 4: GIF Behavioral Distance
function name png memcpy check png handle IHDR png handle PLTE png handle tRNS png do read transformations png read start row
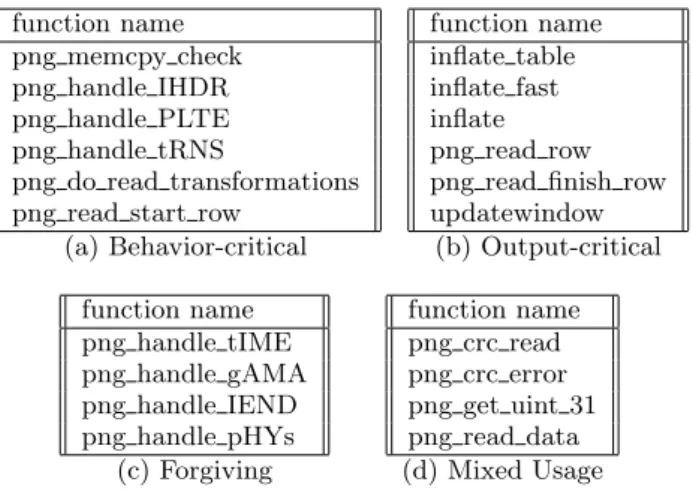
(a) Behavior-critical function name inflate table inflate fast inflate png read row png read finish row updatewindow (b) Output-critical function name png handle tIME png handle gAMA png handle IEND png handle pHYs (c) Forgiving function name png crc read png crc error png get uint 31 png read data (d) Mixed Usage Figure 6: PNG and zlib code classifications
The test distance graph (Figure 3) exhibits a correspond-ing (but noisier) line in the same part of the file. This line shows that the proportion of the computation that each com-pressed pixel influences correlates closely with the impact of that pixel on the appearance of the final rendered image. In this way the output influence metric can capture the im-pact of each compressed pixel on the visual appearance of the image and, more generally, the impact of different input regions on the output.
Unused Data: All of the graphs reflect the fact that almost all bytes 100 through 800 (approximately) have essentially no effect on any aspect of the computation or its output. This region of the input contains unused portions of a fixed-size image palette. Such regions show up as horizontal lines on both the behavioral distance and output influence graphs.
5.5
Code Classifications
We evaluate the accuracy of Snap’s code classifications by examining each executed function to investigate the rela-tionship between the classifications of the basic blocks in the function and the role that the function plays in the compu-tation. For this purpose we manually refine Snap’s critical code classification to behavior-critical code (code classified as critical because of behavioral distance) and output-critical code (code classified as critical because of output influence). In general, we found that Snap’s code classifications consis-tently reflect the roles that the different regions of code play in the computation.
5.5.1
PNG and zlib
Behavior-critical: Figure 6(a) lists the behavior-critical PNG and zlib functions. The png_handle functions each implement a particular feature of the file format. Specifi-cally, png_handle_IHDR reads a PNG file’s initial, manda-tory header and allocates the library’s initial data struc-tures. png_handle_PLTE allocates and builds the palette for a paletted image. png_memcpy_check uses critical data about the length of fields in the input to allocate memory buffers. Corruptions to the data that png_memcpy_check accesses may violate implicit invariants about the intended size of the allocated buffer and lead to uninitialized reads or out of bounds writes. For each of these functions, data corruption or programmer error can lead to critical errors in the execution of the application.
function name DGifGetLine DGifGetImageDesc (a) Behavior-critical function name DGifDecompressLine DGifDecompressInput (b) Output-critical function name DGifGetWord (c) Mixed Usage
Figure 7: GIF code classifications
Output-critical: Figure 6(b) lists the output-critical PNG and zlib functions. These functions decompress the main im-age data. png_read_row and png_read_finish_row direct compressed image data from the input file to zlib’s inflate, inflate_table, and inflate_fast functions. These func-tions are critical because the entirety of the application’s output is directed through these functions. Therefore, small errors in these functions can lead to global distortions in the output.
Forgiving: Figure 6(c) lists the PNG and zlib functions that Snap classified as forgiving. Some of these functions process parts of the input that are not relevant for the in-tended deployment context of the application. For exam-ple, png_handle_tIME and png_handle_pHys read the times-tamp and physical device parameters (respectively) out of the input buffers and store them in appropriate applica-tion variables (from which they are never accessed). The png_handle_IEND function handles the final file delimiter. Although the PNG specification mandates that every PNG file must contain this delimiter, the PNG library will still produce the rendered output image even if it reaches the end of the input without encountering this delimiter. Faults in these regions of code will not compromise the output pro-vided that the application can execute through the corre-sponding errors.
Mixed Usage: Figure 6(d) lists the PNG and zlib functions with mixed classifications. These functions are common util-ity functions. The png_crc_read and png_crc_error func-tions compute input file checksums. The png_read_data, png_default_read_data, and png_get_uint_31 functions are all file reading utility functions.
5.5.2
GIF
Figure 7 presents the code classifications for the GIF bench-mark. GIF is a relatively simple image format that does not provide the same level of functionality as PNG and JPEG. The application is also coded with relatively large functions. In comparison with PNG and JPEG, it therefore contains relatively few relevant functions.
Behavior-critical: GIF’s behavior-critical functions are responsible for parsing the image description header and co-ordinating the movement of uncompressed output to desti-nation buffers. Both of these tasks require the manipulation of the critical data associated with the image’s dimensions and encoding parameters.
Output-critical: Like the PNG file format, GIF’s image data decompression functions are output-critical. Faults in these functions could potentially corrupt the entire rendered image.
Mixed Usage: GIF’s single mixed usage function is a util-ity function that reads raw bytes from the input file.
function name alloc large alloc sarray alloc small free pool
jpeg calc output dims jinit d main controller start pass huff decoder process data simple main jpeg finish decompress jpeg make d derived tbl jdiv round up
(a) Behavior-critical
function name decode mcu jpeg huff decode jpeg fill bit buffer jpeg idct islow (b) Output-critical function name examine app0 examine app14 (c) Forgiving function name get interesting appn next marker read markers skip input data skip variable
(d) Mixed Usage Figure 8: JPEG code classifications
5.5.3
JPEG
Snap’s classifications for the JPEG library (Figure 8) mir-ror the results of its classifications for the PNG library. Behavior-critical: The behavior-critical functions in JPEG initialize data structures, process the image parameters and metadata, and allocate memory (JPEG has its own custom allocator). The functions whose names start with alloc allocate decompression buffers. jinit_d_main_controller initializes the state of the parsing engine. In several loca-tions in the library, jdiv_round_up rounds off the height and width of the image. Faults in these functions may cause crit-ical memory system errors or produce invalid initial states (which can critically impair the application).
Output-critical: JPEG’s output-critical functions decom-press the image data (these functions play a similar role to the decompression functions in GIF and PNG) and perform a variety of image transformations. Faults in these functions could potentially corrupt the rendered image.
Forgiving and Mixed: JPEG’s forgiving and mixed usage functions implement functionality that can be critical to the output of the application. For instance, the mixed usage functions implement functionality related to navigating the structure of the file. We attribute the misclassification of these functions to the misclassification of the critical fields (see Section 5.4) that influence the data they manipulate.
6.
THREATS TO VALIDITY
The primary conclusion of our research is that meaningful distinctions exist between critical and forgiving input fields and code, and that Snap’s techniques can automatically and accurately infer these distinctions.
We note that our set of benchmark applications is rela-tively small (only three applications) with all benchmarks in the same area (image file decoding). At this point it is not clear the extent to which our results may generalize to other applications in other areas (although other studies have found meaningful criticality distinctions in other appli-cation areas, see Section 7).
Snap uses the input field classification to induce the code classification. As the inaccuracy in the JPEG code clas-sification illustrates (see Section 5.5.3), the fact that the influence trace does not take indirect influence via control flow, array indexing, or pointer arithmetic into account can cause Snap to misclassify critical code as forgiving. On the other hand, including indirect influence in the influence trace might make the code classification overly aggressive (i.e., the code classifier might misclassify forgiving code as critical). It is also possible for some data derived from critical input fields to be forgiving and vice-versa. It is even possible for the same data to be forgiving at some points in the com-putation and critical at others. In these cases Snap might have to use a more precise analysis technique (potentially, for example, fuzzing internal application data as well as the input) to produce a useful classification.
7.
RELATED WORK
Snap uses perturbation analysis (which perturbs some as-pect of the application, its execution, its input, or its internal data) to classify input regions and code as critical or forgiv-ing. It is also possible to use software fault injection (which perturbs the application as opposed to its input) to classify regions of code as critical or forgiving [26]. In this study, critical code regions often manipulate input metadata (such as video stream metadata) while forgiving regions often ma-nipulate the core video or email data. Another approach skips task executions to find critical tasks [22, 24]. The re-sults show that critical tasks tend to create data structures that subsequent tasks use or copy data between data struc-tures. These results are broadly consistent with the results in this paper.
Samurai provides an API that developers can use to al-locate objects in either the critical heap (which uses object replication and guard objects to protect its contents against corruption) or the non-critical heap (which provides no pro-tection mechanisms) [19]. The results show that, in the ab-sence of the memory protection mechanisms, corruptions to objects allocated in the critical heap produce application failure rates in excess of 50%. Corruptions to objects allo-cated in the non-critical heap, on the other hand, produce application failure rates of approximately 2%. A difference between Snap and Samurai is that Snap focuses on the use of perturbation analysis to automatically classify input fields and code as critical or forgiving, while Samurai focuses on implementation mechanisms that protect critical memory against corruption.
Snap uses influence tracing to generate input specifications and to identify critical and forgiving input fields and code regions. Other applications of taint and influence tracing in-clude detecting security and/or privacy vulnerabilities [27, 3, 16, 21] and supporting software testing [8, 9, 5]. To en-able these applications, researchers have developed a range of taint and information flow tracing techniques and sys-tems [27, 3, 16, 21, 4, 8, 5, 9].
Researchers have also developed a variety of techniques for automatically inferring general input file formats [2, 7, 12, 6]. The applications of these formats include reverse engineering, intrusion detection, and software testing. Au-tomated fuzz testing [13, 1, 18, 9] is an established technique for automated test case generation. Our fuzzing technique is closest to block-based fuzzers, which use input format spec-ifications to apply fuzzing at the level of input fields [1].
8.
CONCLUSION
This paper advocates viewing both inputs and code through a prism that separates critical regions (which must typically satisfy hard logical correctness properties for the applica-tion to funcapplica-tion acceptably at all) from forgiving regions (which can typically tolerate significant perturbations with-out affecting the acceptability of the execution). Snap uses dynamic perturbation analysis to automatically classify in-put fields as either critical or forgiving, then extends this classification to regions of code within the application. The resulting classification information is directly relevant for a variety of software engineering tasks. But perhaps more importantly, the availability of an automated classification system can help developers acquire, retain, and pervasively apply this enlightening and productive perspective across all of their activities as they engineer complex, challenging software systems.
Acknowledgements
This research was supported by DARPA Cooperative Agree-ment FA8750-06-2-0189 and NSF Awards 0811397, 0835652, and 0905224. Michael Carbin is supported by a Microsoft Graduate Research Fellowship.
9.
REFERENCES
[1] Dave Aitel. The advantages of block-based protocol analysis for security testing. Technical report, Immunity, Inc., 2002.
[2] Juan Caballero, Heng Yin, Zhenkai Liang, and Dawn Xiaodong Song. Polyglot: automatic extraction of protocol message format using dynamic binary analysis. In CCS, pages 317–329, 2007.
[3] Jim Chow, Ben Pfaff, Tal Garfinkel, and Mendel Rosenblum. Shredding your garbage: reducing data lifetime through secure deallocation. In Security, pages 22–22, 2005.
[4] James Clause, Wanchun Li, and Ro Orso. Dytan: A generic dynamic taint analysis framework. In ISSTA, pages 196–206, 2007.
[5] James A. Clause and Alessandro Orso. Penumbra: automatically identifying failure-relevant inputs using dynamic tainting. In ISSTA, pages 249–260, 2009. [6] Paolo Milani Comparetti, Gilbert Wondracek,
Christopher Kr¨ugel, and Engin Kirda. Prospex: Protocol specification extraction. In IEEE Symposium on Security and Privacy, pages 110–125, 2009. [7] Weidong Cui, Marcus Peinado, Karl Chen, Helen J.
Wang, and Luis Ir´un-Briz. Tupni: automatic reverse engineering of input formats. In CCS, 2008.
[8] Will Drewry and Tavis Ormandy. Flayer: exposing application internals. In WOOT, pages 1–9, 2007. [9] Vijay Ganesh, Tim Leek, and Martin Rinard.
Taint-based directed whitebox fuzzing. In ICSE, 2009. [10] Henry Hoffmann, Sasa Misailovic, Stelios Sidiroglou,
Anant Agarwal, and Martin Rinard. Using Code Perforation to Improve Performance, Reduce Energy Consumptio n, and Respond to Failures . Technical Report MIT-CSAIL-TR-2009-042, MIT, September 2009.
[11] Chris Lattner and Vikram S. Adve. LLVM: A
compilation framework for lifelong program analysis & transformation. In CGO, pages 75–88, 2004.
[12] Zhiqiang Lin, Xuxian Jiang, Dongyan Xu, and Xiangyu Zhang. Automatic protocol format reverse engineering through context-aware monitored execution. In NDSS, 2008.
[13] Barton P. Miller, Louis Fredriksen, and Bryan So. An empirical study of the reliability of unix utilities. CACM, 33(12):32–44, 1990.
[14] Sasa Misailovic, Deokhwan Kim, and Martin Rinard. Automatic Parallelization with Automatic Accuracy Bounds. Technical Report MIT-CSAIL-TR-2010-007, 2010.
[15] Sasa Misailovic, Stelios Sidiroglou, Henry Hoffman, and Martin C. Rinard. Quality of service profiling. In ICSE, 2010.
[16] James Newsome and Dawn Song. Dynamic Taint Analysis for Automatic Detection, Analysis, and Signature Generation of Exploits on Commodity Software. In NDSS, 2005.
[17] Huu Hai Nguyen and Martin C. Rinard. Detecting and eliminating memory leaks using cyclic memory allocation. In ISMM, pages 15–30, 2007.
[18] Carlos Pacheco, Shuvendu K. Lahiri, Michael D. Ernst, and Thomas Ball. Feedback-directed random test generation. In ICSE, pages 75–84, 2007. [19] Karthik Pattabiraman, Vinod Grover, and
Benjamin G. Zorn. Samurai: protecting critical data in unsafe languages. In EuroSys, pages 219–232, 2008. [20] Jeff H. Perkins, Sunghun Kim, Samuel Larsen,
Saman P. Amarasinghe, Jonathan Bachrach, Michael Carbin, Carlos Pacheco, Frank Sherwood, Stelios Sidiroglou, Greg Sullivan, Weng-Fai Wong, Yoav Zibin, Michael D. Ernst, and Martin C. Rinard. Automatically patching errors in deployed software. In SOSP, pages 87–102, 2009.
[21] Feng Qin, Cheng Wang, Zhenmin Li, Ho-Seop Kim, Yuanyuan Zhou, and Youfeng Wu. Lift: A
low-overhead practical information flow tracking system for detecting security attacks. In MICRO, pages 135–148, 2006.
[22] Martin C. Rinard. Probabilistic accuracy bounds for fault-tolerant computations that discard tasks. In ICS, pages 324–334, 2006.
[23] Martin C. Rinard. Living in the comfort zone. In OOPSLA, pages 611–622, 2007.
[24] Martin C. Rinard. Using early phase termination to eliminate load imbalances at barrier synchronization points. In OOPSLA, pages 369–386, 2007.
[25] Martin C. Rinard, Cristian Cadar, Daniel Dumitran, Daniel M. Roy, Tudor Leu, and William S. Beebee. Enhancing server availability and security through failure-oblivious computing. In OSDI, pages 303–316, 2004.
[26] Martin C. Rinard, Cristian Cadar, and Huu Hai Nguyen. Exploring the acceptability envelope. In OOPSLA Companion, pages 21–30, 2005. [27] G. Edward Suh, Jae W. Lee, David Zhang, and
Srinivas Devadas. Secure program execution via dynamic information flow tracking. In ASPLOS, pages 85–96, 2004.
[28] Pang-Ning Tan, Michael Steinbach, and Vipin Kumar. Introduction to Data Mining. Addison Wesley, 2005.