Publisher’s version / Version de l'éditeur:
Journal of Building Physics, 36, 3, pp. 308-329, 2012-12-23
READ THESE TERMS AND CONDITIONS CAREFULLY BEFORE USING THIS WEBSITE.
https://nrc-publications.canada.ca/eng/copyright
Questions? Contact the NRC Publications Archive team at
[email protected]. If you wish to email the authors directly, please see the first page of the publication for their contact information.
NRC Publications Archive
Archives des publications du CNRC
This publication could be one of several versions: author’s original, accepted manuscript or the publisher’s version. / La version de cette publication peut être l’une des suivantes : la version prépublication de l’auteur, la version acceptée du manuscrit ou la version de l’éditeur.
For the publisher’s version, please access the DOI link below./ Pour consulter la version de l’éditeur, utilisez le lien DOI ci-dessous.
https://doi.org/10.1177/1744259112450419
Access and use of this website and the material on it are subject to the Terms and Conditions set forth at
Thermal performance of wall assemblies with low emissivity
Saber, Hamed H.
https://publications-cnrc.canada.ca/fra/droits
L’accès à ce site Web et l’utilisation de son contenu sont assujettis aux conditions présentées dans le site LISEZ CES CONDITIONS ATTENTIVEMENT AVANT D’UTILISER CE SITE WEB.
NRC Publications Record / Notice d'Archives des publications de CNRC: https://nrc-publications.canada.ca/eng/view/object/?id=932a7ce2-88ef-4d2a-9e53-365e7be5cd41 https://publications-cnrc.canada.ca/fra/voir/objet/?id=932a7ce2-88ef-4d2a-9e53-365e7be5cd41
Thermal Performance of Wall Assemblies with Low
Emissivity
Hamed H. Saber*
NRC Construction Portfolio, National Research Council Canada
Bldg. M-24, 1200 Montreal Road, Ottawa, Ontario, Canada K1A 0R6 http://irc.nrc-cnrc.gc.ca/irccontents.html
ABSTRACT
In wall systems, airspaces can increase thermal resistance if a reflective material such as foil with low emissivity is installed in a Furred-Airspace Assembly (FAA). In this paper, the present model, hygIRC-C, was used to investigate the steady-state thermal resistance of wall assemblies that incorporate foil adhered to expanded polystyrene (EPS) foam in a furred-assembly. To investigate the effect of the furring orientation, the furring was installed horizontally and vertically and compared to walls with no furring. For wall with vertical furring, the 3D version of the present model was used to capture the 3D effect of the thermal bridges. Because the foil emissivity can be affected by dust accumulation and/or water vapor condensation on the foil surface, consideration was given to investigate the effect of both varying foil emissivity and outdoor temperature on the thermal performance of the various wall specimens. Results showed that the thermal resistance (R-value) of the reference wall (no furring) is greater than the wall specimens with furring. Also, results showed that the contribution of the FAA to the R-value of wall specimen with vertical furring is higher than that for wall specimen with horizontal furring.
Keywords: Reflective insulation, Furred-Airspace Assembly (FAA), low emissivity material,
thermal modelling, thermal resistance, R-value, airflow, heat transfer by convection, conduction and radiation.
INTRODUCTION
The present 2D and 3D proprietary IRC hygrothermal model, hygIRC-C, was used to predict the thermal and hygrothermal performance of different roofing and wall systems. This model was benchmarked against the previously developed model [1-2], and experimental results in number of projects. The 2D version of the present model was also used to predict the drying rate of a number of full-scale wall assemblies subjected to different exterior and interior boundary conditions [1]. The results showed that the predictions of the present model were in good agreement with the experimental measurements (within ±5%) [3]. Recently, the 2D version of the present model was used to conduct hydrothermal simulations in order to investigate the moisture accumulation over time as well as energy use of reflective and non-reflective roofing systems, subjected to different climatic conditions of North America [4, 5].
Omitting moisture transport, the 3D version of the present model was also used to conduct numerical simulations for different full-scale wall assemblies to predict the effective thermal resistance (R-value) under conditions of air leakage [6]. These walls incorporated different
types of insulations. The predicted R-values for these walls were in good agreement (within ± 5%) with the measured R-values in the Guarded Hot Box (GHB) [6-8]. Furthermore, the present model was benchmarked and used to assess the dynamic heat transmission characteristics through Insulating Concrete Form (ICF) wall specimens [9-10] and compared with experimental data [10].
Currently, reflective thermal insulation is being used in home attics, flat and sloped roofs, and wall systems [11]. There are a number of thermal insulations that can be used in conjunction with reflective insulation assemblies in building envelopes. According to the Reflective Insulation Manufacturers Association International (RIMA-I), reflective insulation is defined as “thermal insulation consisting of one or more low-emittance surfaces, bounding one or more enclosed air spaces” [12]. As will be shown in this study, an enclosed airspace contributes to
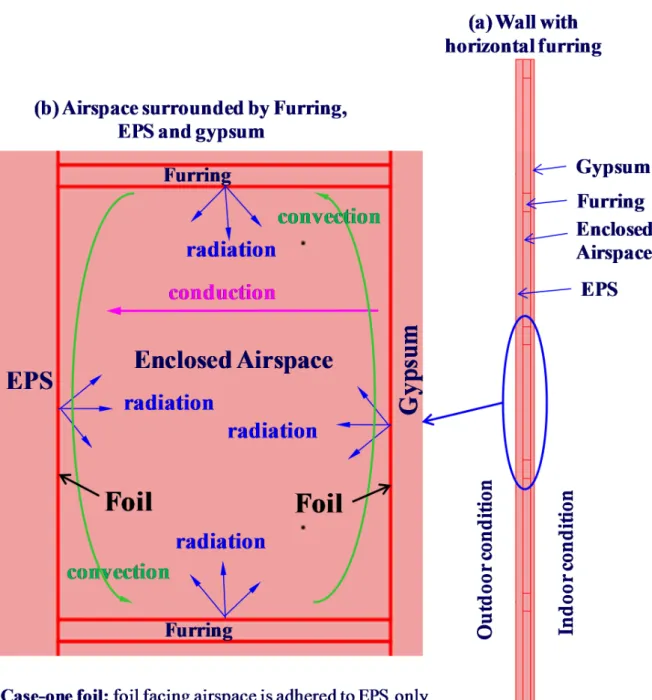
the overall R-value of a system whether or not a reflective surface is installed, but the reflective surface augments the thermal resistance of that airspace. As shown in Figure 1, within an enclosed airspace, which is a transparent medium, there are three modes of heat transfer: conduction, convection and radiation (see [13-18]). The direction of the convection loop shown in Figure 1b represents the case of indoor temperature higher than the outdoor temperature. Any surface of opaque materials that faces a transparent medium (enclosed airspace in this study) absorbs and emits long-wave thermal radiation [13-16] where the amount of radiant heat transfer depends on temperature and emissivity of this surface. Most of construction materials have a surface emissivity of 0.9 (ASHRAE 2009 [19]).
The present model was benchmarked against the test data obtained using GHB (in accordance with ASTM C-1363 test method [20-21]) for a full-scale above-grade wall system (8’ x 8’) consisting of 2”x6” wood frame construction with stud cavities filled with friction-fit glass fiber batt insulation and a foil adhered to wood fiberboard installed in a furred-airspace assembly (the foil was facing the interior finishes). Results showed that the predicted R-value of this wall system was in good agreement with the measured value [14].
The present model was used to conduct a parametric study in order to investigate the effect of low emissivity of foil laminated to XPS foam when used within a FAA [13]. Also, it was used to investigate the effect of outdoor and indoor conditions on the steady-state and transient thermal performance of a foundation wall system (including the above-grade and below-grade portions of the wall) having FAA that also incorporates a low emissivity material (foil) [15-16].
In the previous studies described above [13-16], the orientation of the enclosed airspace was vertical. As indicted earlier, the reflective insulations can also be used in home attics, and flat and sloped roofs. In these types of applications, the enclosed airspace would have a zero or non-zero slope with a horizontal surface. Recently, a number of tests were conducted for different types of reflective insulations using the ASTM C-518 test method [22] with a heat flow meter that accommodates product samples up to 12” in width and length, and thickness up to 4” [11, 17]. In these tests, sample stacks with different type of reflective insulations were placed horizontally between the upper cold plate and lower hot plate of the heat flow meter. Each sample stack consisted of three layers. The upper layer (12” width x 12” length x 1” or 2” thick) made of reflective insulation (foil adhered to the bottom surface). The bottom layer made of gypsum (12” x 12” x 1/2”) [11] or EPS (12” x 12” x 1”) [17]. To quantify the thermal resistance added to the samples by creating a reflective insulation component, an air cavity (8” x 8” x 1”) was created in the center of EPS layer (12” x 12” x 1”), which was placed between the upper
Thereafter, it was used to investigate the contribution of reflective insulations to the R-value for specimens with different inclination angles, different directions of heat flow through the specimens, and a wide range of foil emissivity [18].
The contribution of the airspace in roofing or wall systems to their R-values depends on [17-18]: (a) The emissivity of all surfaces bounded the airspace.
(b) Size and orientation of the airspace.
(c) Direction of heat transfer through the airspace. (d) Temperatures of all surfaces of the airspace. (e) Air infiltration in the case of un-sealed airspace.
The case of an air cavity with openings (un-sealed airspace) exposed to the exterior of wall systems would be subjected to air infiltration, which can affect the R-value of the wall systems. An example of this application is exterior polyisocyanurate insulation with foil facing the vinyl siding. The effect of air infiltration on the R-value of wall systems is not addressed in this study. This effect will be investigated in a future study.
The objective of this study is to conduct a parametric study using the present model that was previously benchmarked in order to:
Quantify the contribution of the reflective insulation to the R-value of wall specimens with Furred-Airspace Assembly (FAA),
Determine the effect of furring orientation on the R-value of wall specimens,
Investigate the effect of installing foil on the two opposite sides of the vertical faces of the enclosed airspace (see the “Case-two foils” described next), and
Investigate the effect of varying foil emissivity and outdoor temperature on the R-value of wall specimens.
NUMERICAL SIMULATIONS
Wall specimens
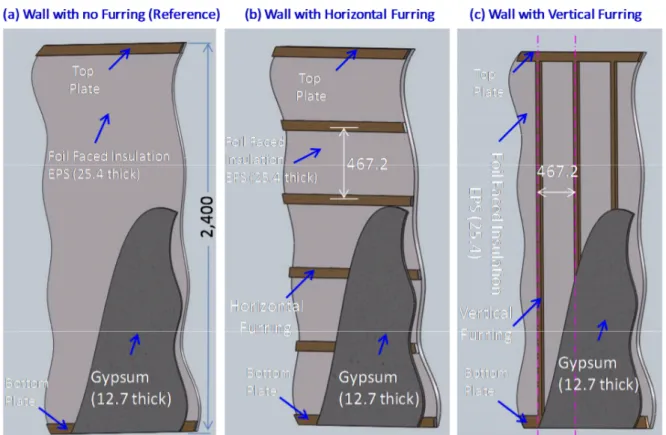
Three wall types were analyzed. The reference wall, Figure 2a, consisted of three layers: (a) foil faced EPS insulation (25.4 mm thick), (b) enclosed air gap (25.4 mm thick) and (c) gypsum board (12.7 mm thick). The height of the wall specimen is 2,400 mm. Test walls are identical to the reference wall but with furring that are installed horizontally for one wall (Figure 2b) and vertically for the other wall (Figure 2c). The center-to-center distance of the horizontal and vertical furring is 467.2 mm.
Considerations are given to quantify the contribution of installing foil on the gypsum board that faces the airspace on the effective R-values for the three wall specimens shown in Figure 2a, b, c. Two cases are considered in this study (see Figure 1):
Case-one foil: foil facing the airspace is adhered to EPS layer only [23], and
Case-two foils: foil facing the airspace is adhered on both EPS layer and gypsum board. The “Case-one foil” above was investigated in a recent study by Saber and Maref [23]. The results of that study are compared with the results of the “Case-two foils” in this study. The 2D version of the present model is suitable for predicting the thermal performance of the reference
vertical furring affects both the energy transport through the wall specimen and the air movement inside the enclosed airspace and requires the three-dimensional version of the present model.
Assumptions
It was assumed that all material layers are in perfect contact (i.e. the interfacial thermal resistances between all material layers were neglected). The emissivity of all surfaces bounded the airspace (gypsum board, top and bottom plates and furring) except the foil was taken equal to 0.9 [19]. The foil emissivity can increase with time because of (a) oxidation of the foil, (b) accumulation of dust on the foil and/or, (c) water vapor condensation on the foil. For example, Cook et al. [24] conducted experiments to investigate the effect of accumulation of dust on the emissivity on horizontal foil faces. That study showed that the emissivity of foil faces increases significantly as dust accumulates from an initial value of under 0.05 to an apparent asymptote ranging from 0.67 to 0.85, depending on the type of dust. However, the rate of dust accumulation on the foil faces with time may be affected by the foil orientation. Since we do not know the degree of cleanness of the foil and the degree of connectivity between the air gap and the exterior or interior air to investigate the effect of foil emissivity on the thermal performance, we considered a wide range of foil emissivity from 0 to 0.9 for both one foil” and “Case-two foils” (see Figure 1b). When the foil emissivity is known for a given wall system, the respective wall R-value can be obtained from the graphs presented later in this paper (e.g. see Figure 7 and Figure 8).
The results obtained in this study represent only the case when the airspace (25.4 mm thick) is completely sealed (i.e. zero air infiltration). However, in some applications (e.g. exterior polyisocyanurate insulation with foil facing under vinyl siding that generally uses vertical furring), the airspace has opening where air infiltration takes place inside the airspace. The effect of air infiltration in these applications on the R-values of wall systems will be addressed in future publications.
Surface-to-surface R-Value of wall specimen
The objective of this study is to determine the R-value of different wall specimens, subjected to different conditions. The surface-to-surface R-value is determined as:
avg
q T Value
R / . (1)
Note that the air-to-air R-value can be easily determined after adding the reciprocal of the outdoor and indoor film coefficients (1/houtd1/hind) to the LHS of Eq. (1).
T
in Eq. (1) is the surface-to-surface temperature difference across the wall specimen, which is calculated by performing the following numerical integrations as:
surf ind surf outd A surf ind surf ind A surf outd surf outd dA T A dA T A abs T , , , , , , 1 1 (2) where:surf outd
T , and Tind,surf are the local temperatures of the outdoor and indoor surfaces, and
surf outd
A , and Aind,surf are the areas of the outdoor and indoor surfaces of the wall specimen, which are equal in this study (Asurf) (see Figure 2).
In Eq. (1), q avg is the average heat flux that represents to the actual heat passing through the whole wall specimen (qavg Qactual /Asurf ). The average heat fluxes on the outdoor and indoor surfaces (qoutd ,avgand qind ,avg) are calculated as:
, 1 and , 1 , , , , , , , , , ,
surf ind surf outd A surf ind n surf ind avg ind A surf outd n surf outd avg outd A q dA q A q dA q (3)where: qn,outd,surf and qn,ind,surf are the local normal heat fluxes on the outdoor and indoor surfaces of the wall specimen. In the case of allowing for the side heat losses from the top and bottom surfaces of the wall specimen (Figure 2), the qoutd ,avgand qind ,avg given by Eq. (3) are not equal. In this case, neither qoutd ,avg nor qind ,avg represents the actual heat passing through the
whole wall specimen. In order to calculate the R-value using Eq. (1), however, the side heat losses from the top and bottom surfaces of the wall specimen should be eliminated. This can be achieved by applying adiabatic boundary condition on these surfaces. Consequently, q avg in Eq. (1) which represents the actual heat passing through the whole wall specimen is equal to
avg outd
q , and qind ,avg (due to energy conservation). Similarly, in the case of conducting
experiments to measure the R-value of a specimen by using one of the standard test methods (e.g. ASTM C-518 [22] or ASTM C-1363 [21]), the side heat losses from the specimen must be minimized in order to accurately measuring its R-value.
Boundary conditions
The boundary conditions on the top and bottom surfaces of all wall specimens shown in Figure 2 are adiabatic (i.e. no side heat losses). As indicated earlier, applying adiabatic condition on these surfaces permits calculating the surface-to-surface R-value of the wall specimens using Eq. (1). Since only one module of the wall specimen with vertical furring was modeled (half width of the furring on the left, enclosed airspace, and half width of the furring on the right, see Figure 2c), the left and right surfaces of this module are subjected to a symmetry condition. The exterior surface of the EPS layer is subjected to convective boundary condition with different air temperature and heat transfer coefficient of 34.0 W/m2K [21]. Similarly, the interior
surface of the gypsum board is subjected to a convective boundary condition with constant air temperature and heat transfer coefficient of 21.0oC and 8.29 W/m2K, respectively [21]. In this
study, all numerical simulations were conducted when the thermal conductivity of EPS, furring (including the top and bottom plates), and gypsum board were 0.035 W/(mK), 0.09 W/(mK) and 0.159 W/(mK), respectively. All R-values reported in this paper are surface-to-surface R-values. In the next section, the effect of furring orientation, foil emissivity, and the outdoor temperature on the effective R-values of different wall specimens are discussed.
To investigate the effect of the furring and its orientation on the R-value, numerical simulations were conducted for the wall specimens shown in Figure 2 for the case of foil emissivity of 0.05, and temperature difference between the indoor and outdoor of 15oC (21oC and 6oC for the
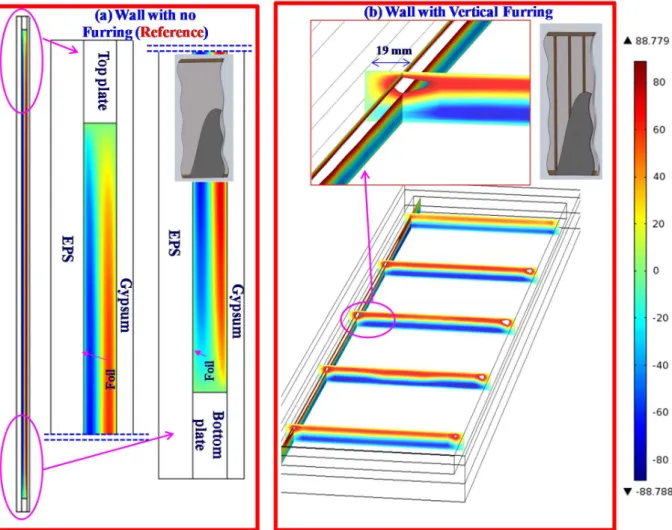
indoor and outdoor temperatures, respectively). The numerical simulations were conducted when foil facing the airspace is installed on EPS layer only (Case-one foil), and when foil facing the airspace is installed on both EPS layer and gypsum board (Case-two foils) (see Figure 1b). For the “Case-one foil”, Figure 3a and b shows the vertical velocity distributions in the enclosed airspace of wall specimens with no furring and with horizontal furring, respectively. For wall specimen with vertical furring, Figure 4 shows the vertical velocity distribution in the enclosed airspace through five horizontal slices (uniformly distributed along the wall height) and one vertical slice (19 mm out from the vertical furring, see the insert in Figure 4). For the purpose of comparison, Figure 5a and b show the vertical velocity distributions in the enclosed airspace using the same scale of the contour lines for the wall specimens with no furring and with vertical furring, respectively.
The temperature differential across the enclosed airspace causes a buoyancy-driven flow in the airspace. Figure 3 and Figure 4 show that a convection loop due to mono-cellular airflow with one vortex cell is developed in each of the enclosed airspaces. There are a number of parameters that affect the thermal performance of wall with and without furring, namely:
Stronger convection currents in the enclosed airspace occur in the walls with no furring and with vertical furring (one convection loop) than for wall with horizontal furring (5 convection loops). For example the maximum upward/downward air velocity in wall specimen with no furring is 89 mm/s (Figure 3a), which is higher than that in wall specimen with horizontal furring (53 mm/s, Figure 3b).
Due to the effect of thermal bridging of the vertical furring, the maximum upward velocity was 118 mm/s and occurs close to the furring (~19 mm out from the furring, Figure 4), which is higher than that for wall with no furring (89 mm/s, Figure 3b). However, the maximum downward velocities of these walls were approximately the same (89 mm/s, see Figure 3b and Figure 4). Except for the portion of the enclosed airspace close to the vertical furring (~33 mm out of the furring), Figure 5a (wall with no furring) and Figure 5b (wall with vertical furring) show that the vertical velocity distributions within the enclosed airspace are approximately the same for both walls.
More convection loops in the Furred-Airspace Assembly (FAA) along the height of wall specimen (one loop in wall with no furring and vertical furring, five loops in wall with horizontal furring) would enhance its thermal conductance (i.e. resulting in lower R-value). In a previous study [18], it was shown that more convection loops even with lower air velocity resulted in lower R-value.
Because of installing furring in the wall, the surface area of low emissivity surface facing the enclosed airspace (foil) decreases. In other words, the surface area of high emissivity surfaces (emissivity = 0.9) of the enclosed airspace increases. As such, the rate of heat transfer by radiation through the FAA would be higher in the case of wall with furring than that with no furring. This leads to more reduction in the R-value for the wall with furring.
A reduction in the R-value occurs due to the thermal bridges of the top and bottom plates of both walls with and without furring. However, for walls with vertical and horizontal furring, more reduction in the R-value would take place due to the thermal bridges of the furring.
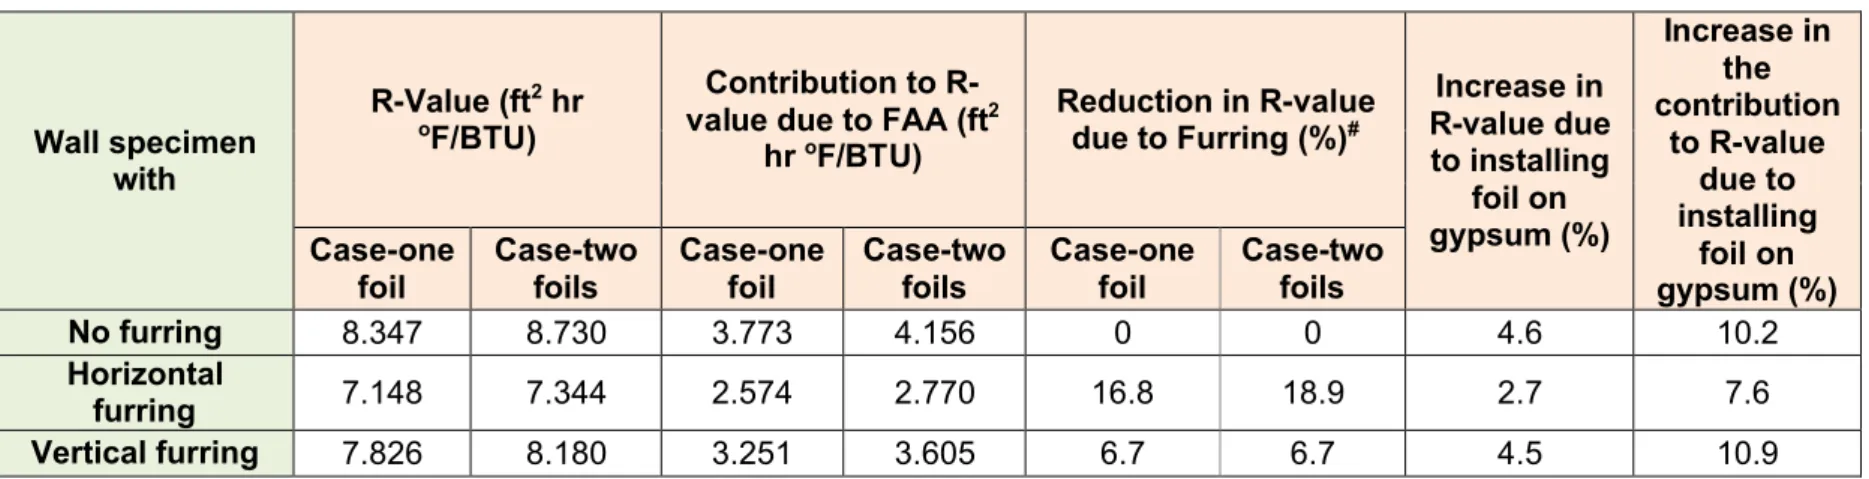
The interactive and coupled effects of the different parameters described above resulted in lower R-value for wall specimens with horizontal and vertical furring than that with no furring. For the “Case-one foil” and “Case-two foils”, Figure 6a and Table 1 show an example for the comparison between the effective R-value for wall specimens with and without furring in the case of foil emissivity of 0.05 and the indoor and outdoor temperatures of 21oC and 6oC,
respectively. As shown in this figure, the effective R-value of wall with vertical furring is higher by 9.5% and 11.4% for the “Case-one foil” and “Case-two foils”, respectively (Case-one foil: 7.826 ft2hroF/BTU, Case-two foils: 8.180 ft2hroF/BTU, only one convection loop along the height
of the wall) than wall with horizontal furring (Case-one foil: 7.148 ft2hroF/BTU, Case-two foils:
7.344 ft2hroF/BTU, five convection loops along the height of the wall). By comparing the R-value
of walls with no furring (Case-one foil: 8.347 ft2hroF/BTU, Case-two foils: 8.730 ft2hroF/BTU) and
with furring, the horizontal furring caused a reduction in the effective R-value by 16.8% and 18.9% for the “Case-one foil” and “Case-two foils”, respectively; while the vertical furring caused a reduction in the R-value by ~6.7% for both “Case-one foil” and “Case-two foils” (see Table 1). The R-value of both EPS layer (25.4 mm thick) and gypsum layer (12.7 mm thick) is 4.574 ft2hroF/BTU. The contribution to the effective R-values due to FAA (top and bottom plates,
furring and airspace) for different wall specimens was obtained by subtracting the R-value of EPS and gypsum layers from the effective R-values of the wall specimens. This contribution is shown in Figure 6b and Table 1. Note that in the case of wall without reflective film (i.e. emissivity of all surfaces bounded the airspace = 0.9 [19]) and without furring, the predicted effective R-value was 5.622 ft2hroF/BTU. In this case, the sealed airspace (25.4 mm thick)
contributed to the effective R-value by 1.048 ft2hroF/BTU. However, when the foil emissivity
equal 0.05 for the walls with no furring, horizontal furring and vertical furring, the FAA contributed to the effective R-values by 3.773, 2.574 and 3.251 ft2hroF/BTU, respectively, for the
“Case-one foil”, and by 4.156, 2.770 and 3.605 ft2hroF/BTU, respectively, for the “Case-two
foils”.
As expected, the R-values for the three wall specimens in the “Case-two foils” is higher than that in the “Case-one foil”. As shown in Figure 6b and Table 1, the contributions of the FAA to the R-values in the “Case-two foils” are higher than that in the “Case-one foil” by 0.383 ft2hroF/BTU, 0.196 ft2hroF/BTU, and 0.354 ft2hroF/BTU (i.e. 10.2%, 7.6% and 10.9% higher) for
wall with no furring, horizontal furring and vertical furring, respectively. Furthermore, for a given wall configuration, the contribution to the effective R-value due to FAA depends not only on the foil emissivity but also on the temperature differential across the wall specimen as shown next.
Effect of furring orientation and foil emissivity on the R-value
To quantify the effect of foil emissivity on the thermal performance and account for the possibility of dust accumulation and/or vapor condensation on it, numerical simulations were conducted for a range of foil emissivity of 0.0 – 0.9. A foil emissivity of 0.9 represents the case of no foil installed in the wall specimen or the foil surface is completely covered by dust or liquid water due to vapor condensation. As indicted earlier, the emissivity of horizontal foil faces can significantly increase as dust accumulates from an initial value of under 0.05 to an apparent asymptote ranging from 0.67 to 0.85 depending on the type of dust [24] (these values might not be the same for a vertical foil orientation). Also, a foil emissivity of zero means that no thermal radiation is emitted from the surface (i.e. purely reflective surface).
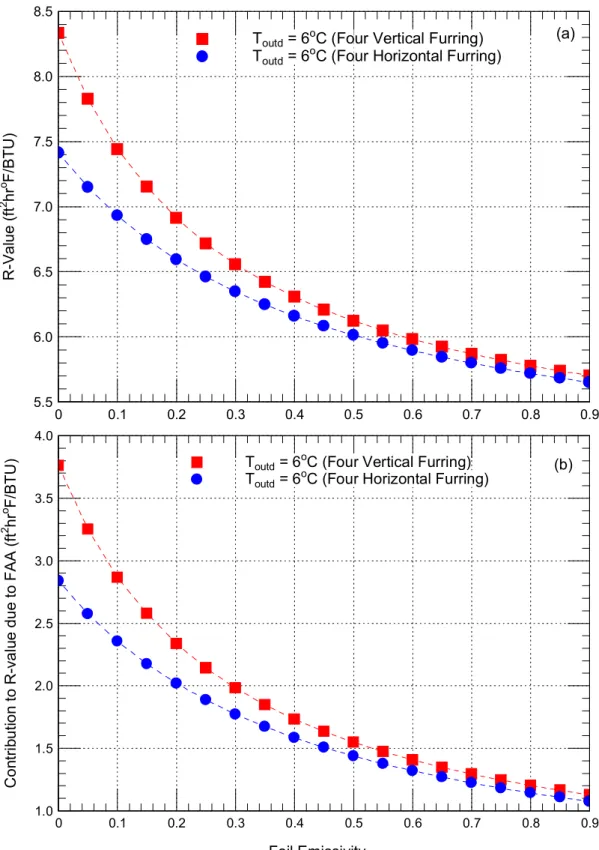
For the “Case-one foil”, Figure 7 shows an example for the effect of foil emissivity on the effective R-value of wall specimens with horizontal and vertical furring (see Figure 2) when the temperature difference between the indoor and outdoor is 15oC (indoor temperature = 21oC,
outdoor temperature = 6oC). For all values of foil emissivity, this figure shows that the effective
R-value of wall with vertical furring is always higher than that for wall with horizontal furring. As indicated earlier, for a foil emissivity of 0.05, the R-value of wall with vertical furring is 9.5% higher than that for wall with horizontal furring.
In the case of no foil installed in the wall specimens or the surface of the foil is covered by dust and/or liquid water due to condensation (foil emissivity = 0.9), the furring orientation has insignificant effect on the effective R-value (i.e. resultant lines in Figure 7a tend to converge as the foil emissivity approaches to 0.9). In this case, the R-value of the wall specimen with vertical furring is only ~0.9% higher than that for wall specimen with horizontal furring. As shown in Figure 7b for the “Case-one foil”, in the case of vertical furring, the contribution of the FAA to the effective R-value of wall specimen with foil emissivity of 0.05 (3.251 ft2hroF/BTU) is
2.88 times that with foil emissivity of 0.9. In the case of horizontal furring, however, the contribution of the FAA to the R-value of wall with foil emissivity of 0.05 (2.574 ft2hroF/BTU) is
2.39 times that with foil emissivity of 0.9. Because the foil emissivity has a significant effect on the thermal performance, accurate energy calculations for wall systems with reflective insulations, subjected to different climate conditions, requires performing hygrothermal simulations instead of thermal simulations in order to investigate whether or not vapor condensation occurs on the surface of the foil.
Comparison of R-values for “Case-one foil” and “Case-two foils”
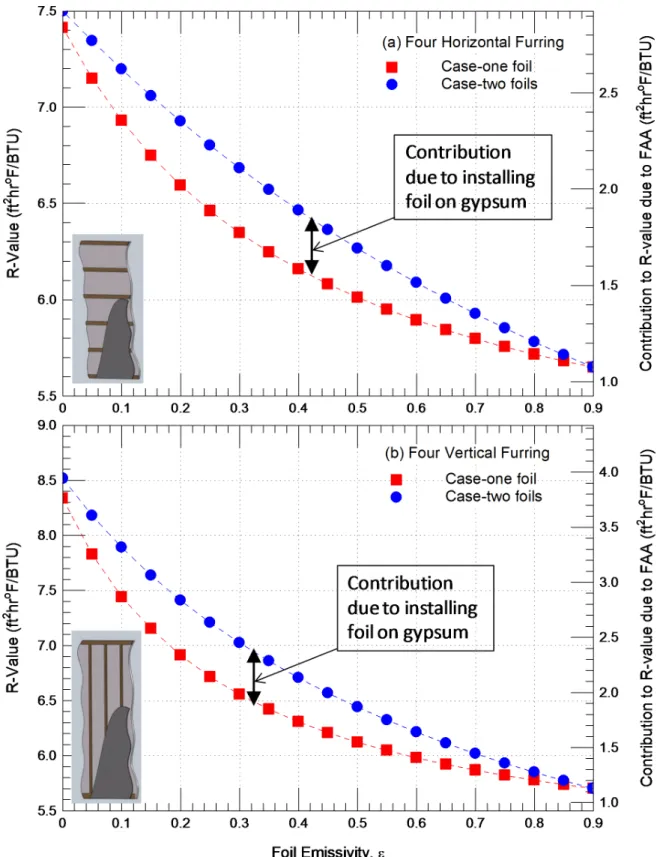
For a wide range of foil emissivity (0.0 – 0.9) when the temperature difference between the indoor and outdoor is 15oC (indoor temperature = 21oC, outdoor temperature = 6oC), Figure 8a
and Figure 8b show comparisons between the R-values for the “Case-one foil” and “Case-two foils” (see Figure 1 for the definition of these cases) of wall specimens with horizontal and vertical furring, respectively. As shown in these figures for a given foil emissivity, the difference between the R-values of “Case-one foil” and “Case-two foils” represents the contribution to the R-value due to installing foil on the gypsum board that faces the enclosed airspace. For a foil emissivity of 0.9 (i.e. no foil installed in the wall specimens), the R-values of both “Case-one foil” and “Case-two foils” are the same.
For a theoretical foil emissivity of 0.0 (i.e. purely reflective surface), the surface-to-surface thermal radiations takes place on the surfaces of wood (top and bottom plates and furring) and gypsum that face the enclosed airspace for the “Case-one foil”, and on the surfaces of wood only for the “Case-two foils”, resulting in more heat transfer rate by radiation for “Case-one foil” than that for “Case-two foils”. Consequently, for foil emissivity of 0.0, the predicted R-values for the “Case-two foils” are higher than that for the “Case-one foil” by 0.086 ft2hroF/BTU and 0.182
ft2hroF/BTU for the wall specimens with horizontal and vertical furring, respectively.
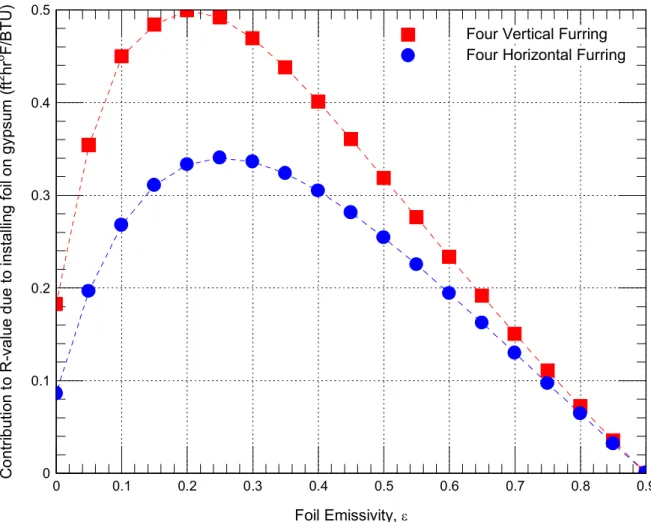
The difference between the R-values for the “Case-one foil” and “Case-two foils” (i.e. contribution to R-value due to installing foil on gypsum) are shown in Figure 9 for the wall specimens with horizontal and vertical furring. As shown in this figure, as the foil emissivity increases, this difference increases and reaches its peak value. Further increase in the foil emissivity results in a decrease in the contribution to R-value due to installing foil on gypsum (reaching 0.0 at foil emissivity of 0.9). The highest contribution to the R-value due to installing
foil on gypsum occurs at foil emissivity of 0.2 (0.499 ft2hroF/BTU) for wall specimen with vertical
furring, and at foil emissivity of 0.25 (0.340 ft2hroF/BTU) for wall specimen with vertical furring.
Effect of outdoor temperature on the R-value
Because the temperature differential across the wall specimen (T) affects the rate of heat transfer by convection and radiation inside the FAA, numerical simulations were carried out for the “Case-one foil” to investigate the effect of varying the outdoor temperature on the effective R-value of a wall specimen. As an example, the wall specimen with horizontal furring (Figure 2b) was selected to conduct these simulations in the case of foil emissivity of 0.05 and indoor temperature of 21oC. The obtained results are shown in Figure 10. As shown in this figure, the
highest effective R-value occurred as T approaches to zero. A higher T causes a higher rate of heat transfer by both convection and radiation inside the FAA, resulting in a lower R-value. For example, increasing the outdoor temperature from -15oC (T = 36oC, R-value = 6.742
ft2hroF/BTU) to 15oC (T = 6oC, R-value = 7.647 ft2hroF/BTU) resulted in an increase of the
effective R-value and the contribution of the FAA to the R-value by 13.4% and 41.7%, respectively.
SUMMARY AND CONCLUSIONS
Numerical simulations were conducted to quantify the contribution of the reflective insulation on the thermal performance of wall specimens for wide ranges of foil emissivity and outdoor temperatures. Three wall specimens were considered in this study. The first wall (reference wall) consisted of two layers of foil faced EPS insulation and gypsum board, which were separated by enclosed airspace where the foil faces the enclosed airspace. To investigate the effect of furring orientation on the R-value, two other wall specimens were considered. These two walls were identical to the reference wall but with four furring that were installed horizontally and vertically. The numerical simulations were conducted for a wide range of foil emissivity (0.0 – 0.9) to cover the possibility of dust accumulation and/or water vapour condensations on the surface of the foil. In addition to installing foil on the EPS surface, considerations were given to investigate the contribution to the R-value of wall specimens due to installing foil on the surface of gypsum as well. The 2D version of the present model was used for the wall specimens with no furring and with horizontal furring, and the 3D version of the present model was used for the wall specimen with vertical furring.
Results showed that in the case of low foil emissivity, the R-value of wall specimen with vertical furring is higher than that for wall specimen with horizontal furring. In the case of no foil installed in the wall specimen (i.e. foil emissivity = 0.9), the R-values of wall specimen with vertical furring is slightly higher than that with horizontal furring. Because the temperature differential across the wall specimen affects the rate of heat transfer by convection and radiation inside the Furred-Airspace Assembly (FAA), results showed that the outdoor temperature has a significant effect on the contribution of the FAA to the effective R-value of wall specimen. Also, results showed that the contribution to the R-values of wall specimens due to installing foil on the surface of gypsum depends on the foil emissivity.
and environmental conditions. A future work is recommended in order to cover different applications of the reflective insulations including the effect of air infiltration that use actual R-value of insulation under different climatic conditions so as to avoid over sizing the heating and cooling equipments.
REFERENCES
1. W. Maref, M.K. Kumaran, M.A. Lacasse, M.C. Swinton, D. van Reenen, “Laboratory Measurements and Benchmarking of an Advanced Hygrothermal Model”, Proceedings of the 12thInternational Heat Transfer Conference (Grenoble, France, August 18, 2002),
pp. 117-122, October 01, 2002 (NRCC-43054).
2. W. Maref, M.A. Lacasse, M.K. Kumaran, M.C. Swinton, “Benchmarking of the Advanced Hygrothermal Model-hygIRC with Mid-Scale Experiments”, eSim 2002 Proceedings (University of Concordia, Montreal, September 12, 2002), pp. 171-176, October 01, 2002 (NRCC-43970).
3. H.H. Saber, W. Maref, M.A. Lacasse, M.C. Swinton, K. Kumaran, “Benchmarking of Hygrothermal Model against Measurements of Drying of Full-Scale Wall Assemblies”, 2010 International Conference on Building Envelope Systems and Technologies, ICBEST 2010, Vancouver, British Colombia Canada, June 27-30, 2010, pp. 369-377. 4. H.H. Saber, M.C. Swinton, P. Kalinger, and R.M. Paroli, “Hygrothermal Simulations of
Cool Reflective and Conventional Roofs”, 2011 NRCA International Roofing Symposium, Emerging Technologies and Roof System Performance, held in Sept. 7-9, 2011, Washington D.C., USA.
5. H.H. Saber, M.C. Swinton, P. Kalinger, and R.M. Paroli, “Long-Term Hygrothermal Performance of White and Black Roofs in North American Climates”, Journal of Building and Environment, vol. 50, pp.141 – 154, 2012.(doi:10.1016/j.buildenv.2011.10.022). 6. A.H. Elmahdy, W. Maref, M.C. Swinton, H.H. Saber, R. Glazer, “Development of Energy
Ratings for Insulated Wall Assemblies”, 2009 Building Envelope Symposium (San Diego, CA. 2009-10-26) pp. 21-30, 2009.
7. H.H. Saber, W. Maref, A.H. Elmahdy, M.C. Swinton, R. Glazer, “3D Thermal Model for Predicting the Thermal Resistances of Spray Polyurethane Foam Wall Assemblies”, Building XI Conference, December 5-9, 2010, Clearwater Beach, Florida, USA.
8. H.H. Saber, W. Maref, H. Elmahdy, M.C. Swinton, R. Glazer, “3D Heat and Air Transport Model for Predicting the Thermal Resistances of Insulated Wall Assemblies”, International Journal of Building Performance Simulation (JBPS),
(http://dx.doi.org/10.1080/19401493.2010.532568), First published on: 24 January 2011
(iFirst), Vol. 5, No. 2, p. 75–91, March 2012.
9. M.M Armstrong., H.H. Saber, W. Maref, M.Z. Rousseau, G. Ganapathy, and M.C. Swinton, “Field Energy Performance of an Insulating Concrete Form (ICF) Wall”, 13th
Canadian Conference on Building Science and Technology (13th CCBST) conference,
held in May 10-13, 2011, Winnipeg, Canada.
10.H.H. Saber, W. Maref, M. Armstrong, M.C. Swinton, M.Z. Rousseau, G. Gnanamurugan, “Benchmarking 3D Thermal Model against Field Measurement on the Thermal Response of an Insulating Concrete Form (ICF) Wall in Cold Climate”, Building XI Conference, December 5-9, 2010, Clearwater Beach, Florida, USA.
11.C. Craven, C. and R. Garber-Slaght, Product Test: Reflective Insulation in Cold Climates, Technical Report Number TR 2011-01, Cold Climate Housing Research Center (CCHRC), Fairbanks, AK 99708, www.cchrc.org, April 12, 2011.
12.Reflective Insulation Manufacturers Association International (RIMA-I). (2002). Reflective Insulation, Radiant Barriers and Radiation Control Coatings. Olathe, KS: RIMA-I.
13.H.H. Saber, M.C. Swinton, “Determining through Numerical Modeling the Effective Thermal Resistance of a Foundation Wall System with Low Emissivity Material and Furred–Airspace”, 2010 International Conference on Building Envelope Systems and Technologies, ICBEST 2010, Vancouver, British Colombia, Canada, June 27-30, 2010, pp. 247-257.
14.H.H. Saber, W. Maref, M.C. Swinton, and C. St-Onge, "Thermal Analysis of above-Grade Wall Assembly with Low Emissivity Materials and Furred-Airspace," Journal of Building and Environment, volume 46, issue 7, pp. 1403-1414, 2011
(doi:10.1016/j.buildenv.2011.01.009).
15.H.H. Saber, W. Maref and M.C. Swinton, “Numerical Investigation of Thermal Response of Basement Wall Systems with Low Emissivity Material and Furred – Airspace”, 13th Canadian Conference on Building Science and Technology (13th CCBST) Conference, held in May 10 – 13, 2011 in Winnipeg, Manitoba, Canada.
16.H.H. Saber, W. Maref, and M.C. Swinton, “Thermal Response of Basement Wall Systems with Low Emissivity Material and Furred Airspace”, Journal of Building Physics, Published online in 5 August 2011, DOI: 10.1177/1744259111411652, The online
version of this article can be found at:
http://jen.sagepub.com/content/early/2011/07/30/1744259111411652.
17.H.H. Saber, W. Maref, G. Sherrer, M.C. Swinton, “Numerical Modelling and Experimental Investigations of Thermal Performance of Reflective Insulations”, Journal of Building Physics, The online version of this article can be found at:
http://dx.doi.org/10.1177/1744259112444021, April 26, 2012.
18.H.H Saber “Investigation of Thermal Performance of Reflective Insulations for Different Applications” Journal of Building and Environment, 52, p. 32-44, 2012
(doi:10.1016/j.buildenv.2011.12.010).
19.ASHRAE (2009). Chapter 25. Thermal and Water Vapor Transmission Data. ASHRAE Handbook – Fundamentals. Atlanta, GA: American Society of Heating, Refrigeration and Air-Conditioning Engineers, Inc.
20.Air- Ins inc, Performance Evaluation of Enermax Product Tested For CCMC Evaluation Purposes as per CCMC Technical Guide Master Format 07 21 31.04, Confidential Test Report Prepared for Products of Canada Corp., AS-00202-C, August 17th, 2009.
21.ASTM. 2006. ASTM C-1363, Standard Test Method for the Thermal Performance of Building Assemblies by Means of a Hot Box Apparatus, 2006 Annual Book of ASTM Standards 04.06:717–59, www.astm.org.
22.ASTM. 2003, ASTM C-518, Standard Test Method for Steady-State Heat Flux Measurements and Thermal Transmission Properties by Means of the Heat Flow Meter Apparatus, Annual Book of Standards, 04.06, 153-164, American Society for Testing and Materials, Philadelphia, Pa, www.astm.org.
23.H.H. Saber and W. Maref, “Effect of Furring Orientation on Thermal Response of Wall Systems with Low Emissivity Material and Furred-Airspace”, The Building Enclosure Science & Technology (BEST3) Conference, held in April 2-4, 2012 in Atlanta, Georgia, USA.
24.J.C. Cook, D.W. Yarbrough, and K.E. Wilkes, “Contamination of Reflective Foils in Horizontal Applications and the Effect on Thermal Performance”, ASHRAE Transactions, Vol. 95, Part 2, 677-381, 1989.
Table 1. Comparison between R-values of wall specimens with and without furring for the “Case-one foil” and “Case-two foils”
(indoor temperature = 21oC, outdoor temperature = 6oC, and foil emissivity = 0.05 for all wall specimens)
Wall specimen with
R-Value (ft2hr oF/BTU)
Contribution to R-value due to FAA (ft2
hr oF/BTU) Reduction in R-value due to Furring (%)# Increase in R-value due to installing foil on gypsum (%) Increase in the contribution to R-value due to installing foil on gypsum (%) Case-one foil Case-two foils Case-one foil Case-two foils Case-one foil Case-two foils No furring 8.347 8.730 3.773 4.156 0 0 4.6 10.2 Horizontal furring 7.148 7.344 2.574 2.770 16.8 18.9 2.7 7.6 Vertical furring 7.826 8.180 3.251 3.605 6.7 6.7 4.5 10.9
Figure 1. A schematic of vertical cross-section of wall specimen with four horizontal furring
showing the modes of heat transfer inside the enclosed airspace (Note: the drawing in Figure 1b is not to scale)
Figure 3. Vertical velocity contours (in mm/s) for wall with (a) no furring and (b) horizontal
furring (indoor temperature = 21oC, outdoor temperature = 6oC, foil emissivity = 0.05, Case-one
Figure 4. Vertical velocity contours (in mm/s) for wall with vertical furring (indoor temperature =
Figure 5. Vertical velocity contours (in mm/s) for wall with (a) no furring and (b) vertical furring
(indoor temperature = 21oC, outdoor temperature = 6oC, foil emissivity = 0.05, Case-one foil: foil
Figure 6. Effect of no furring and furring orientation on the R-value (indoor temperature = 21oC,
No Furring Horizontal Furring Vertical Furring
Case-one foil 3.773 2.574 3.251 Case-two foils 4.156 2.770 3.605 2.2 2.6 3.0 3.4 3.8 4.2 Co nt ri bu tio n to R -V al ue d ue to F A A (f t 2hr oF/ BT U )
No Furring Horizontal Furring Vertical Furring
Case-one foil 8.347 7.148 7.826 Case-two foils 8.730 7.344 8.180 6.5 7.0 7.5 8.0 8.5 9.0 R-Va lu e (f t 2hr oF/ BT U )
Reduction in the contribution to R-value due to vertical furring
(b)
Reduction in the contribution to R-value due to horizontal furring
(a)
Reduction in R-value due to horizontal furring
Reduction in R-value due to vertical furring
Figure 7. Effect of foil emissivity on the R-value of wall with horizontal and vertical furring
(indoor temperature = 21oC, outdoor temperature = 6oC, Case-one foil: foil adhered to EPS
1.0 1.5 2.0 2.5 3.0 3.5 4.0 0 0.1 0.2 0.3 0.4 0.5 0.6 0.7 0.8 0.9
Toutd= 6oC (Four Vertical Furring)
Toutd= 6oC (Four Horizontal Furring) (b)
Foil Emissivity, C o nt ri bu tio n to R -v a lu e d u e to F A A (f t 2 h r o F /B T U ) 5.5 6.0 6.5 7.0 7.5 8.0 8.5 0 0.1 0.2 0.3 0.4 0.5 0.6 0.7 0.8 0.9
Toutd= 6oC (Four Vertical Furring)
Toutd= 6oC (Four Horizontal Furring)
(a) R -V a lu e (f t 2 h r o F /B T U )
Figure 9. Contribution to R-value due to installing foil on the gypsum for walls with horizontal
and vertical furring (indoor temperature = 21oC, outdoor temperature = 6oC)
0 0.1 0.2 0.3 0.4 0.5 0 0.1 0.2 0.3 0.4 0.5 0.6 0.7 0.8 0.9
Four Vertical Furring Four Horizontal Furring
Foil Emissivity, C o nt rib ut io n to R -v al ue d ue to in st al lin g fo il o n gy ps um (f t 2 hr o F /B T U )