HAL Id: hal-02622184
https://hal.inrae.fr/hal-02622184
Submitted on 26 May 2020
HAL is a multi-disciplinary open access
archive for the deposit and dissemination of
sci-entific research documents, whether they are
pub-lished or not. The documents may come from
teaching and research institutions in France or
abroad, or from public or private research centers.
L’archive ouverte pluridisciplinaire HAL, est
destinée au dépôt et à la diffusion de documents
scientifiques de niveau recherche, publiés ou non,
émanant des établissements d’enseignement et de
recherche français ou étrangers, des laboratoires
publics ou privés.
Distributed under a Creative Commons Attribution| 4.0 International License
Pseudotsuga menziesii [Mirb.]
Florian Gautier, Kateřina Eliášová, Jean-Charles Leplé, Zuzana Vondrakova,
Anne-Marie Lomenech, Claire Le Mette, Philippe Label, Guy Costa,
Jean-François Trontin, Caroline Teyssier, et al.
To cite this version:
Florian Gautier, Kateřina Eliášová, Jean-Charles Leplé, Zuzana Vondrakova, Anne-Marie Lomenech,
et al..
Repetitive somatic embryogenesis induced cytological and proteomic changes in
embryo-genic lines of Pseudotsuga menziesii [Mirb.]. BMC Plant Biology, BioMed Central, 2018, 18, 24
p. �10.1186/s12870-018-1337-y�. �hal-02622184�
R E S E A R C H A R T I C L E
Open Access
Repetitive somatic embryogenesis induced
cytological and proteomic changes in
embryogenic lines of Pseudotsuga menziesii
[Mirb.]
Florian Gautier
1,2, Kate
řina Eliášová
3, Jean-Charles Leplé
1,4, Zuzana Vondráková
3, Anne-Marie Lomenech
5,
Claire Le Metté
1, Philippe Label
6, Guy Costa
2, Jean-François Trontin
7, Caroline Teyssier
1*†and Marie-Anne Lelu-Walter
1†Abstract
Background: To explore poorly understood differences between primary and subsequent somatic embryogenic lines of plants, we induced secondary (2ry) and tertiary (3ry) lines from cotyledonary somatic embryos (SEs) of two Douglas-fir genotypes: SD4 and TD17. The 2rylines exhibited significantly higher embryogenic potential (SE yields) than the 1rylines initiated from zygotic embryos (SD4, 2155 vs 477; TD17, 240 vs 29 g− 1f.w.). Moreover, we observed similar differences in yield between 2ryand 3rylines of SD4 (2400 vs 3921 g− 1f.w.). To elucidate reasons for differences in embryogenic potential induced by repetitive somatic embryogenesis we then compared 2ryvs 1ry and 2ryvs 3rylines at histo-cytological (using LC-MS/MS) and proteomic levels.
Results: Repetitive somatic embryogenesis dramatically improved the proliferating lines’ cellular organization (genotype SD4’s most strongly). Frequencies of singulated, bipolar SEs and compact polyembryogenic centers with elongated suspensors and apparently cleavable embryonal heads increased in 2ryand (even more) 3rylines. Among 2300–2500 identified proteins, 162 and 228 were classified significantly differentially expressed between 2ryvs 1ry and 3ryvs 2rylines, respectively, with special emphasis on“Proteolysis” and “Catabolic process” Gene Ontology categories. Strikingly, most of the significant proteins (> 70%) were down-regulated in 2ryrelative to 1rylines, but up-regulated in 3ryrelative to 2rylines, revealing a down-up pattern of expression. GO category enrichment analyses highlighted the opposite adjustments of global protein patterns, particularly for processes involved in chitin catabolism, lignin and L-phenylalanine metabolism, phenylpropanoid biosynthesis, oxidation-reduction, and response to karrikin. Sub-Network Enrichment Analyses highlighted interactions between significant proteins and both plant growth regulators and secondary metabolites after first (especially jasmonic acid, flavonoids) and second (especially salicylic acid, abscisic acid, lignin) embryogenesis cycles. Protein networks established after each
induction affected the same“Plant development” and “Defense response” biological processes, but most strongly after the third cycle, which could explain the top embryogenic performance of 3rylines.
Conclusions: This first report of cellular and molecular changes after repetitive somatic embryogenesis in conifers shows that each cycle enhanced the structure and singularization of EMs through modulation of growth regulator pathways, thereby improving the lines’ embryogenic status.
Keywords: Douglas-fir, Embryogenic potential, Proliferation, Proteomic, Cytology, Plant growth regulators
* Correspondence:caroline.teyssier@inra.fr
†Caroline Teyssier and Marie-Anne Lelu-Walter contributed equally to this
work.
1BioForA, INRA, ONF, F-45075 Orléans, France
Full list of author information is available at the end of the article
© The Author(s). 2018 Open Access This article is distributed under the terms of the Creative Commons Attribution 4.0 International License (http://creativecommons.org/licenses/by/4.0/), which permits unrestricted use, distribution, and reproduction in any medium, provided you give appropriate credit to the original author(s) and the source, provide a link to the Creative Commons license, and indicate if changes were made. The Creative Commons Public Domain Dedication waiver (http://creativecommons.org/publicdomain/zero/1.0/) applies to the data made available in this article, unless otherwise stated.
Background
Plant somatic embryogenesis is the generation of em-bryos from vegetative cells, usually in vitro. Whenever possible, it is the preferred option for true-to-type vege-tative propagation of selected genotypes as both apical and root embryonic meristems are delineated early dur-ing establishment of the embryo body plan. Thus, in contrast to other vegetative propagation technologies, there is no need for adventitious organogenesis. In re-cent years, significant advances have been made in the development of techniques to improve somatic embryo-genesis of increasing numbers of tree species, from initi-ation of embryogenic cultures to maturation of high-quality somatic embryos (SEs). Such progress to-wards large-scale production of vigorous somatic seed-lings has been reported for both hardwood [1, 2] and softwood (mostly coniferous) species (reviewed in [3]). Somatic embryogenesis techniques for propagating Douglas-fir (Pseudotsuga menziesii (Mirb) Franco), a productive conifer species of the Pinaceae family with globally appreciated wood quality, have been under de-velopment for more than 30 years [4]. There is a wealth of patented methods, but some recent improvements for steps from initiation to efficient production of somatic seedlings have just been made publicly available ([5, 6], and references therein).
Somatic embryogenesis is considered a promising bio-technology for large-scale clonal propagation of forest trees, due to the high multiplication rates it can provide [7, 8]. Moreover, embryogenic cultures are amenable to both cryogenic storage for long-term preservation of genetic resources [3,7] and genetic engineering (includ-ing genome edit(includ-ing) for functional characterization of genes expressed during embryogenesis [9]. Somatic em-bryogenesis is also a convenient experimental model sys-tem for studying embryo development [9]. The process includes well-characterized developmental stages and pathways that are mostly similar between SEs and refer-ence zygotic embryos [10], as shown recently in conifers at levels ranging from the molecular (in hybrid larch [11]) to morphological (in maritime pine [12]).
Once somatic embryogenesis has been initiated, bryogenic cultures are proliferated to sustain new em-bryo formation. In angiosperms, emem-bryogenic potential is maintained during a continuous process of repetitive, secondary (2ry
) embryogenesis, either directly from pri-mary (1ry) embryos in culture or indirectly from various cell aggregates such as proembryogenic masses or nodu-lar calli developing from 1ry SEs [13, 14]. This process typically results in clusters of new SEs that are detach-able, to varying degrees, from the previous embryo explants.
Embryogenic cultures of gymnosperms proliferate as embryonal masses (EMs), i.e. clusters of multiple
attached SEs that become interspersed with singulated SEs at an early stage of late embryogeny [4, 15]. EMs typically have a whitish to translucent appearance and may have a granular to spiky morphotype due to early embryos protruding at their surface. These immature SEs are typically bipolar structures composed of an ap-ical embryonal head (composed of dense, meristematic cells) tightly connected to a basal suspensor tissue (long, vacuolated cells). Proliferation of EMs is thought to mainly result from high cleavage ability of immature, early SEs. This process is known as cleavage polyembry-ony in gymnosperms, and can naturally occur in seeds of some genera (e.g. Pinus species). It is still unclear if cleavage polyembryony is the only process involved in early SEs’ proliferation.
SE clusters of some conifer species, such as Douglas-fir, develop into polyembryogenic center of various sizes, putatively through continuous but incom-plete cleavage polyembryony (somatic polyembryogen-esis) and /or de novo somatic embryogenesis from proliferating early SEs [6]. In addition, some Douglas-fir lines of proliferating EMs contain both immature SEs and clusters of non-embryogenic cells (NECs) [5, 16]. The occurrence of viable NECs interspersed with early SEs is apparently a characteristic feature of Douglas-fir EMs that has not been clearly documented in other conifer species ([5], Eliášová and Lelu-Walter, personal
communication). Subsequent transition from early SEs to cotyledonary SEs is stimulated when EMs are exposed to specific maturation conditions. Usual requirements for this transition, inter alia for Douglas-fir cultures [6], are supplementation of the medium with abscisic acid (ABA) in conjunction with increases in osmotic pressure (using a solution with high carbohydrate concentration, such as 0.2 M sucrose), and/or reduction of the water potential using high molecular weight polymers (such as 4000 Da polyethylene glycol, PEG 4000) or physically reducing water availability for the cultured cells by increased the medium’s gel strength.
Somatic embryogenesis of angiosperm tree species can be initiated not only from juvenile material, but also from tissues obtained from mature trees, e.g. up to 100-years-old in Quercus spp. trees [17] and even 700-year-old in Kalopanax septemlobus trees [18]. Al-though direct initiation from old tree explants is difficult and requires preliminary conditioning through in vitro and/or rejuvenation techniques (establishment of axillary shoot cultures, grafting, etc.), the embryogenic capacity of initiated lines can usually be maintained for years by repetitive somatic embryogenesis. Moreover, with mater-ial of many angiosperm species, 2ry
embryogenesis is much more efficient than 1ry embryogenesis [19] (and references therein). In contrast, initiating somatic em-bryogenesis from zygotic explant material of conifers
older than zygotic embryos or very young plants is still problematic [20, 21] (and references therein). However, it has been known for 25 years that explants derived from somatic material of Picea abies is much more re-sponsive to somatic embryogenesis induction treatment than material derived from zygotic embryos (one-mont-h-old plantlets [22]). Accordingly, the ability to initiate 2ry somatic embryogenesis has been observed in cotyle-donary SEs and somatic seedlings of various coniferous species, including Picea glauca (up to 10-year-old trees, [23]), Picea abies (up to 3-year-old plants, [22, 24,25]), Picea mariana(cotyledonary SEs, [26]), Larix x leptoeur-opaea (up to germinated SEs, [27, 28]), Abies numidica (cotyledonary SEs, [29, 30]), Pinus pinaster (up to ger-minating SEs, [31]) and more recently Douglas-fir (coty-ledonary SEs, [6]). In most species, 2ry somatic embryogenesis can be initiated at quite high frequency from cotyledonary SEs.
In conifers, 2ry somatic embryogenesis has numerous potential applications as it offers a potential means to obtain “immortal” embryogenic lines [32]. Stable lines are extremely attractive for long-term fundamental stud-ies of plant embryo development, as their use reduces severe experimental constraints, such as culture aging [19, 32]. Secondary somatic embryogenesis can also be used for restoring the embryogenic capacity of aging/ failing lines that have diminishing maturation ability and/or are producing abnormal or poor-quality embryos. Another particularly interesting practical feature is that 2rysomatic embryogenesis could be useful for improving the embryogenic potential of some species’ embryogenic lines. For example, 2ry EMs are reportedly more pro-ductive than 1ry cultures of some embryogenic lines of hybrid larch [27] and maritime pine [31]. Similarly, 2ry lines obtained from recalcitrant genotypes of Douglas-fir with low embryogenic potential (< 500 SEs g− 1EMs f.w.) have been found to be significantly more productive than 1rylines [6].
The reasons for such differences in embryogenic po-tential between 2ry and 1ry lines of conifers are largely unknown, and have only been previously examined in one study focused on Pinus pinaster [31]. Clearly, de-tailed knowledge of cytological and molecular events that occur in proliferating embryogenic lines during re-petitive somatic embryogenesis cycles are required. In the study presented here we attempted to acquire such knowledge, and test the hypothesis that during 2ry som-atic embryogenesis selective processes may occur that promote development of embryogenic cells and EMs with high capacities to proliferate and regenerate cotyle-donary SEs.
In contrast to macromorphological observations, cyto-logical features of EMs during proliferation are reliable indicators of embryogenic lines’ ability to produce
cotyledonary SEs. In Norway spruce, only EMs showing immature SEs with a dense embryonal head clearly sepa-rated from a well-defined suspensor region can reportedly develop further into cotyledonary SEs [33], at least under conditions applied in the cited study. In pine species, em-bryogenic potential is reduced in over-propagated EMs due to aging effects (reviewed in [8]). Such poor per-formance at the maturation step was shown to be asso-ciated with substantial progressive changes in cellular organization during proliferation in Pinus pinaster, resulting in reduced frequencies of immature SEs cap-able of completing the last stages of late embryogenesis [34]. In both maritime pine and Douglas-fir, prolifera-tion of EMs in the presence of maltose as the main car-bon source can greatly improve the key cytological features of immature SEs [5,35].
Recently, the development of novel, high-resolution proteomic methods has offered opportunities for both untargeted qualitative proteome coverage and quantita-tive measurement of proteins involved in plant develop-ment. These proteomic analyses have already improved understanding of the metabolic and signaling pathways involved in plant somatic embryogenesis [9, 36, 37]. In conifers, significant changes in protein expression during early and late somatic or zygotic embryogenesis, have been reported as reviewed in [21], in various species in-cluding members of Pinaceae family, such as Picea glauca [38], Picea abies [39], Larix spp. [40–42], Pinus massoniana[43] and Pinus pinaster [12,44].
The main objective in the work presented here was to study cellular and proteomic changes induced by repetitive somatic embryogenesis in Douglas-fir. For this purpose, somatic embryogenesis was induced in cotyle-donary SEs to obtain 2ry lines, and 2ry EMs were com-pared to 1ry EMs in terms of embryogenic potential, cytologicaly and protein patterns during proliferation. To deepen understanding of repetitive somatic embryo-genesis, tertiary (3ry) lines were produced from cotyle-donary SEs of 2ry lines via a third cycle of somatic embryogenesis, and 3ryEMs were compared to 2ryEMs. This is the first report of two successive cycles of repeti-tive somatic embryogenesis in conifers. We first com-pared 2ryEMs to 1ryEMs, then 2ryto 3ryEMs. However, cells of 3ryEMs do not directly stems from 1ryEMs, and many subcultural steps involving physiological aging of the tissues could occur between them. Thus, we did not compare 1ry and 3ry EMs to avoid possible complexities irrelevant to aims of this study.
We obtained the first evidence of cytological and proteomic changes in proliferating EMs of Douglas-fir with increasing embryogenic potential following repeti-tive somatic embryogenesis. Interestingly, the proteomic analysis further revealed different sets of proteins that are significantly differentially expressed between 2ryand
1ryEMs, and between 2ryand 3ryEMs (hereafter “signifi-cant” proteins), suggesting that each cycle of repetitive somatic embryogenesis promotes substantial genome-wide rearrangement of gene expression patterns. In addition, Sub-Network Enrichment Analysis (SNEA) was performed to elucidate the functions and interactions of identified pro-teins, and the results show that this novel approach for studying conifer somatic embryogenesis can yield valuable information.
Methods Plant material
Pseudotsuga menziesiitrees involved in this work are de-scendants of trees with provenances in North Bend (ge-notypes 4455 and 4456) or Enumclaw (4466 and 4477), Washington (USA). They were used as parental trees to perform the following control crosses at INRA (Orléans, France): 4455 × 4466 and 4456 × 4477. Somatic embryogenesis was induced from seed ex-plants (isolated immature zygotic embryos at the pre-cotyledonary developmental stage) following pub-lished methodology [5]. Primary embryogenic lines SD4 (4456 × 4477) and TD17 (4455 × 4466) were ini-tiated in 2011 and 2012, respectively [6].
Methods
Proliferation of embryonal masses
EMs were sub-cultured in clumps every 2 weeks on Glitz proliferation medium, consisting of modified Litvay medium [45, 46] supplemented with 4.5 μM 2,4-D (2,4-dichlorophenoxyacetic acid), 2.2μM BA (6-benzyla-denine) and 0.087 M maltose, solidified with 4 g L− 1
gellan gum. When necessary, EMs were cultured as a thin layer dispersed on a filter paper disc (300 mg f.w. per filter) to promote proliferation, as previously de-scribed [6]. The pH of each medium was adjusted to 5.8 before autoclaving.
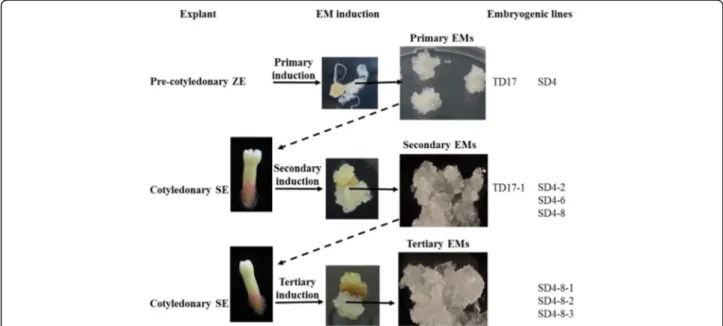
Repetitive somatic embryogenesis (Fig.1)
Two cycles of repetitive somatic embryogenesis were performed, following published protocols [6]. Briefly, for the first induction cycle, 6- to 11-week-old cotyledonary SEs (see maturation section) regenerated from 1ry em-bryogenic lines SD4 and TD17 were isolated and trans-ferred to Glitz initiation medium supplemented with 4.5 μM 2,4-D, 4.4 μM BA and 0.087 M sucrose, solidi-fied with 4 g.L− 1gellan gum. Each 2ryEM, initiated from a single SE, was then subcultured as described above for proliferation. We obtained 2ry embryogenic lines desig-nated SD4–2, SD4–6 and SD4–8 from the 1ry
line SD4, and a 2ry line designated TD17–1 from the 1ry TD17 line. For the second induction cycle, cotyledonary SEs obtained from 2ryline SD4–8 were similarly used as ex-plants to initiate 3rylines, designated SD4–8-1, SD4–8-2 and SD4–8-3.
Morphological and histo-cytological observations during proliferation
Samples were collected after 10 days of multiplication for morphological and histo-cytological characteriza-tions. Morphology of EMs was documented using a SMZ 1500 stereomicroscope (Nikon, Tokyo, Japan), and their structure was examined using a Jenaval transmis-sion light microscope (Zeiss, Jena, Germany) after
Fig. 1 Origin of the Douglas-fir material analyzed in this work (1ry, 2ryand 3ryembryogenic lines). EMs: embryonal masses; SE: somatic embryo;
staining fresh material with 0.4% (w/v) Trypan Blue (Sig-ma-Aldrich), as previously described [47]. Starch grains were localized by staining with Lugol (iodine-potassium iodide) solution. Paraffin sections (12 μm thick) of EMs samples stained with Alcian Blue and Nuclear Fast Red following fixation, dehydration and paraffin infiltration [6], were observed under a Jenaval light microscope for histological observations. In addition to cell walls, Alcian Blue may stain vacuolar contents of some cells, and EMs’ colors indicate that some may accumulate phenolic com-pounds. Therefore, Azur II and Safranin dyes (known to stain phenolic compounds) were also used, and confirmed that some of the Alcian Blue staining was due to its com-plexation with phenolics. All images were captured using a DS-5 M camera (Nikon, Tokyo, Japan) and processed using NIS-Elements AR 3.2 image analysis system (La-boratory Imaging, Prague, Czech Republic).
Maturation conditions
Proliferating EMs from filter papers were weighed, dis-persed in liquid Glitz medium without plant growth reg-ulators and distributed on a filter paper disc placed on the surface of Glitz maturation medium (in a Petri dish) supplemented with 0.2 M sucrose, 60μM ABA (cis-trans ± abscisic acid), and 10 g L− 1gellan gum at a cell dens-ity of 50 mg f.w. per filter. The EMs were then matured in darkness at approximatively 23 °C. The number of cotyledonary SEs generated in each Petri dish after 8 weeks was counted, and EMs’ embryogenic potential (number of SEs per g f.w. EMs) was estimated. In a first set of experiments, the embryogenic potential of 1rylines (SD4, TD17) and 2ry lines (SD4–2, SD4–6, SD4–8, TD17–1) were compared using 96 Petri dishes (5–6 for each permutation of line and conditions, with sets of three biological replicates). In a second set of experi-ments we compared the embryogenic potential of 2ry (SD4–8) and 3ry (SD4–8-1, SD4–8-2, SD-4-8-3) lines, using 6 Petri dishes for each permutation of lines and conditions, and experiments were repeated three times, so 72 Petri dishes were used in total.
Soluble proteins extraction
Analyses were performed for all types of lines (1ry, 2ry and 3ry), with EMs cultured as a thin layer dispersed onto filter paper. Soluble proteins extracts were prepared from four biological replicates for each samples (150 mg f.w. of frozen EMs) with 1 ml of urea extraction buffer (4 M urea, 0.1% v/v SDS 10%, 0.1 M DTT, 80 mM Tris HCl pH 6.8, 10% v/v glycerol). Total protein content was determined using the Bradford assay with bovine serum albumin as a standard. Results were expressed as soluble proteins content (μg mg− 1of dry weight).
Proteomic and label-free quantitative MS/MS data analyses
Proteomic and nLC-MS/MS analyses were performed following previously published protocols [48]. Briefly, protein samples were subjected to SDS-PAGE and stained with colloidal blue, then stained bands were cut from the gel, destained and digested by trypsin. The resulting peptide mixtures were analyzed using an Ul-timate 3000 nanoLC system (C18 PepMapTM trap col-umn, Dionex, Amsterdam, The Netherlands) coupled to an Electrospray Q-Exactive quadrupole Orbitrap bench-top mass spectrometer (Thermo Fisher Scientific, San Jose, CA). The mass spectrometer was operated in posi-tive ion mode at 1.8 kV needle voltage. Data were ac-quired using Xcalibur 2.2 software in a data-dependent mode. MS scans (m/z 350–1600) were recorded at a resolution of R = 70,000 (at m/z 200) with an AGC target of 3E6 ions collected within 100 ms. Dynamic exclusion was set to 30 s and the top 15 ions were selected from fragmentation in HCD mode. MS/MS scans with a tar-get value of 1E5 ions were collected with a maximum fill time of 100 ms and resolution of R = 17,500. Addition-ally, only + 2 and + 3 charged ions were selected for frag-mentation. Acquired peptide were searched by SEQUEST implemented in Proteome Discoverer 1.4 (Thermo Fisher Scientific Inc.) against a Pseudotsuga menziesii v1 transcriptome – proteome database from PineRefSeq (54,595 entries, August 2016,
https://tree-genesdb.org/FTP/Genomes/Psme/v1.0/annotation/).
Spectra from peptides larger than 5000 Da or smaller than 350 Da were rejected and mass accuracy of the monoisotopic peptide precursor and peptide fragments was set to 10 ppm and 0.02 Da, respectively. Only b-and y-ions were considered for mass calculations. Oxida-tion of methionine (+ 16 Da) was considered as a vari-able modification and carbamidomethylation of cysteines (+ 57 Da) as a fixed modification. Two missed trypsin cleavages were allowed. Peptide were using the Percola-tor algorithm [49] and only “high confidence” peptides were retained, corresponding to a < 1% False Discovery Rate (FDR) at peptide level. Raw LC-MS/MS data were imported into Progenesis QI for Proteomics 2.0 (Nonlear Dynamics Ltd., Newcastle, U.K). Data processing in-cluded the following steps: (i) features detection, (ii) features alignment across all samples, (iii) volume inte-gration for 2–6 charge-state ions, (iv) raw data normalization based on medians of ratios of all inten-sities of relevant fragments to references (calculated from LC-MS features), (v) import of sequence informa-tion, and calculation of protein abundance (sums of vol-umes of corresponding peptides). Only non-conflicting features and unique peptides were considered for pro-tein level calculation. Quantitative data were considered for proteins quantified by a minimum of two peptides. The mass spectrometry proteomics data have been
deposited in the ProteomeXchange Consortium databa-sevia the PRIDE [50] partner repository with the dataset identifier PXD008347.
Functional characterization and gene ontology analysis
Changes in expression, relative to appropriate controls, were calculated based on the cumulative intensity of each peptide (classifying proteins with ≥1.5-fold change ratios as up- or down-regulated). All sequences were mapped against Gene Ontology (GO) terms in the TAIR Arabidop-sis thaliana database (https://www.arabidopsis.org/) for functional annotation. The proteins were then classified based on their biological functions using Web Gene Ontology Annotation Plot software at level 2 for biological processes (Panther, http://pantherdb.org/) [51]. A bino-mial test and Bonferroni’s correction were applied with Panther software to identify classes represented signifi-cantly more frequently than expected among up- and down-regulated proteins in each type of material. As the gene ontology is currently extremely poor for Douglas-fir, we also applied another method to assess enrichment of GO terms in our protein sets, using the Bioconductor R package topGO 2.26.0 [52], based on the“weight” method and Fisher’s exact test. We compared the sets of signifi-cant proteins against the 4813 Douglas protein total data-set, and mapped each protein to the best Arabidopsis homolog by BlastP searches. Then, each GO term from Arabidopsis thalianawas associated with the correspond-ing Douglas protein for topGO analysis.
Network enrichment analysis
Sub-Network Enrichment Analysis (SNEA) was per-formed using Pathway Studio® version 11.4 (Elsevier B.V.).
Statistical analyses
R software (version 3.3.2; R Development Core team 2011) was used for all statistical analyzes. Embryogenic potential and the soluble protein contents of 1ry, 2ryand 3ry lines were evaluated using one-way analysis of vari-ance (ANOVA) and multiple comparisons of means with Tukey contrasts (P < 0.05). For proteomic analysis, dif-ferential expression of proteins in 1ryvs 2rylines, and 2ry vs 3ry lines, was analyzed using two-way ANOVA with interaction and FDR, based on normalized abundance (adjusted P < 0.05).
Results
Embryogenic potential of Douglas-fir embryogenic lines after repetitive somatic embryogenesis.
Secondary vs primary embryogenic lines of TD17 and SD4 genotypes
In the initial comparison of the embryogenic potential of 1ry (TD17 and SD4) and 2ry (TD17–1, SD4–2, SD4–6 and SD4–8) lines, the primary lines showed significant vari-ations in mean production of cotyledonary SEs (P = 3.01e−
7
). SD4 was moderately embryogenic (478 SEs g− 1 f.w.) whereas TD17 showed very weak embryogenic potential (30 SEs g− 1f.w., Table 1). However, in both cases 2rylines were significantly more productive than 1rylines (SD4 P = 9.47e− 7and TD17 P = 2.88e− 10). TD17–1 was 8 times more productive (generating 241 SEs g− 1f.w., Table1) than the original TD17 line, while 2ry lines of SD4 yielded 3–4 (SD4–6, SD4–8) to 6 times (SD4–2) more cotyledonary SEs (1515–3131 SEs g− 1f.w. Table1).
Tertiary vs secondary embryogenic lines of SD4 genotype
In the subsequent comparison of the embryogenic po-tential of 2ry (SD4–8) and 3ry (SD4–8-1, SD4–8-2 and SD4–8-3) lines, SE yields of the three 3ry
lines were very high (3344–4258 SEs g− 1 f.w., Table 2). However, only
SD4–8-2 and SD4–8-3 had significantly higher (P = 0.00337) yields (4160 and 4258 SEs g− 1f.w., respectively) than SD4–8 (2401 SEs g− 1f.w.).
Histo–cytological description of Douglas-fir EMs
Macromorphological (EM color and morphotype) and histo-cytological traits (occurrence of polyembryogenic centers, singulated SEs and NECs) of primary (SD4, TD17), secondary (SD4–2, 6, 8; TD17–1) and tertiary (SD4–8-1, 2, 3) embryogenic lines of Douglas-fir are summarized in Additional file1: Table S1.
Morphology of primary, secondary and tertiary EMs
EMs of both genotypes and all types of lines (1ry, 2ry, 3ry) had various colors; usually shades of yellow and brown, but some lines (especially SD4) were rather pink (Additional file 2: Figure S1) indicating local
Table 1 Mean yield in cotyledonary somatic embryos (SEs) of
Douglas-fir from 1ryand 2ryembryogenic lines
Line Mean no. of SEs g− 1f.w. Primary TD17 30 ± 19a SD4 478 ± 139c Secondary TD17–1 241 ± 70b SD4–2 3131 ± 34e SD4–6 1515 ± 297d SD4–8 1821 ± 363d
Values are means of 3 biological and 5–6 technical replicates ±95% confidence limits. Significant differences (p < 0.05) in multiple comparisons of means are indicated by different letters
accumulation of phenolic compounds in their cells, as confirmed by histological-level histochemical staining (see below), and activation of phenolic pathways in the 1ry lines (see below). The structure of immature early SEs proliferating in EMs was hardly distinguishable in the 1ry lines. However, the EMs’ surfaces had notable granularity, particularly those of line SD4 (Additional file
2: Figure S1), which could indicate occurrence of large polyembryogenic centers. Detailed observations also re-vealed filamentous suspensor cells attached to a few of these structures escaping from the EMs’ surfaces. In contrast, distinct, compact and granular large polyem-bryogenic centers and/or whitish singulated early SEs were apparent on most EMs of 2ry and 3ry lines, espe-cially those of lines TD17–1, SD4–2, SD4–8-1 and SD4– 8-3, in which the bipolar structure of protruding early embryos could sometimes be distinguished (Additional file 2: Figure S1, arrows). EMs from 2ry line SD4–6 re-sembled those of the 1ry line, while EMs of SD4–8 did not exhibit a typical granular morphotype and had a smoother appearance, suggesting that polyembryogenic centers or singulated embryos of this line are less fre-quent and/or smaller (Additional file2: Figure S1). EMs from 3ry line SD4–8-2 most resembled EMs from 2ry line SD4–2, but had fewer distinct structures with granular appearance.
Histological comparison of secondary (TD17–1, SD4–2,
SD4–6, SD4–8) and primary (SD4, TD17) embryogenic lines
Primary lines of both genotypes TD17 and SD4 pro-duced large polyembryogenic centers, with broad meri-stematic parts and usually elongated suspensor cells, collectively creating compact cell“packages” with cells joined together by a mucilaginous matrix (Figs. 2, 3, 4 and 5), Additional file3: Figure S2). Besides these polyembryogenic centers, singulated early embryos with a large well-organized embryonal head connected to a compact and long suspensor were also formed (Fig. 3d). Smaller embryos composed of several layers of meristematic cells and a few elongated sus-pensor cells were also often found in, or close to, dead ma-terial formed by remnants of suspensor cells or disintegrated
early embryos (Figs.2c, d,4a, h,5b, e). Meristematic cells of these small embryos were usually mitotically active (Fig.3c).
Both genotypes also produced clusters of NECs, as either groups of loosely arranged vacuolated cells (Additional file 4: Figure S3A) or organized, compact cell aggregates (Additional file 4: Figure S3B), both located in the proximity of early embryos. All ob-served cell clusters were examined very carefully in successive sections to avoid possible confusion of NECs with embryonal cells, especially with suspensor cells, which are also vacuolated. Cell clusters were considered non-embryogenic if none of their cells in any section exhibited characteristics of meristematic cells, i.e. dense cytoplasm, prominent nuclei and small vacuoles with no detectable phenolic content. Large NEC clusters usually consisted of a mixture of irregularly shaped vacuolated cells that were either mitotically active (Additional file 4: Figure S3) or ac-cumulated starch grains and/or phenolic compounds (Additional file 4: Figure S3B,C,E,F). Phenolic com-pounds were apparently deposited in vacuoles as granules or droplets, resulting in brownish cells that were easily recognizable in aggregates with cell walls stained blue and both nuclei and cytoplasm (slightly) stained pink/red (see Fig. 4c). Surprisingly, phenolics accumulating in vacuoles as amorphous deposits reacted differentially with Alcian Blue, forming com-plexes of various colors from grey-blue to ginger, suggesting they had variable chemical composition (Additional file 4: Figure S3B,E,F). Alcian Blue stain-ing of phenolic compounds was confirmed histo-chemically by other dyes (Azur II and Safranin; data not shown). The occurrence of NEC aggregates in-terspersed in EMs was found to vary between lines as described below. However, repetitive somatic em-bryogenesis globally resulted in reduced frequency of NEC clusters and, concurrently, in reduced phenolic contents in EMs.
TD17 vs TD17–1
Both 1ryand 2rylines of genotype TD17 produced all types of embryogenic structures mentioned above (Additional file3: Figure S2, Fig.3), but most frequently large polyem-bryogenic centers (Fig. 3a, b), while small embryos (Fig.
3c) were quite rare in both lines. Large singulated SEs with a well-organized embryonal head were more frequent in the 2ry line TD17–1 (Fig. 3d). NECs were observed in TD17 as loosely arranged cells (Additional file 4: Figure S3A) or compact cell clusters (Additional file 4: Figure S3B) in the vicinity of embryos or even in the dead mater-ial. The TD17–1 2ry
line produced much fewer NEC clus-ters. Only small pieces were observed close to early embryos or (more often) in the dead material.
Table 2 Mean yield in cotyledonary somatic embryos (SEs) of
Douglas-fir from 2ryand 3ryembryogenic lines
Line Mean no. of SEs g−1f.w. Secondary SD4–8 2401 ± 534a Tertiary SD4–8-1 3344 ± 1274ab SD4–8-2 4160 ± 931b SD4–8-3 4258 ± 829b
Values are means of 3 biological and 5–6 technical replicates ±95% confidence limits. Significant differences (p < 0.05) in multiple comparisons of means are indicated by different letters
SD4 vs SD4–2, SD4–6, SD4–8
Primary line SD4 is characterized by the production of large structures resembling polyembryogenic cen-ters (Figs. 2a, 4a, b). The meristem-like parts of these structures were usually formed by a mixture of densely cytoplasmic meristematic cells and vacuolated cells that often accumulated starch grains and/or phenolic compounds (Fig. 4c). Meristematic cells usu-ally occurred in one part of the structure forming a compact meristemoid or embryonal head-like struc-ture. This was probably only a small part or a few cell layers of the polyembryogenic centers, as the inner region was mainly formed by vacuolated cells. Protodermal cells usually created smooth surfaces of this meristem-like region (Fig. 4b). However, the
outermost cell layer could deteriorate in some parts, resulting in missing protoderm and local cell organization very similar to that of NEC clusters (Fig.
4b). Elongated suspensor cells were only present in the outermost region of the cell “package” or simply missing. The inner region, located distally from the meristem-like region, consisted of loosely arranged, ir-regularly shaped cells. Small embryos with a typical bipolar arrangement of meristematic and suspensor cells occurred rarely among the dead remnants of suspensor cells in the most distal region of the struc-ture (Fig. 4a).
In contrast to the 1ry line, 2ry lines produced well-arranged polyembryogenic centers of various sizes formed by compact meristematic parts joined
Fig. 2 Structure of embryonal masses from primary, secondary and tertiary lines of genotype SD4. a / SD4; b / SD4–2; c / SD4–8; d / SD4–8-1; e / SD4–8-2 f / SD4–8-3. Arrowheads in c, d mark small singulated somatic embryos; m – meristem of polyembryogenic centers, s – suspensor; Trypan blue staining of squashes of fresh EMs. Scale bar = 500μm
together with elongated suspensor cells. The most typical polyembryogenic centers with distinct embry-onal heads were observed in SD4–2 (Figs. 2b, 4d) to-gether with small individual embryos located in suspensors (Fig. 4e). In this line, additional large structures arranged in a similar way to polyembryo-genic centers were observed, but some parts were composed of vacuolated cells with starch grains resem-bling NECs. On the edges of these structures, cells accu-mulated phenolic compounds creating a frontier between a compact meristem-like part and suspensor cells (Add-itional file4: Figure S3E). SD4–6 material consists in nu-merous small embryos or small polyembryogenic centers with noticeable embryonal heads (Fig. 4f,g) as well as a few polyembryogenic centers of huge size. There were nu-merous large compact pieces of NECs located in the vicin-ity of embryos. Large, very compact and highly organized cell structures resembling meristemoids were the most typical types of non-embryogenic structure produced by line SD4–6 (Additional file4: Figure S3F). These “meriste-moids” were isolated from other parts of the clumps by groups of cells with high phenolic contents. Line SD4–8 only produced small embryos and smaller polyembryo-genic centers that were not very well organized (Fig.4h,i). Like other 2rylines, SD4–8 also produced NECs, arranged
in clusters of vacuolated cells accumulating starch grains and/or phenolics, similar to those observed in TD17 (Additional file4: Figure S3B).
Histological comparison of tertiary (SD4–8-1; SD4–8-2;
SD4–8-3) and secondary (SD4–8) embryogenic lines
Tertiary lines produced more, and much bigger, poly-embryogenic centers but fewer NEC clusters than the 2ry line SD4–8. Line SD4–8-1 produced large polyem-bryogenic centers and clusters of large singulated early embryos with distinct embryonal heads (Figs.
2d, 5a,b) and small embryos within suspensors (Fig. 5b). Lines SD4–8-2 typically produced large numbers of smaller polyembryogenic centers and smaller embryos (Fig. 2e, 5c,d) while large polyem-bryogenic centers were found less organized with some signs of disintegration of both meristems and suspensors. Line SD4–8-3 was characterized by large polyembryogenic centers with numerous distinct em-bryonal heads joined to very dense suspensors formed of elongated cells. Each of these polyembryogenic centers was attached to another by an “anchor” of dead suspensor cells. Small embryos appeared within or in the vicinity of suspensors (Figs. 2c, 5e,f).
Fig. 3 Histology of embryonal masses from primary and secondary lines of the genotype TD17. a, c / TD17; b, d / TD17–1. a,b – polyembryogenic centers (PECs); c– small SEs, arrowheads point to actively dividing cells (metaphase/anaphase); d – singulated large SEs; m– meristem of PECs or singulated SEs, s – suspensor; Paraffin sections stained with Alcian Blue/Nuclear Fast Red. Scale bars: a, d, f = 500 μm; b = 100μm; c = 200 μm; e = 50 μm
Total protein content and proteomic analysis Total protein content
The total protein content was similar in both genotypes SD4 and TD17 (mean values: 113.4 and 98.3 μg mg− 1
d.w., respectively) and in both 1ry and 2ry lines (mean values: 107.2 and 108.9μg mg− 1d.w., respectively, Add-itional file5: Table S2). Higher protein contents were de-tected in 3ry than in 2ry lines (mean values: 137.5 and
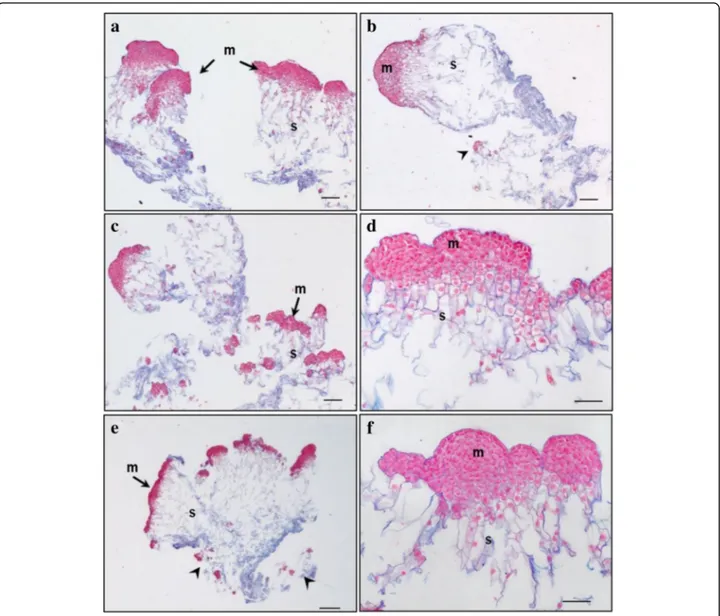
Fig. 4 Histology of embryonal masses from primary and secondary lines of the genotype SD4. a, b, c / SD4; d, e / SD4–2; f, g / SD4–6; h, i / SD4–8. a, b– structures resembling the polyembryogenic centers (PECs) Arrow in a points to small somatic embryos (SEs) and the star marks the dead material in the end of suspensor region; arrow in b points to the smooth surface of protoderm and arrowhead marks the place where protoderm is missing; the detail of the framed region in b is shown in c; arrow in c points to the brown cells with phenolic content located in the meristem-like region; d– PEC; e– singulated SEs, f – cluster of small SEs and PECs; g – well-organized SEs; h – small SEs; i – small PECs; m – meristem of PECs or singulated SEs, s– suspensor. Paraffin sections stained with Alcian Blue/Nuclear Fast Red Scale bars: a, b = 500 μm; c = 50 μm; d, e, g, h, I = 100 μm; f = 200 μm
110.8μg mg− 1d.w., respectively, Additional file6: Table S3) of genotype SD4, but the observed difference is not significant.
Proteomic comparisons of secondary (TD17–1; SD4–2; SD4–
6; SD4–8) vs primary (SD4, TD17) and tertiary (SD4–8-1;
SD4–8-2; SD4–8-3) vs secondary (SD4–8) embryogenic lines
In the LC-MS/MS analysis of total protein extracts and changes in protein expression (detailed in the Methods section) we identified 2293 proteins in the comparison of 2ryvs 1rylines, and 2554 in the comparison of 3ryvs 2ry lines, so a set of 4813 unique proteins. Principal component analysis (PCA) is a multivariate technique that analyzes a data set with inter-correlated quantitative dependent variables to represent it as a set of new
orthogonal variables called principal components dis-playing the pattern of similarities. The first principal component (PC1 axis) obtained from PCA of the 2293 proteins identified in 1ry and 2ry lines (Fig. 6a) was mainly related to the genotype and explained 35% of the total variance. PC2 axis was mainly related to interaction between genotype and type of line (1ry, 2ry), and explained 16% of the total variance. PC1 ob-tained from PCA of all 2554 proteins identified in 2ry and 3ry lines of genotype SD4 explained 65% of the total observed variance and type of line was the main determinant (Fig. 6b).
In the subsequent two-way ANOVA of changes in pro-tein expression following the first and second cycles of somatic embryogenesis, 162 and 288 significant proteins
Fig. 5 Histology of embryonal masses from tertiary lines of the genotype SD4. a, b / SD4–8-1; c,d / SD4–8-2; e,f / SD4–8-3. a, b –
Polyembryogenic centers (PECs) Arrowheads in b points to small SEs; c– PECs, smaller ones with distinct embryonal heads; d – detail of PEC; e– PECs, arrowheads points to small SEs; f – detail of PEC with well-organized embryonal heads; m – meristem of PEC, s – suspensor. Paraffin sections stained with Alcian Blue/Nuclear Fast Red. Scale bar: a, b, c = 200μm; d, F = 100 μm; e = 500 μm
were identified in the comparisons of 2ryvs 1rylines and 3ry vs 2ry lines, respectively (Additional file7). Most sig-nificant proteins were down-regulated in 2ry relative to 1ry lines, but up-regulated in 3ry relative to 2ry lines (76 and 70% of the sets, respectively). Surprisingly, only 33 proteins were members of both sets, moreover 9 of these 33 were up-regulated following both somatic embryo-genesis cycles, 3 were down-regulated following both
cycles and there were opposite changes in expression of the other 21 proteins. Thus, specific sets of differentially expressed proteins, and changes in expression profiles, were associated with each cycle of somatic embryogen-esis. In Additional file8: Table S4 presents the functional GO classifications of the 162 (2ry
vs 1ry) and 228 (3ryvs 2ry) significant proteins. The most strongly represented cat-egories are“Metabolic Processes”, “Cellular Processes” and
a
b
Fig. 6 Principal component analysis of proteins identified during the proteomic studies. a / Comparison between the 1ryand 2rylines; b /
“Response to Stimulus” (respectively accounting for 52.9, 27.3 and 6.6% of the first set, and 46.0, 30.7 and 7.4% of the second set).
Results of GO category enrichment analyses (Term Enrichment) using Panther and Biocoductor R of overall trends of the functional categories enriched in the lines following the cycles are shown in Table3and Fig. 7, re-spectively. Proteins involved in “Proteolysis” and “Cata-bolic process” categories were over-represented in both sets of significant proteins (Fig. 7). Many GO terms are enriched in significant proteins associated with both cy-cles of somatic embryogenesis (Table 3), including pro-cesses involved in chitin and polysaccharide catabolism, lignin and L-phenylalanine metabolism, phenylpropa-noid biosynthesis, oxidation-reduction, and response to karrikin. Strikingly, the expression of proteins assigned to these GO term categories declined following the first cycle but increased after the second cycle, corroborating the finding that different protein profiles were estab-lished after each cycle of somatic embryogenesis. The SNEA of significant proteins is based on Arabidopsis thaliana bibliographic database, which implies the net-work representation with Arabidopsis protein names. The SNEA provided further indications of their func-tions, interactions and putative targets, as well as regula-tors involved in metabolic pathways that may be affected during repetitive somatic embryogenesis (Fig. 8a,b). Overall, 70 significant proteins up- or down-regulated after 2ry (33 proteins) or 3ry somatic embryogenesis (51 proteins) were integrated in the constructed networks. They included many proteins associated with metabol-ism of plant growth signaling compounds, including
plant growth regulators such as jasmonic acid, ABA and salicylic acid, together with proteins related to lignin (es-pecially after 3ry somatic embryogenesis) and flavonoid secondary metabolites (especially after 2ry somatic em-bryogenesis). Indole-3-acetic acid (IAA) was revealed as an important regulator associated with both networks. The subsets of significant proteins and targets/regulators in each network were mostly specific for each cycle of somatic embryogenesis, but affected the same major bio-logical processes (“plant development” and “defense re-sponse”). In the latter case, plant growth signaling compounds, such as jasmonic acid, salicylic acid and ABA and many other molecules identified in these net-works (including secondary metabolites) have known in-volvement not only in adaptation to stress (defense responses, detoxification and drought stress/hyperosmo-tic salinity responses), but also in non-defensive func-tions during plant development.
Eleven significant proteins involved in the networks (PAL2, CCR1, LOX1, DOX1, ERD9, P5CS1, DFR, C17L7.80, OMT1, PKT3, ALDH2B7, Arabidopsis anno-tation) were down-regulated following the first cycle of repetitive somatic embryogenesis and up-regulated fol-lowing the second cycle. Interestingly, two others were up-regulated following both cycles and identified as endochitinase EP3 and E3 ubiquitin-protein ligase ARI1, both of which are involved in embryo development and pathways such as controlled proteolysis in conifers.
Among the significant proteins, one is related to the RNA-induced silencing complex (RISC), a ribonucleo-protein. RISC is known to incorporate the microRNAs (miRNAs) MIR165A and MIR166A to cleave the
b
a
Fig. 7 Enrichment analysis of GO (Gene ontology) terms of the Biological Process categories (at level 2 or more). GO terms found to be significantly enriched between a/ 1ry(TD17, SD4) and 2ry(TD17–1, SD4–2, SD4–6, SD4–8) embryogenic lines or b/ 2ry(SD4–8) and 3ry(SD4–8-1,
SD4–8-2, SD4–8-3) embryogenic lines of Douglas-fir. Fold change (FC) corresponds to the ratio of the number of identified hits between 2ryand
Table 3 Gene Ontology (GO) terms enriched in significant proteins after repetitive somatic embryogenesis in Douglas-fir
GO.ID Term Annot. Sign. Exp. ratio sign./exp. Expression
Secondary versus primary lines
GO:0015977 carbon fixation 17 2 0.13 15.38 2ry> 1ry
GO:0009269 response to desiccation 17 2 0.13 15.38 2ry> 1ry
GO:0006099 tricarboxylic acid cycle 38 2 0.28 7.14 2ry> 1ry
GO:0015979 photosynthesis 43 2 0.32 6.25 2ry> 1ry
GO:0051603 proteolysis involved in cellular protein catabolic process 142 5 1.05 4.76 2ry> 1ry
GO:0043488 regulation of mRNA stability 2 2 0.05 40.00 1ry> 2ry
GO:0046292 formaldehyde metabolic process 4 2 0.1 20.00 1ry> 2ry
GO:0006556 S-adenosylmethionine biosynthetic process 7 3 0.18 16.67 1ry> 2ry
GO:0006097 glyoxylate cycle 7 3 0.18 16.67 1ry> 2ry
GO:0010030 positive regulation of seed germination 5 2 0.13 15.38 1ry> 2ry
GO:0051262 protein tetramerization 6 2 0.15 13.33 1ry> 2ry
GO:1901663 quinone biosynthetic process 13 4 0.33 12.12 1ry> 2ry
GO:0006558 L-phenylalanine metabolic process 15 4 0.38 10.53 1ry> 2ry GO:0009969 xyloglucan biosynthetic process 8 2 0.2 10.00 1ry> 2ry GO:0009051 pentose-phosphate shunt, oxidative branch 8 2 0.2 10.00 1ry> 2ry
GO:0042593 glucose homeostasis 8 2 0.2 10.00 1ry> 2ry
GO:0010262 somatic embryogenesis 14 3 0.35 8.57 1ry> 2ry
GO:0006032 chitin catabolic process 22 4 0.55 7.27 1ry> 2ry
GO:0009813 flavonoid biosynthetic process 58 9 1.46 6.16 1ry> 2ry
GO:0002215 defense response to nematode 13 2 0.33 6.06 1ry> 2ry
GO:0006730 one-carbon metabolic process 27 4 0.68 5.88 1ry> 2ry
GO:0080167 response to karrikin 44 6 1.11 5.41 1ry> 2ry
GO:0009699 phenylpropanoid biosynthetic process 93 12 2.34 5.13 1ry> 2ry
GO:0008219 cell death 77 9 1.94 4.64 1ry> 2ry
GO:0016998 cell wall macromolecule catabolic process 26 3 0.65 4.62 1ry> 2ry
GO:0006555 methionine metabolic process 28 3 0.71 4.23 1ry> 2ry
GO:0009611 response to wounding 129 13 3.25 4.00 1ry> 2ry
GO:0009787 regulation of abscisic acid-activated signaling pathway 30 3 0.76 3.95 1ry> 2ry
GO:0009411 response to UV 53 5 1.33 3.76 1ry> 2ry
GO:0009808 lignin metabolic process 85 8 2.14 3.74 1ry> 2ry
GO:0000272 polysaccharide catabolic process 64 6 1.61 3.73 1ry> 2ry GO:0009626 plant-type hypersensitive response 44 4 1.11 3.60 1ry> 2ry
GO:0009636 response to toxic substance 49 4 1.23 3.25 1ry> 2ry
GO:0031408 oxylipin biosynthetic process 51 4 1.28 3.13 1ry> 2ry
GO:0055114 oxidation-reduction process 684 36 17.22 2.09 1ry> 2ry Tertiary versus secondary lines
GO:0006433 prolyl-tRNA aminoacylation 2 2 0.06 33.33 3ry> 2ry
GO:0009871 jasmonic acid and ethylene-dependent systemic resistance. Ethylene mediated signaling pathway
5 3 0.16 18.75 3ry> 2ry
GO:0009969 xyloglucan biosynthetic process 8 3 0.26 11.54 3ry> 2ry
GO:0031640 killing of cells of other organism 11 4 0.35 11.43 3ry> 2ry
GO:0010731 protein glutathionylation 7 2 0.22 9.09 3ry> 2ry
corresponding, targeted mRNA. This gene silencing process, participates to the biological process of mRNA splicing and is apparently modulated only during the third cycle of repetitive somatic embryogenesis.
Discussion
Repetitive somatic embryogenesis enhanced the embryo-genic potential of embryoembryo-genic lines derived from two Douglas-fir genotypes.
Table 3 Gene Ontology (GO) terms enriched in significant proteins after repetitive somatic embryogenesis in Douglas-fir (Continued)
GO.ID Term Annot. Sign. Exp. ratio sign./exp. Expression
GO:0006558 L-phenylalanine metabolic process 15 4 0.48 8.33 3ry> 2ry
GO:0046487 glyoxylate metabolic process 8 2 0.26 7.69 3ry> 2ry
GO:0080092 regulation of pollen tube growth 17 4 0.54 7.41 3ry> 2ry GO:0043650 dicarboxylic acid biosynthetic process 13 3 0.41 7.32 3ry> 2ry
GO:0006032 chitin catabolic process 22 5 0.7 7.14 3ry> 2ry
GO:0046189 phenol-containing compound biosynthetic process 9 2 0.29 6.90 3ry> 2ry
GO:0006949 syncytium formation 9 2 0.29 6.90 3ry> 2ry
GO:0080167 response to karrikin 44 8 1.4 5.71 3ry> 2ry
GO:0006816 calcium ion transport 11 2 0.35 5.71 3ry> 2ry
GO:0009828 plant-type cell wall loosening 11 2 0.35 5.71 3ry> 2ry GO:0009626 plant-type hypersensitive response 44 7 1.4 5.00 3ry> 2ry GO:0000272 polysaccharide catabolic process 64 10 2.04 4.90 3ry> 2ry GO:0072329 monocarboxylic acid catabolic process 42 6 1.34 4.48 3ry> 2ry
GO:0006749 glutathione metabolic process 56 8 1.79 4.47 3ry> 2ry
GO:0031408 oxylipin biosynthetic process 51 7 1.63 4.29 3ry> 2ry
GO:0009718 anthocyanin-containing compound biosynthetic process 23 3 0.73 4.11 3ry> 2ry
GO:0019395 fatty acid oxidation 39 5 1.24 4.03 3ry> 2ry
GO:0009611 response to wounding 129 15 4.11 3.65 3ry> 2ry
GO:0050832 defense response to fungus 102 11 3.25 3.38 3ry> 2ry
GO:0009699 phenylpropanoid biosynthetic process 93 10 2.96 3.38 3ry> 2ry
GO:0009808 lignin metabolic process 85 9 2.71 3.32 3ry> 2ry
GO:0006952 defense response 370 31 11.79 2.63 3ry> 2ry
GO:0044248 cellular catabolic process 472 39 15.05 2.59 3ry> 2ry
GO:0006979 response to oxidative stress 232 16 7.4 2.16 3ry> 2ry
GO:0009617 response to bacterium 201 13 6.41 2.03 3ry> 2ry
GO:0055114 oxidation-reduction process 684 44 21.8 2.02 3ry> 2ry
GO:0051603 proteolysis involved in cellular protein catabolic process 142 9 4.53 1.99 3ry> 2ry GO:0005975 carbohydrate metabolic process 414 24 13.2 1.82 3ry> 2ry
GO:0010038 response to metal ion 393 19 12.53 1.52 3ry> 2ry
GO:0006879 cellular iron ion homeostasis 3 2 0.03 66.67 2ry> 3ry
GO:0010197 polar nucleus fusion 8 2 0.09 22.22 2ry> 3ry
GO:0046274 lignin catabolic process 16 2 0.18 11.11 2ry> 3ry
GO:0048509 regulation of meristem development 20 2 0.23 8.70 2ry> 3ry GO:0010051 xylem and phloem pattern formation 24 2 0.27 7.41 2ry> 3ry GO:0000398 mRNA splicing. Via spliceosome 56 4 0.63 6.35 2ry> 3ry
GO:0016310 phosphorylation 222 6 2.51 2.39 2ry> 3ry
GO:0032774 RNA biosynthetic process 262 7 2.97 2.36 2ry> 3ry
GO.ID: Gene Ontology Identifiant; Annot.: number of annotated Douglas proteins with GO terms in the data set; Sign.: number of Douglas proteins in the analysed dataset; Exp.: expected number of interesting proteins mapped to the GO term if randomly distributed over all GO terms; ratio sign./exp: ratio between significant and expected proteins mapping to the GO term; Expression: proteins assigned to specific GO term are over-expressed in 1ry
(1ry > 2ry ), 2ry (2ry > 1ry ) or 3ry lines (3ry> 2ry). Only results with pvalue < 0.05 of the Fisher’s exact test were considered
a
b
Fig. 8 Sub Network Enrichment Analysis (SNEA) connecting significant proteins and regulators or targets from proteomic studies. a / Comparison of 2ryvs 1rylines; b / Comparison of 3ryvs 2rylines somatic embryogenesis in Douglas-fir. The Douglas-fir significant proteins (ratio 1.5, p < 0.05) are named by their Arabidopsis homologues. The correspondences between Douglas-fir and Arabidopsis protein names are given in Additional file1. Red color: sur-expression of this protein in 2rylines in a and 3rylines in b; blue color: sur-expression of this protein in 1rylines in a, 2ryline in b; grey color: protein significant in the proteomic comparison
The experiments with two unrelated genotypes (TD17, SD4) with differing embryogenic potential (under the test conditions) provided abundant informa-tion about this common “genotype effect”, which has been observed in various conifers [3]. These include Pinaceae species such as pines [8] and Douglas-fir [6,
53], and may result from genotype-specific interaction with culture conditions.
Compared to 1ry lines, 2ry lines of both SD4 and TD17 genotypes displayed significantly higher mean embryogenic potential (2155 vs 477 and 240 vs 29 SEs g− 1 f.w.; 4.5 and 8.2-fold increases, respectively). Increases in embryogenic potential after a second cycle of somatic embryogenesis (secondary somatic embryogenesis) have been previously recorded in experi-ments with hybrid larch (1 genotype, 3-fold increase [27]), maritime pine (2 genotypes, 1.4 to 2.3-fold increase [31]) and Douglas-fir (3 genotypes, 1.2 to 4.9-fold increase [6]). This is particularly interesting for“recalcitrant” genotypes with weak embryogenic potential (e.g. TD17), as poor capacity to regenerate selected genotypes via SEs in breeding programs is a major impediment to multivarietal coniferous forestry [7,8].
In this study, one genotype (SD4) was subjected to a third cycle of somatic embryogenesis (tertiary somatic embryogenesis) to further investigate cumulative effects of repetitive somatic embryogenesis on its embryogenic potential. To our knowledge, this is the first report of the initiation of 3ryconiferous embryogenic lines. Inter-estingly, two of the three tested 3ry lines (SD4–8-2 and SD4–8-3) exhibited significantly higher embryogenic po-tential (mean, 4209 SEs g− 1 f.w.), and the third 3ry line (SD4–8-1) non-significantly higher embryogenic poten-tial (3344 SEs g− 1 f.w.) than the original 2ry line SD4–8 (mean, 2400 SEs g− 1 f.w.). We conclude that repetitive somatic embryogenesis enhanced the SD4 genotype’s embryogenic potential. However, the increase in matur-ation performance observed after the third cycle of som-atic embryogenesis was weaker than that observed after the second cycle (1.6- vs 4.5-fold increase on average). Long-term stable embryogenic potential has been dem-onstrated in some Pinaceae species, such as Larix spp. [32], whereas ageing effects are highly significant in other species (e.g. Pinus spp., [8]). The stable embryo-genic potential of proliferating Douglas-fir lines of vari-ous physiological ages since initiation (from older 1ry
lines to younger 2ryand 3rylines) observed in this study supports the hypothesis that increases in embryogenic potential following repetitive somatic embryogenesis are mainly due to initiation effects rather than ageing. In co-nifers, cellular and molecular changes in proliferating lines after one or two successive cycles of somatic em-bryogenesis have been poorly investigated. To our know-ledge, there is only one previous report on physiological
and molecular aspects of 1ryand 2rylines with contrast-ing embryogenic potential, in Pinus pinaster [31]. In this work, we gained new insights, discussed in the following sections, into EMs’ cellular organization (cytology, hist-ology) and molecular physiology after both one and two cycles of repetitive somatic embryogenesis in Douglas-fir (via comparisons of 1ry vs 2ry lines and 2ry vs 3ry lines, respectively).
Repetitive somatic embryogenesis of Douglas-fir
improved immature SEs’ cellular organization
The repetitive somatic embryogenesis markedly im-proved SEs’ structures, particularly in genotype SD4. Both 1ry and 2ry lines of genotype TD17 produced all types of EMs that we have recently described [6], i.e. polyembryogenic centers, large singulated SEs and small SEs. In contrast, the arrangement of EMs in 1ryand 2ry lines of genotype SD4 markedly differed. The large poly-embryogenic centers that predominated in 1ry line SD4 slightly resembled meristemoids that develop during or-ganogenesis or somatic embryogenesis of angiosperms [54,55], or nodules that form on needle primordia after initiation of somatic embryogenesis from shoot buds of white spruce [23]. Nevertheless, cell arrangements of these structures were closer to arrangements of typical Douglas-fir polyembryogenic centers, with a broad meristem-like part joined to a suspensor part forming a compact cell“package” [6]. However, cells located in this “package” were arranged quite loosely and were not elongated as in polyembryogenic centers of the 2ry and 3rylines. Moreover, the meristem-like part consisted of a very thin layer of densely cytoplasmic cells, while other cells were vacuolated and accumulated secondary me-tabolites. Parts that could be regarded as cleavable em-bryonal heads were rare. These structures were observed in neither 2ry nor 3ry lines, although some structures similar to those observed in SD4 material occurred in addition to well-organized bipolar SEs in lines SD4–2 and SD4–6. In conclusion, repetition of somatic embryo-genesis clearly improved EMs’ organization. The in-creased yields of cotyledonary SEs after maturation may have been due to increases in frequencies of small SEs together with reductions in sizes of polyembryogenic centers (as we observed in 3ry line SD4–8-2). Alterna-tively, it could be related to the organization of polyem-bryogenic centers into clusters of distinct embryonal heads of very similar size, as observed in SD4–8-1 and even more strongly in SD4–8-3.
Repetitive somatic embryogenesis decreased abundance of non-embryogenic cell clusters in Douglas-fir EMs
When EMs are cultivated in clumps, highly mitotically active and growing polyembryogenic centers or singu-lated early SEs occur on the surface of the clumps, while
inner parts usually consist of dying suspensor cells or whole SEs. Such organization resulted in most of the in-vestigated lines of Douglas-fir EMs, especially 3ry lines, having a granular appearance (Additional file 1: Table S1). Similar morphotypes of proliferating embryogenic lines of other Pinaceae species, such as Pinus pinaster, have been observed, and associated with some morpho-logical traits of embryonal heads and suspensors [56] (and references therein). In Pinus pinaster it has been shown that the outer parts of EM clumps have higher embryogenic potential than inner parts. Our past experi-ence with various conifer species indicates that the whit-ish parts of EMs generally have the highest embryogenic potential, and thus were collected for detailed histo-logical study. In spite of our careful selection of samples, the histological study surprisingly revealed the presence of NECs cells close to the EMs, especially in the 1ryline of genotype TD17 and 2rylines of SD4 (Additional Table S1). Such NEC clusters, consisting of cells accumulating not only starch grains but also phenolic compounds, have been considered one of the main impediments of in vitro propagation of woody plants [57]. Browning of tissue cultures (as observed in our Douglas-fir lines, Additional file 1: Table S1 and Additional file 2: Figure S1) typically results from oxidation of accumulated phenolic compounds. Browning is reportedly a conse-quence of high oxidative stress and can eventually cause cell death [58], thereby reducing cultures’ regeneration
capacity. We observed cells with phenolic contents ei-ther as parts of NEC clusters or as individual loosely ar-ranged groups. In the 1ry SD4 line, cells with phenolic contents were also present in the large meristem-like parts of polyembryogenic centers. Processes resulting in oxidation of phenols in the tissues could have detrimen-tal effects on the embryogenic potential of 1ry lines, es-pecially TD17. Thus, the reduction in numbers of NECs containing phenolic compounds was another desirable effect of the repetitive somatic embryogenesis. We found far fewer NECs in the 2rylines TD17–1 and SD4–2, and close to zero in 3rylines induced from SD4–8.
Proteomic analyses revealed important interactions
between proteins and plant growth signaling in“plant
development” process during the somatic embryogenesis
cycles
We compared protein profiles of both 2ry vs 1ry lines and 3ryvs 2rylines to identify possible proteomic effects of an additional round of somatic embryogenesis. More proteins were detected during both proteomic analyses (2293–2554, 4813 overall) than in previous analyses based on two-dimensional gel electrophoresis [40, 44] confirming that shotgun-iTRAQ technology has greater potential for both identifying and quantifying proteins. This should be generally valid for all plant species, but
the availability of the Douglas-fir transcriptome enabled about 30% more successful protein identifications than use of the Picea glauca database. PCA revealed that the type of line (1ry, 2ry, 3ry) accounted for most of the total observed variance in expression patterns of this large set of identified proteins, in both genotypes.
No significant differences in total protein content among the compared embryogenic lines were detected. However, the expression of substantial numbers of pro-teins was affected by the somatic embryogenesis cycles (162 and 228 were significantly up- or down-regulated following the second and third cycles, respectively). Functional analysis showed that most of these significant proteins are mainly involved in metabolic and cellular processes. It is well known that embryogenic compe-tence is accompanied in plants, including conifers (reviewed in [9]) by active metabolic changes and devel-opmental processes [59] as well as cellular reorganiza-tions [36, 60]. Interestingly, we observed a general “down-regulation” of most of a specific set of significant proteins after the second cycle, and a general “up-regula-tion” of most of another set (including only 33 common proteins of both set) after the third cycle. Thus, specific expression patterns of significant proteins are apparently established after each somatic embryogenesis cycle in Douglas-fir, at least under our test conditions. It is sug-gested that induction of somatic embryogenesis pro-motes large, genome-wide changes in gene expression patterns, possibly through activation of chromatin modi-fiers or other epigenetic regulators. Such global changes in gene expression have been reported in various co-nifers, such as Picea abies at the beginning of embryo-genesis [61, 62], and Pinus pinaster in transitions between stages of embryo development induced by regu-latory signal. The latter study highlighted several epigen-etic regulation mechanisms involved in stage-to-stage transitions.
Biological processes associated with significant pro-teins were identified by both GO analyses (Table3, Add-itional Table S4 and Fig. 7) and screening against bibliographic data. The resulting networks, showing con-nections between significant proteins according to their involvement in biological processes and/or interactions with regulatory factors or induction signals, are pre-sented in Fig. 8. Interpretation of proteomic results based on protein networks is a powerful approach, but has several limitations. First, it only highlights connected proteins in the networks. Second, the bib-liographic database used is specific to Arabidopsis thaliana, so resulting networks inevitably miss important elements of woody, perennial species’ networks. Third, embryo patterning is still a poorly understood and com-plex process involving a regulated network of at least 300–450 genes [9].
The discussion of significant proteins according to assigned biological processes and functional categories could be complicated by the possible involvement of proteins in several pathways. Therefore, in four sections we discuss the proteomic changes associated with the somatic embryogenesis cycles affecting “plant develop-ment”, “proteolysis”, “signaling by growth regulators and polyphenols” and “stress and redox responses”.
Proteomic differences between secondary and primary embryogenic lines
Plant development Proteomic studies of embryogenesis classically reported an increase of the primary metabol-ism either during maturation, or between lines with vari-able embryogenic potential [63]. Thus our results, showing that more than 50% of the significant proteins are involved in primary metabolism are consistent with previous studies. Our GO analyses and histological re-sults also confirmed the importance of programmed cell death (PCD) during various steps of somatic embryogen-esis, including differentiation of proliferating early em-bryos in EMs into cotyledonary SEs [64, 65]. Also, during the enrichment analyzes of the GOs, this process emerged, in agreement with our histological results. Few proteins are directly related to PCD, or indirectly related via interaction with flavonoids, jasmonic acid, oxidative stress and proteolysis (Table3and Additional file 4: Fig-ure S3B,C,E,F). Thus, strong interactions between these protagonists are cited in the literature, as discussed in the following sections. ERD9, a glutathione S-transferase (GST) that is down-regulated in 2rylines, is directly as-sociated with the biological process“Plant development”, and plays well-known roles in oxidative stress regulation in plants [66], as well as in somatic embryogenesis [67]. Among the up-regulated proteins in 2ry lines, the puta-tive methyltransferase DDB could be a key mediator of increases in embryogenic potential through its involve-ment in epigenetic mechanisms that are known to pro-mote embryonic development [63]. More specifically, a high level of methylation during embryogenesis has been associated with chromatin remodeling, allowing the ex-pression of genes involved in embryogenesis [62]. Ac-cordingly, an E3 ubiquitin protein ligase (ARI1) was up-regulated in 2ry lines. Ubiquitin protein ligases have known association with activation of chromatin modi-fiers called ubiquitin−/small ubiquitin-related modifier (SUMO)-conjugating genes, resulting in global modifica-tions of gene expression (see [44] and references therein). EP3 chitinase was also up-regulated in the lines produced by both second and third somatic embryogen-esis. This is consistent with indications that chitinases play important non-defensive roles in SEs development, and both carbon and nitrogen metabolism in embryo-genic lines [12, 42, 68], as well as the development of
somatic and zygotic embryos [69]. Chitinases are also as-sociated with PCD in plants [69].
Proteolysis The observed increases in embryogenic po-tential were apparently accompanied by significant deg-radation and recycling of proteins, while the total protein content remained roughly constant (Additional Tables S2 and S3). These conclusions are supported by the GO term enrichments (Fig. 7) and presence of ca-thepsin B-like proteins, probable E3 ubiquitin-protein ligase ARI1 and serine carboxypeptidase in the sets of significantly up-regulated proteins in both the second and third somatic embryogenesis cycles (Additional file
7). The findings also emphasize the importance of prote-olysis in increasing embryogenic potential [62]. Cathep-sin B-like protein, a cysteine protease, plays a key in degradation of target proteins and participates in em-bryogenesis, plant defense and PCD [70]. Its presence in embryogenic calli has been associated with involvement in maintenance of pluripotency and cell reprogramming these tissues [71]. The probable E3 ubiquitin-protein lig-ase ARI1 is also involved in protein recycling, as part of the ubiquitin/26S proteasome complex. Substantial sup-port has been obtained for regarding ubiquitin protein ligase as robust marker of correct embryo development in Pinus pinaster [12]. The last protein identified in this protein renewal pathway is an ABA-inducible serine car-boxypeptidase, involved in secondary metabolism and stress responses [72]. These two biological processes were modified during induction according to the protein networks and are discussed in a following section. A re-cent study revealed that serine carboxypeptidase has positive effects in embryogenesis, and more specifically polyembryogenesis induction [73]. Finally, expression of this protein is regulated by pathogen response pathways and jasmonic acid [74], a plant growth regulator that connects several proteins in the significant protein net-work (Fig.8).
Signaling by plant growth regulators and polyphenols Plant signaling networks are crucial for the control of every embryogenesis stage, from EMs’ proliferation through maturation to germination. Accordingly, the proteomic comparisons demonstrated the involvement of several signaling compounds in 2ry
somatic embryogen-esis, by highlighting their interactions with various signifi-cant hormone-responsive proteins. Jasmonic acid was the one with most connections. All of the associated proteins except one (L-galactono-1,4-lactone dehydrogenase) were more strongly expressed in 1rylines than in 2rylines. Sev-eral studies have detected positive effects of jasmonic acid on maturation of SEs [75]. This regulator, like ABA and salicylic acid, is mainly linked to biotic and abiotic stresses [76] in the pre-embryonic stage of development, as