Thèse de Doctorat
Domaine : Sciences physiques pour l’ingénieur
Spécialité : Électromagnétisme
École Doctorale π Sciences et Technologies de l’Information des Télécommunications et des Systèmes ∫
Présentée par :
Azza MOKADEM
Sujet :Analyse de la diffusion par les
scènes urbaines dans le cadre de
la détection des cibles en visée
non directe du radar dans les
images SAR
Soutenue le 4 Février 2014 devant les membres du jury :
Yves Lostanlen, Toronto University Rapporteur
Bernard Uguen, INSA Rennes Rapporteur
Jean-Marie Nicolas, Télécom ParisTech Examinateur
Carlos Lopez-Martinez, PUC Examinateur
Lionel Pichon, LGEP Examinateur
Régis Guinvarc’h, SONDRA/SUPELEC Examinateur
Elise Colin-Koeniguer, ONERA Encadrante
Laetitia Thirion-Lefevre, SONDRA/SUPELEC Directrice de Thèse
Acknowledgments
It would not have been possible to write this thesis without the help and support of the kind people around me, to only some of whom it is possible to give particular mention here.
Above all, I would like to thank my parents and brother for the unequivocal support they gave me all my life, for which my mere expression of thanks likewise does not suffice.
This thesis would not have been possible without the help, support and patience of my two supervisors, Dr. Laetitia Thirion-Lefevre and Dr. Elise Colin-Koeniguer. They have been invaluable on both an academic and a personal level, for which I am extremely grateful. They gave me the opportunity to discover the world of research in the best conditions and supported me to achieve this work until the last second. Their guidance helped me in all the time of research, writing of the thesis and preparing the defence. I could not have imagined having better advisors for my Ph.D study. I will always remember their generosity,m sympathy and kindness. I would like to thank also the people of SONDRA for the beautiful environment I have been during these last three years. A special thank for my office colleagues Israel for his friendship and support and Jerome for the moments of fun.
Last but not the least, I would like to thank the friends I met in SUPELEC, Laila, Mircea, Aymen, Zina, Pierre and Takis.. I will always remember the beautiful moments we spend together..
Contents
Foreword 1
I General introduction 5
1 Problematic and methodology 7
1.1 Introduction to the problematic . . . 7
1.2 Problematic statement . . . 9
1.3 Review of the state-of-art . . . 12
1.3.1 Detection of the NLOS targets . . . 12
1.3.2 SAR simulators of urban areas . . . 14
1.4 Specifications of the objective . . . 22
1.4.1 Requirements . . . 22 1.4.2 Approach . . . 23 1.4.3 Methodology . . . 23 2 Reference data 27 2.1 Introduction. . . 27 2.2 Existing elements . . . 28
2.2.1 Theoretical Radar Cross Section (RCS) . . . 28
2.2.2 Indoor measurements . . . 31
2.2.3 Outdoor measurements . . . 37
2.3 New measurements . . . 41
2.3.1 General description. . . 41
2.3.2 Measurements analysis . . . 43
2.3.3 Advantages and difficulties . . . 43
2.4 Conclusion . . . 45
Summary 47 II EM codes benchmarking and analysis 49 3 EM codes presentation 51 3.1 Introduction. . . 51
3.2 Wireless Insite . . . 52
3.2.1 General description. . . 52
3.2.2 Radar acquisition chain . . . 52
3.2.3 Tests with WI . . . 52
3.3 MOCEM . . . 62
3.3.1 General description. . . 62
3.3.2 Radar acquisition chain . . . 63
3.3.3 Tests with MOCEM . . . 63
iv Contents
3.4.1 General description. . . 66
3.4.2 Radar acquisition chain . . . 69
3.4.3 Tests with FEKO. . . 71
3.5 CST . . . 73
3.5.1 General description. . . 73
3.5.2 Radar acquisition chain . . . 73
3.5.3 Tests with CST . . . 73
3.6 Conclusion . . . 73
4 Detailed presentation of the new measurements 75 4.1 Introduction. . . 75
4.2 Measurement setup presentation . . . 76
4.2.1 Anechoic chamber BABI of ONERA . . . 76
4.2.2 Geometric description of the scene under study . . . 77
4.2.3 Radar parameters . . . 80
4.2.4 Far field condition . . . 80
4.2.5 Anechoic chamber data outputs. . . 80
4.2.6 Ratio d/⁄ in the anechoic chamber . . . 82
4.3 Analysis of the anechoic chamber data . . . 83
4.3.1 Radar range profile description . . . 83
4.3.2 Geometric mechanisms identification . . . 83
4.4 Origin of the additional effects . . . 86
4.4.1 Response of a metallic plate at a low frequency . . . 86
4.4.2 Response of a metallic plate at a higher frequency . . . 87
4.4.3 Geometric mechanisms identification . . . 87
4.5 Conclusion . . . 91
5 Simulations and comparisons using FEKO and CST 93 5.1 Introduction. . . 93
5.2 Validation of FEKO . . . 94
5.2.1 Scene and radar parameters in FEKO . . . 94
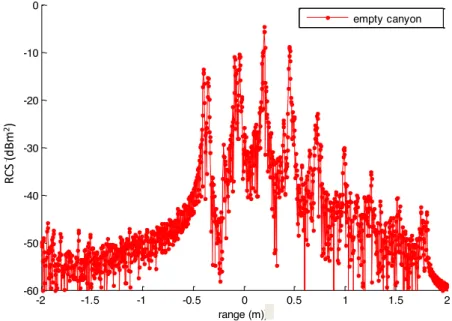
5.2.2 Case of an empty canyon . . . 95
5.2.3 Case of a canyon with an included target . . . 98
5.3 Validation of CST . . . 100
5.3.1 Case of an empty canyon . . . 100
5.3.2 Case of a canyon with an included target . . . 101
5.4 Effects of the geometry of the canyon on the range profile . . . 103
5.4.1 Simulations on a "well oriented" canyon . . . 103
5.4.2 Simulations on a "tilted" canyon . . . 105
5.4.3 Simulations on a "distorted" canyon . . . 106
5.5 Effects of a very high frequency . . . 108
5.6 Conclusion . . . 108
Contents v
III In-house EM code: presentation, results and application 113
Introduction 115
6 Urban Canyon V1, V2 117
6.1 Introduction. . . 117
6.2 Presentation of the developed in-house code . . . 119
6.2.1 Inputs . . . 119
6.2.2 Outputs . . . 119
6.3 Urban Canyon V1 . . . 121
6.3.1 NLOS detectability areas by specular reflection mechanism 122 6.3.2 Canyon Range Signature. . . 125
6.3.3 Percentage of detectability areas . . . 125
6.4 Urban Canyon V2 . . . 127
6.4.1 NLOS detectability areas with backscattering mechanisms . 128 6.4.2 Canyon Range Signature . . . 130
6.4.3 Percentage of detectability areas . . . 134
6.5 Conclusion . . . 135 7 Urban Canyon V3 139 7.1 Introduction. . . 139 7.2 Reference scene . . . 140 7.3 Walls detection . . . 140 7.3.1 Example. . . 141
7.3.2 General case: N=M+1 (M odd). . . 141
7.3.3 General case: N=M+1 (M even) . . . 143
7.3.4 General case: N=M+2 (M even) . . . 144
7.3.5 General case: N=M+2 (M odd). . . 144
7.4 Study of the response of the parallelepiped target . . . 148
7.4.1 Which sub-canyon is illuminated ? . . . 148
7.4.2 Analysis of the right sub-canyon . . . 149
7.4.3 Analysis of the left sub-canyon . . . 158
7.4.4 Analysis of the parallelepiped target detection by its roof . . 165
7.4.5 Percentage of detectability areas . . . 167
7.5 Validation of Urban Canyon V3 using FEKO . . . 169
7.6 Conclusion . . . 171
8 On the use of the in-house EM code to analyze InSAR data 175 8.1 Introduction. . . 175
8.2 Overview of spaceborne and airborne SAR systems . . . 177
8.3 Overview of typical SAR effects . . . 178
8.3.1 Corner reflector effect . . . 178
8.3.2 Shadowing effect . . . 179
8.3.3 Layover effect . . . 179
8.4 Objective of the study . . . 180
8.4.1 Radiometric analysis . . . 181
vi Contents
8.5 Presentation of the data at our disposal . . . 181
8.6 Analysis of the radiometric image . . . 182
8.6.1 Identification of the features of the image . . . 182
8.6.2 Features mechanisms identification . . . 185
8.6.3 Features analytic backscattering signature . . . 190
8.6.4 Backscattering expression validation . . . 191
8.7 Analysis of the interferometric image . . . 195
8.7.1 Choice of the interferometric zones to study . . . 195
8.7.2 Analysis of the interferometric coherence of each zone . . . . 195
8.7.3 Interpretation of the interferometric phase transition . . . 200
8.8 Conclusion . . . 204
Summary 207 Conclusions and perspectives 209 A Range profile reconstruction 213 A.1 Scene definition . . . 213
A.2 Signal modelling . . . 213
A.3 Reconstruction of the image 1D: the radar range profile . . . 213
B Résumé 217
Foreword
Earth observation from space through various remote sensing instruments has pro-vided a big knowledge concerning the monitoring of land surface dynamics, natural resources management, and the overall state of the environment itself [Joseph 2005]. There are many possible definitions about what remote sensing actually is. One of the most common definitions is "the collection and interpretation of information about an object, area, or event without being in physical contact with the object". According to Canada Center for Remote Sensing, it is: "a group of techniques for collecting image or other forms of data about an object from measurements made at a distance from the object and the processing and analysis of the data".
Based on these two definitions, we can propose another definition of remote sensing as "the technology to identify, measure and analyze the characteristics of an object of interest without a direct contact." Electromagnetic radiation which is reflected or emitted from an object is the usual source of remote sensing data. The device to detect the electromagnetic radiation reflected from an object is called a "remote sensor" or "sensor". Cameras or scanners are examples of remote sensors. A vehicle to carry the sensor is called a "platform". Aircraft and satellites are the common platforms for remote sensing of the earth. The development and deploy-ment of satellites has enhanced the collection of remotely sensed data and offers a way to obtain information over large areas. The capacity of remote sensing to iden-tify and monitor land surfaces and environmental conditions has expanded greatly over the last few years. Moreover, the gathered data is an essential tool in natural and urban resources management. Remote sensing imagery has many applications in mapping land-use and cover, agriculture, soils mapping, forestry, city planning, archaeological investigations, military observation, and geomorphological survey-ing, among other uses. For example, foresters use aerial photographs for preparing forest cover maps, locating possible access roads, and measuring quantities of trees harvested [Trewartha 1961]. Specialized photography using color infrared film has also been used to detect disease and insect damage in forest trees.
The remote sensing systems can be classified into two groups depending on the operating wavelength:
• The optical and infrared remote sensing, • The microwave remote sensing.
The optical remote sensing satellites carry passive sensors meaning that they require the illumination of the sun for imaging. The corresponding operating wavelengths extend usually from the visible and near infrared (0.7 µm to 1.5 µm) to the short-wave infrared (1.5 µm to 3 µm). Different materials such as water, soil, vegetation, buildings and roads reflect visible and infrared light in different ways. They have dif-ferent colours and brightness when seen under the sun. The interpretation of optical images require the knowledge of the spectral reflectance signatures of the various materials (natural or man-made) covering the surface of the earth. The first opti-cal satellite devoted to remote sensing, named LANDSAT-1, was launched by the NASA in 1972 [Longshaw 1976]. It allows to collect information about agricultural resources, geography, cartography, environmental pollution, oceanography and
me-2 Foreword
teorological phenomena. SPOT-1, the first french satellite dedicated to earth obser-vation was launched in 1986. It is an optical imaging system initiated by the CNES (the french space agency) to improve the knowledge and management of the earth by exploring the earth’s resources, detecting and forecasting phenomena involving climatology and oceanography, and monitoring human activities [Berry 1988].
The microwave remote sensing satellites carry active sensors that emit pulses of microwave radiation to illuminate the areas to be imaged (the wavelength varying from 1 mm to 1 m). Images of the earth surface are formed by measuring the microwave energy scattered by the ground or sea back to the sensors. As they are active systems, these satellites carry their own "flashlight" emitting microwaves to il-luminate their targets. The images can thus be acquired day and night. Microwaves have an additional advantage as they can penetrate clouds. Therefore, images can be acquired even when the weather is cloudy. Indeed, radar microwaves are less affected by atmospheric constituents (rain, clouds, snow..) than optical waves. As long as the size of the particles is small than the wavelength, they can be consid-ered as invisible. Nevertheless, if the relative size grows up, interactions between the particles and the waves increase and the signal is significantly disturbed.
An example of a microwave imaging system which can produce high resolution image of the earth is the Synthetic Aperture Radar (SAR). The interest of SAR sys-tems comparing to conventional radar syssys-tems is explained in [Cumming 2004]. The intensity in a SAR image depends on the amount of microwave backscattered by the target and received by the SAR antenna. Since the physical mechanisms responsible for this backscatter is different for microwave, compared to visible/infrared radia-tion, the interpretation of SAR images requires the knowledge of how microwaves interact with the targets.
The first spaceborne SAR system, named SEASAT, was designed for remote sensing of the oceans [Monaldo 2003]. SEASAT, launched on the 27thof June 1978, was initiated by NASA’s Jet Propulsion Laboratory. It was designed to achieve a twofold mission. The first objective was to demonstrate the feasibility of global satellite monitoring of oceanographic phenomena and the second objective was to help determining the requirements for an operational ocean remote sensing satellite system. The first European Remote Sensing satellite ERS-1, launched in 1991 by the European Space Agency (ESA), carried a payload including an imaging SAR, a radar altimeter and other instruments to measure ocean surface temperature and winds at sea [Johannessen 1995].
The operating mode of SAR system is based on the interactions between the scene elements and the emitted waves. Depending on the characteristics of the illuminated object, the scattering signal differs. This difference between the emitted signal and the received one is used, as for every radar system, to get information of the illuminated objects in the scene. Unless the scene is composed by simple elements with simple geometry (sphere, dihedral, ..), the returned radar signal is not so easy to interpret. An example of a complex environment to study using SAR images is the urban areas.
In this thesis, the main topic is the detection of NLOS (Non Line Of Sight) targets inside a simple and representative scene (the urban canyon), using SAR images for military and civilian purposes. Applications in the area of detecting hidden targets using radar systems are numerous: the global reconnaissance is done
Foreword 3
mainly by satellite systems, aircrafts and high flying platforms carrying sensors for wide area observation. In addition, there are miniaturized SAR equipments which are integrated into drones for battlefield surveillance. The resolution of SAR systems has been improved over the last decades up to the order of a centimeter [Brenner 2013]. Advanced classification algorithms are now able to identify some military objects in the scene which is of great interest [Berens 2006].
In this context, our primary goal is not to develop images processing techniques to investigate the detection of NLOS targets but rather to gain knowledge about the electromagnetic (EM) phenomenology of propagation inside urban canyons. Once the relation between the radar parameters (frequency, polarization, incidence angle,..), the scene composition (geometry and materials) and the returned signal established, the accurate prediction of the possible detection or not of a NLOS target would be possible.
This present thesis is composed by three main parts. The first part is dedicated to a general introduction to the problematic based on a study of the state-of-art works to point out our contribution comparing to the current achievements. Our methodology to deal with this new topic is also presented (chapter 1). In addition, a description of the reference data that we have at our disposal to analyze the EM phenomenology of scattering inside urban canyons for both indoor and outdoor environments, is given in chapter 2. The second part of this thesis deals with the EM knowledge concerning the propagation inside the canyon acquired through the analysis of indoor data. In the third chapter, we give a presentation of the different EM commercial tools tested to select a reliable tool to investigate about the EM propagation inside real urban canyons. In chapter 4, we give a detailed presentation of the anechoic chamber data we performed the simulations of the EM codes on. In the last chapter of this part, the results of the simulations of the selected EM tools are presented with the main analysis we derived concerning the EM phenomenology of propagation for both controlled and real case urban canyons. The third part of the thesis is a presentation of our developed and validated in-house code to investigate the detection of NLOS point and extended targets inside urban canyons (chapter 6 and 7). Finally an example of application of this in-house code to interpret InSAR data is proposed in the last chapter .
Part I
Chapter 1
Problematic and methodology
Contents1.1 Introduction to the problematic. . . . 7
1.2 Problematic statement . . . . 9
1.3 Review of the state-of-art . . . 12
1.3.1 Detection of the NLOS targets . . . 12
1.3.2 SAR simulators of urban areas . . . 14
1.4 Specifications of the objective . . . 22
1.4.1 Requirements . . . 22
1.4.2 Approach . . . 23
1.4.3 Methodology . . . 23
1.1 Introduction to the problematic
Application of remote sensing to urban areas requires a challenging effort to be car-ried out in the future. The use of remote sensing data for urban areas monitoring is highly desired for regular maintenance ([Johnson 2008], [Codjoe 2007]) as well as emergency occurrences ([Montoya 2002], [Van Westen 2000]). From the regular maintenance point of view, important information for economic development plan-ning and best natural resources use can be provided by the analysis of land use, the estimation of population growth and its spatial distribution or movements. From the emergency situations management point of view, a fast and synoptic data ac-quisition of the areas affected by natural disasters would provide a rapid estimation of the damages and hence guarantee an adequate intervention.
This heavy demand on remote sensing applications related to urban areas leads to the development of imaging systems that are alternative to optical imagery. In particular, in the last few decades, there has been an increasing interest in SAR imagery, since some of its properties are favorable to optical imagery. In fact, the use of centimetric to millimetric wavelengths turns the SAR technique into an "all-weather" system able to work under adverse weather conditions and has a day night capability to obtain images. Moreover, the resolution is independent of the sensor’s height.
In the past decades, due to the poor spatial resolutions of the provided images by the existing sensors, the earth mapping by satellite imagery has been mainly limited to natural landscapes. Often, the phenomena to be observed did not need high image resolution as they could be monitored using a resolution of many ten meters. But, this is not sufficient for urban areas where the main structures of the
8 Chapter 1. Problematic and methodology
objects of the scene (buildings, streets, etc..) have dimensions that are often in the scale of tens meters while many other items are even smaller (windows, balconies, cars and so on). Consequently, high resolution is an important requirement for an adequate description of this kind of scene.
So far, new technologies have been developed to this aim for high resolution sensors working in optical and radar domain. The ability of new SAR sensors to provide fine resolution imagery of the urban areas leads to new urban remote sensing applications such as: reconnaissance, surveillance, and targeting. Consequently, the extraction and recognition of very small structures in crowded environment is now possible. In dense urban areas the detection of structures from building to car is expected. These applications are driven by civilian needs of security such as reconnaissance and surveillance tasks. Currently, surveillance in urban areas is dominated by optical devices. Sensitive areas inside a city are covered by a large network of cameras. Optical images are the best means of surveillance for an operator because they do not need interpretation. However, they work only in Line Of Sight (LOS) with the presence of a light source. In order to prevent blind areas, it is necessary to employ a dense network of cameras whose performance degrades in conditions such as smoke and low light. Moreover, cameras in public areas bring up issues of privacy. Many of these issues are mitigated through the use of radar, specially SAR systems.
In fact, the use of urban SAR data for military applications such as detecting the underground pipes, inspecting the tanks below the canopy, searching and res-cuing the crashed aircraft, etc.., has received increasing attention during last years [Mattar 2003]. Researchers are now improving the ability to detect and resolve tar-gets in urban clutter [Mitra 2001]. The intent is to deliver persistent and accurate information to military and law enforcement agents so they may make rapid and suitable decisions.
However, the complexity of the urban environment makes the detection of tar-gets a very challenging problem. Indeed, with the increase of the SAR sensor resolution, High Resolution (HR) SAR images could include a wide diversity of man-made structures (buildings, antennas, roads, lights, ground vehicles, etc), that have various shapes and sizes, different materials (metallic, asphalt, etc) and varying orientations from the sensor. This leads to a complex EM scattering environment characterized by a variety of single and multiple scattering mechanisms with a wide range of amplitudes.
Specifically, challenges such as multipath returns, building obscuration, and high clutter have to be overcome in order to maintain acceptable performance accuracy levels for target detection, estimation and tracking.
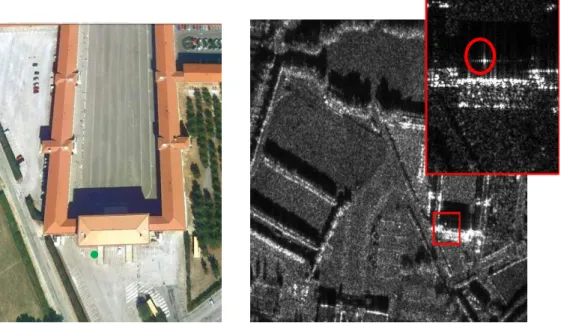
Typical SAR systems are designed for imaging targets with a direct line of sight of the SAR sensors. However, in an environment where the intended target (for example, man-made objects such as a tank or a truck) is hidden or surrounded by many scatterers (for example, buildings), the detection of the target in the cor-responding SAR image can be wrong due to the absence of a LOS response. An example of this typical problem of target detection in urban SAR images is illus-trated in Fig.B.1. This figure describes a SAR artifact preventing the accurate detection of the target: a target located in reality in front of the building, is syn-thesized at the shadow area located behind the building on the corresponding SAR
1.2. Problematic statement 9
image. This is due to the existence of NLOS response that leads to a corresponding range distance different from the real one and hence the target is synthesized at a wrong position on the image.
Figure 1.1: (Left) Real building of interest with a target located in front of it (the green point indicates the position of the target). (Right) Corresponding SAR image acquired and processed by ONERA through a measurement campaign involving the BUSARD motor glider platform equipped with the Drive radar. The frequencies band is [33-37] GHz and the incidence angle is 60¶. This image contains an artifact:
a target located in front of the building is synthesized at the shadow area located behind the building (see the red rectangle).
1.2 Problematic statement
The example in Fig.B.1has been selected to introduce the problematic of this thesis. The main objective is to investigate the detection of a target which can be in NLOS of the radar, in order to provide an explanation of the origin of some artifacts in the SAR image. This investigation will include the prediction for a specific urban scene of the cases where a target can be detected and the corresponding response in the range profile.
Our approach to begin with this new topic is to select a simple canonical but representative structure of an urban area to perform the detection of targets inside it. Our canonical structure of interest is the urban canyon which can be defined as two buildings separated by a street (see Fig.1.2). This is obviously the most common structure of an urban scene. The choice of this urban structure decreases significantly the complexity of the problem since we have reduced the size of the propagation environment. As a long term perspective, the results of this study could be used to propose a SAR imaging mode that may avoid these artifacts as well as a new SAR processing technique to correct them. To analyze the origin of some artifacts in SAR images, the interaction of the signal with the components of the urban scene has to be mastered. To this end, the image analysts proposed
10 Chapter 1. Problematic and methodology
1.2. Problematic statement 11
EM models in order to understand the EM phenomenology of propagation inside the urban canyon. In [Franceschetti 2002], Franscetti et al. stated that there is an acknowledged lack of EM and radar models that are able to quantitatively predict and explain the SAR effects relevant to urban scenes. This is due to the high variability of urban landscapes, its complex combination with natural and man made elements, in addition to the wide variety of materials, object forms and size. Comprehensive and detailed EM models are advisable. The models published in the literature can be classified in two types:
• Numerical models that can give possible solutions to the backscattering prob-lem. If the scene is properly specified, the numerical techniques may provide more precise results with respect to analytical methods. However, numerical methods are difficult to use in the case where surfaces of different dielectric properties are defined. Indeed, these methods do not show the functional dependence between the scattered electromagnetic field and the scene pa-rameters. In addition, they are not efficient and are time-consuming if the numerical evaluation has to be repeated for an extended urban scene,
• Analytical models that allow an easy surface management with a possibil-ity to include any scene parameters. In addition, these models allow a fast evaluation of the reradiated field. It is important to underline that a fast computation is a crucial requirement if the evaluation procedure has to be performed several times; this is the case if the electromagnetic return from an entire radar scene including several buildings has to be evaluated. Unfortu-nately, such an analytical methods is not available in the current literature. According to Franscetti et al., there is no existing EM model that achieves a trade-off between the level of accuracy of the simulated results and the need to minimize the huge calculation time required by an exact EM method specially for the case of an extended urban scene. However, as our objective is to study the detection of NLOS targets in a simple urban structure (the canyon), we expect to find in the literature a developed method dedicated to similar canonical structures where the scattering is not so complex to understand and to simulate.
The approach we followed to address the state-of-art of our subject is based on the following alternatives:
• Either to use directly the results of the current methods investigating the detection of static targets or even moving targets in urban areas and to adapt them to our specific case of study,
• Or to perform our own analysis of the possible cases of target detection inside the urban canyon using an EM simulator. Therefore, we would have to study the specificities of the existing simulators of urban areas in order to choose the simulator that fits the best to our final goal.
Hence, the state-of-art will be organized in two parts: in the first part, we present the works dealing with the detection of targets that can be static or moving in urban areas whatever the used imaging mode (SAR, GMTI,..). Then, in the second part, we present the different SAR simulators applied to the specific case of urban analysis. The objective of this state-of-art is to have an idea about the current approaches applied to the problem of detecting NLOS targets in urban areas in order to find the best method that fits to our final objective or the method that we can rely on or adapt to achieve our goal.
12 Chapter 1. Problematic and methodology
1.3 Review of the state-of-art
1.3.1 Detection of the NLOS targets
In the literature, works dealing with the detection of targets in urban areas can be classified into two groups. The first group of works investigates the detection of moving targets (or tracking) and the second group performs the detection of static target. In the following, we start by presenting the works concerning the tracking of moving targets in simple urban environments.
1.3.1.1 Detection of the NLOS moving targets
Surveillance of ground targets has traditionally been performed by SAR, ground moving target indication (GMTI) radar, and/or electrooptical (EO) systems. Typ-ically, these systems are effective in open areas where LOS propagation from the sensing platform to the target is available. So far, there is a critical need for wide surveillance areas in urban scenes where the LOS detection of moving target is usu-ally obscured by buildings and others urban structures. This makes the detection of moving targets a challenging task. Nevertheless, some recent studies demonstrated that it is possible to design systems exploiting the NLOS propagation to provide improved radar coverage and track accuracy in simple urban structures (the urban canyon). The first work evaluating the feasibility of exploiting multipath prop-agation for improved moving target detection in simple urban environments was performed in [Krolik 2006]. In this work, a quasi-analytical model for NLOS prop-agation assuming multiple specular reflections between buildings is derived. This model evaluates the radar coverage as a function of the scene parameters (target range, relative target position on a street, building height and separation) and the sensor altitude to assess airborne GMTI system. The potential of exploiting multipath was demonstrated through a set of simulations. Another approach to demonstrate the contribution of multipath propagation in the frame of NLOS tar-gets tracking is proposed in [Tahmoush 2012] using radar measurements in various urban canyon environments. The experimental data was collected using an ISAR imaging system. In fact, the detection and tracking of NLOS moving objects using multiple bounces was attempted across a variety of urban buildings materials.
Based on the demonstrated performance that could be achieved by exploiting NLOS multipath propagation, some works proposed a model to help tracking tar-gets in simple urban environments. In [Linnehan 2009], the authors developed a 2D geometrical model allowing to study the detection of moving targets through an urban canyon in the case of far field. This geometrical model simulates the range/Doppler intensity plots for canyons with walls of different roughness. To val-idate their approach and to gain knowledge about the EM phenomenology needed to develop GMTI radar techniques that exploit the multipath propagation, they performed some outdoor experiments of a moving vehicle inside a canyon in the monostatic case, and they validated their proposed model in terms of velocity and range prediction of the multipath responses [Linnehan 2010]. Nevertheless, the am-plitude of the derived responses has not been validated.
In [Chakraborty 2011], Chakraborty et al. proposed a target tracker based on a waveform probabilistic data dedicated to multiple interactive motion models.
1.3. Review of the state-of-art 13
The new adaptive tracker computes the different probability detection values for a validated set of measurements in the case of LOS and NLOS returns from the target moving between three buildings, and then, select the simulated transmitted waveform that minimizes the mean-squared error (MSE) at each time step. The performance of this model has been evaluated in terms of MSE for the range position and the velocity of the different responses. However, as for the previous works, the performance of the proposed tracker to predict the amplitude of the responses has not been evaluated.
We can conclude that the multipath propagation can be exploited to investigate the detection of moving targets. Thus, based on this assumption, several models have been developed to investigate the target detection and the accuracy of these models has been evaluated in terms of the geometric velocity and range predictions for the multipath responses. Nevertheless, even if these models have shown satisfy-ing results for accurate target tracksatisfy-ing, we can not totally rely on them in the sense of using similar approaches and adapt them to our case of static target detection. The reason is that the validation of the proposed models is not complete as the validation of the amplitude is missing. The amplitude is an important parameter in the specific frame of target detection as it is possible to predict accurately the posi-tion in range and velocity of a response that may not exist. In fact, the response of a mechanism may disappear due to a huge loss in the amplitude caused by multiple interactions as well as the dielectric properties of the materials composing the scene. Therefore, to adopt a model for our specific application of detection, the phase as well as the amplitude parameters should be necessarily validated. In the following, we will present some of the current studies belonging to the second group of works investigating the detection of NLOS static targets.
1.3.1.2 Detection of the NLOS static targets
For the specific case of NLOS static target detection, the current state-of-art works did not investigate yet neither the detection of targets in the specific configuration of NLOS, nor the detection inside the specific urban structure of the canyon. They focused rather on the detection of LOS targets in a created scattering environment that induces multiple NLOS responses of the target. Then, the purpose of these works is to propose a SAR processing technique to remove the undesirable effects of NLOS responses in the image, named ghost images. Nevertheless, we will present these works in order to have a complete state-of-art of the problematic.
On the contrary of the previous works that exploit the multipath propagation as a useful information to correctly track the target, the approach is not the same for the works investigating the static target detection. In fact, for the case of a static target located in a rich scattering environment, the resulting SAR image will contain several NLOS responses due to the target in addition to the primary response (the LOS response). Hence, the detection task will be difficult to perform as it is difficult to distinguish the LOS response from the ghost images. The multipath propagation is no more exploited as it represents an obstacle to an accurate detection. Therefore, the current works focus on developing dedicated SAR image processing tools to remove the artifacts due the NLOS effects. TR-SAR (Time-Reversal) SAR is the most well known algorithm for target focusing and ghost image removal. It improves
14 Chapter 1. Problematic and methodology
automated target recognition and aids image analysts in identifying targets in dense multipath environment. Jin et al. developed this SAR algorithm for removing ghost images that are caused by multipath scattering when imaging two types of targets: the point target ([Yuanwei 2007a], [Yuanwei 2007b]) and the extended target ([Jin 2009]). The performance of this developed algorithm has been evaluated through a set of tests on experimental data and the results of removing ghost artifacts are satisfying.
After this first study of the state-of-art, we concluded that our work can not take advantages of the previous techniques investigating the detection of static and moving targets inside an urban scene for the following reasons:
• The validation of the proposed models to track NLOS targets is not completed for the the first group,
• Our first objective is not to propose an image processing technique to correct artifacts in SAR images of urban areas but rather, to understand the EM phenomenology of propagation inside the urban canyons that may explain the origin of some artifacts. So, our work does not belong to the second group.
Hence, the solution is to perform our own technique to investigate the detection of NLOS targets. Thus, we have to study a huge number of canyon configurations with different targets dimensions and positions inside the canyon in addition to different acquisition conditions related to the sensor. To do so, we need a huge urban data collection for various scene configurations, which is not available. To overcome this constraint, an approach would be to use a SAR simulator to be able to investigate all the possible tests needed to perform our analysis.
In the following, the second part of the state-of-art concerning the existing SAR simulators dedicated to urban areas analysis is presented. The main objective of this state-of-art study is to gain knowledge about the used simulation techniques and the corresponding applications to eventually select one of the simulators to assess the detection of NLOS targets in the urban canyons. In the case where this alternative is not possible, we can choose to develop our own tool referring to the used techniques of the existing SAR simulators.
1.3.2 SAR simulators of urban areas
The simulation process is in general a trade-off between an achievement of an ap-proximation as close as possible to the reality and the minimization of the compu-tational load and processing time. The simulation of SAR data is a widely used technique in radar remote sensing. Using simulations, the SAR data from sensors still under development can be synthesised. This provides data for developing image interpretation algorithms before the real sensor is launched. Moreover, the simula-tors can deliver images of any object of interest from various orbits, for a wide range of angles, using different radar wavelengths. In the long history of SAR simulation, many variants tools have been developed for different applications. In urban areas, SAR simulators are primarily used for mission planning, for the scientific analysis of the complex backscattering, and for geo-referencing. More broadly, simulators are used for sensor design, algorithm development, and for training and education. The different applications and their different requirements have lead to the development
1.3. Review of the state-of-art 15
of several SAR simulation techniques. In the following, we will present the most common techniques implemented in the SAR simulators and the main applications for which these SAR simulators have been designed for.
1.3.2.1 Techniques for SAR simulations
To determine how the simulated sensor and the virtual scene interact, two common methods are used: the ray tracing and the rasterization.
Ray tracing
Concept
Many SAR simulators use ray tracing or a derived technique. Ray tracing has been developed for the visualization of scenes in the optical dimension of light, based on the geometrical optics (described in Sec.3.4). In ray tracing, the path of each "ray" is followed from the SAR sensor, throughout the scene, and eventually back to the sensor. The number of rays launched on the scene depends on the implementation and the trade-off between the desired degree of realism and the need to minimize the computational load. At least one ray per slant-range resolution cell has to be ensured, but many simulators divide the scene into smaller cells, thus leading to a huge number of simulated rays throughout the scene. This method allows:
• The superposition of signal contributions into an individual cell,
• The automatic consideration of multiple reflections, shadows, and occlusions.
Validity domain
Standard ray tracing has the drawback that the rays are only reflected in the spec-ular direction, which is a valid assumption for very smooth surfaces. This implies that the non specular scattering contributions from rough surfaces are neglected.
Acceleration methods for ray tracing
Unfortunately, the ray tracing approach is rather computational time consum-ing, because for each pixel of the simulated image, one ray has to be traced. For this reason, this technique is normally not used for real time applications. However, by optimizing the data organization for a fast search, the calculation speed of ray tracing can be drastically increased ([Glassner 1984]). Typically, Oc-trees ([Kyu-Young 1995]), binary space partitioning ([Paterson 1990]) and Kd-trees ([Wald 2006]) are the most known methods to optimize the ray tracing method in terms of computation time and computer resources consumption.
RCS target simulation using ray-tracing method
For target RCS simulation, the shooting and bouncing rays technique ([Hao 1989]) is often applied. In shooting and bouncing rays, each ray is traced through a target, according to the law of geometrical optics, until it leaves the target. Afterwards, physical optics is applied in order to address diffraction, refraction, etc. This tech-nique is used in the SAR simulator (SE-Ray-EM) developed by Mametsa et al. ([Mametsa 2002]).
Rasterization
Besides ray tracing, a second technique, known by many as rasterization, can be used to visualize scenes with a lower computational load. This technique is widely used in real-time visualization applications, even though producing less realistic
16 Chapter 1. Problematic and methodology
results. Rasterization does not rely on tracing rays. It is based on meshing each 3D component into a set of elements, normally triangles that are transformed from world coordinates to image coordinates before rasterization. Each resulting 2-D tri-angle is rasterized to a collection of pixel fragments, called fragments. In subsequent fragment operations, the final intensity for each pixel is calculated. The final pixel value of an image can be determined by one or more fragments, either by combin-ing the fragments or by determincombin-ing a scombin-ingle fragment representcombin-ing the pixel value, for example, by depth sorting [Balz 2009]. Today, specialized graphics hardware is used to accelerate the coordinate transformations and rasterization of the vector data. When compared to ray tracing, this process is usually faster, because instead of tracking millions of rays, only thousands of objects have to be transformed by a series of multiplication operations. Recently, this process has been accelerated using a dedicated hardware configuration, in addition to an increase of the visualization speed. The radar target simulation GRECO (Graphical Electromagnetic Comput-ing) relies on rasterization to determine the visible parts of a target in order to speed up the RCS calculation ([Rius 1993b]). GRECO visualizes a 3D model using Graphics Processing Units (GPU). The concept was later extended for the SAR simulator GRECOSAR ([Margarit 2006]). Today, the graphics hardware is even more powerful, allowing for the GPU to be exclusively used for both the calculation and visualization of SAR images ([Balz 2009]).
Once the different interactions between the simulated sensor and the simulated elements of the scene are established, the second step is to evaluate the effects of every interaction of the travelling rays on the transmitted power. The goal is to calculate the backscattering intensity of each element of the scene under study. Some physical models, differing by their complexity, have been proposed for this goal. They will be presented in the following.
Ray tracing vs Rasterization in SAR simulation
For SAR simulations, the rasterization approach is less feasible, due to the numerous multiple reflections occurring in SAR images. Ray tracing is a standard technique and despite the higher computational effort involved, it is approaching real-time speed capability in some computer graphics applications. For SAR simulation, ray tracing is established as a standard technique used by a variety of software systems. Furthermore, Ray tracing and especially raw data simulators deliver more realistic simulation results than rasterization based simulators. This is due to the missing multi-bounce reflections and to the simplified backscattering model implemented in the rasterization-based simulators.
1.3.2.2 Physical models to calculate the backscattering intensity
A wide variety of different physical models are applied, ranging from the simplest to the most realistic possible. The desired complexity depends on the application.
Simplified physical model
In the following, we present some examples of simplified physical models to calculate the backscattering intensity.
1.3. Review of the state-of-art 17
These simulations are used for layover and occlusion calculation that do not need a physical model and may rely on geometric constraints alone. After implementing the SAR geometry, simple layover and occlusion detection can be realized by setting the basic reflection value of each "ray" or each "fragment-interaction" to a basic constant reflection value r, such as r = 1 as an example. In the final image, shadow regions will have a reflection value of r = 0, whereas layover areas will have values such as r > 1,
2. Simplified simulations based on the Lambertian reflection model:
In this model, the backscattering is always supposed to be of Lambertian nature meaning that the backscatter has the same strength in all directions ([Jutzi 2006]). Under this assumption the observed backscattering intensity ‡ depends only on the local incidence angle ◊iand the reflectivity, r, determined for example, by look-up tables. ‡ is calculated as follows:
‡= r cos ◊i (1.1)
3. Simplified simulations based on the Lambertian and specular reflection model: Similar to Phong shading model ([Phong 1975]), the backscattering can be divided into the sum of two contributions: a Lambertian part and a specular part. Calculating diffuse and specular reflections separately and combining them to obtain a total reflection coefficient has been done before by Arnold Bos et al. ([Arnold-Bos 2007]).
"More elaborated" physical model
Other simulators implement a complete physical model. There is a wide variety of EM models used for this purpose ([Fung 1992]; [Fung 1994]). To calculate the backscatter, various variables are needed to describe the interaction of the signal and the materials such as the dielectric properties and the parameters describing the surface roughness. The backscattering of different objects do influence each other. However, in rasterization, as well as in ray tracing, the contribution of each ray or pixel is calculated separately. Therefore, the effects of the mutual influence of the SAR scatterers have to be calculated in a post-processing step. As this step is time consuming and depends on the number of scatterers included in the calculation for each SAR image pixel, it is often neglected by simulators requiring fast simulation results.
In order to make the simulated SAR image looks as realistic as possible, the proper treatment of SAR speckle noise is also an important issue. This is to avoid situations where image analysis algorithms perform well on simulated data but fail in their actual application to real SAR data.
Speckle simulation
The characteristic speckle effect of SAR images results from the destructive and constructive interferences coming from the contribution of the different scatterers within a resolution cell. Therefore, the resultant pixel can differ extremely from its average gray value. These gray values variations between adjacent pixels lead to the physical grainy appearance of SAR images [Bolter 1996]. The speckle simulation is often simplified by assuming Rayleigh-distributed speckle. It can be obtained
18 Chapter 1. Problematic and methodology
by multiplying the calculated backscatter intensity with a number generated ran-domly according to the Rayleigh distribution ([Hammer 2008]). For high-resolution SAR images, the basic assumption for a Rayleigh distribution can be wrong, espe-cially for the case where high number of independent scatterers belong to the same resolution cell. Depending on the surface of study, various other probability distri-bution functions, including the Rician inverse Gaussian distridistri-bution ([Eltoft 2005]), K-distribution ([Jakeman 1976]), and many others ([Nadarajah 2008]), can describe the speckle more precisely. Besides approximating the appropriate probability den-sity function, the multiplication of the random value with the calculated backscatter intensity is an additional simplification of the speckle calculation.
1.3.2.3 Applications of SAR Simulations in Urban Areas Analysis of the complex radar backscattering of buildings
By comparing the simulated SAR images with the real ones, the interpretation of the real SAR data can be improved. Due to various disturbing effects in SAR images, such as speckle, layover and shadows, the interpretation is usually difficult. Simulations can help to:
• Explain the origin of certain artifacts in the SAR images, • Verify assumptions about the image content ([Guida 2008]),
• Investigate separately some combined effects and their mutual influence.
SAR Data Acquisition Planning
SAR simulations can assist the mission planning and can determine the best acqui-sition parameters. This is extremely important for time critical operations in urban areas as for the disaster management [Yonezawa 2002].
SAR Image Geo-referencing
SAR sensors hold a strong potential for change detection studies, especially thanks to their all weather mapping capability and can also guarantee operational systems in the presence of crucial circumstances and night conditions illumination. To detect whether or not a change has occurred, two images are taken of the same scene, but at different times. These images are then geometrically registered to be cross correlated after. The step of geometric registration of the images is called geo-referencing. However, due to geometrical properties of the SAR sensor, SAR images suffer from occlusions and ambiguities especially in urban areas. Additionally, layover and shadow effects disturb the geo-referencing of SAR images in urban areas, which is a prerequisite for a successful change detection analysis. An improved geo-referencing can be achieved by simulating 3D-city models using a SAR simulator and comparing the simulated image to the real image. Correspondences between simulated and real images can be used for geo-referencing the image according to the coordinates of the 3D-city model and street datasets. The geo-referenced dataset can afterwards be used for change detection analysis ([Balz 2004]).
Training and Education
SAR simulators are important tools for training and education and can increase knowledge of the physical mechanisms of SAR ([Nunziata 2008]). SAR simulators
1.3. Review of the state-of-art 19
offer a cost-effective way to generate thousands of simulated SAR images of certain objects as it allows for a multitude of looking and azimuth angle combinations to be demonstrated at low or no cost. SAR simulations further offer the possibility to produce or not certain SAR effects, such as speckling. These possibilities make SAR simulations a huge advantage both for the training and education of students as well for the analysis and interpretation of SAR data.
1.3.2.4 Classification of SAR simulators
Different types of SAR simulators are used for different applications. To differentiate between them, SAR simulators can be classified according to different schemes. Up to now, there is no available standard for the classification of SAR simulators. We present in the following some proposed classification models in the literature for urban SAR simulators.
Classification based on the outputs
An output based classification has been proposed by Francescetti et al. [Franceschetti 1995]. They classified the different simulators into two groups based on the final output:
• SAR raw data simulators: they simulate the raw data of a sensor which has to be processed in order to get a SAR image. They are mostly used for the design of sensors or SAR processors, or to improve the scientific understanding of the complex radar backscattering behavior. Raw data simulation process is rather slow. To improve the speed, Rius et al.[Rius 1993b] developed a radar-cross-section simulation system GRECO, which used graphics hardware to accelerate the geometric processing. Radar-Cross-Section (RCS) is a measure of the detectability of an object by the radar. It is explained more in details in Subsection.2.2.1,
• SAR image simulators: they produce a final SAR magnitude image. They are designed for applications like interactive mission planning, training using interactive tools, or assisting the interactive interpretation and analysis of SAR data. These simulators provide their results fast, comparing to the SAR raw data simulators, but are less realistic.
Classification based on the inputs
Simulators can be distinguished by the input they use to estimate the RCS ‡. The input-based classification from [Leberl 1990] distinguishes between three types of simulators according to the way they calculate ‡:
• ‡ is calculated using look-up tables [Balz 2009], • ‡ is derived from the real SAR image [Auer 2010],
• ‡ is calculated using physical models ([Franceschetti 1992], [Mametsa 2002]). A second input classification proposed by Balz in [Soergel 2010], is based on the model implemented in the simulation tool. Four types can be identified:
• Radar target simulators: calculating the RCS of single targets,
• SAR background simulators: simulating natural landscapes, often based on 2.5 D Digital Elevation Model (this model describes a surface rather than the
20 Chapter 1. Problematic and methodology
volume of a feature, for further details, see [Schön 2009]) data and look up tables,
• SAR target-background simulators: separating the background from the tar-get. The model applied to the background is often simplified and the model applied to the target may or may not be based on radar target simulators using shooting and bouncing rays,
• Integrated SAR simulators: not differentiating between the background and the targets. All objects are simulated in 3D and both inter and intra-object interactions are supported, covering multiple objects in an extended scene. A combined classification of SAR simulators using the inputs of the previous classification and the outputs of the classification of Francescetti et al. in [Franceschetti 1995] is proposed also by Balz in [Soergel 2010] (see Tab.1.1). In this classification, for simplification and coherency, Balz stated that only the simu-lation of the target is taken into account for SAR target-background simulators.
Table 1.1: SAR classification proposed by Balz in [Soergel 2010]. simulation outputs
SAR raw data simulator SAR image simulator look-up tables physical model look-up tables physical model
si m ul at ion inputs SAR background
simulator [Holtzman 1978] SARAS[Franceschetti 1992]
SARViz [Balz 2006b] SAR target
back-ground simulator GRECOSAR[Margarit 2006] Integrated SAR
simulator SARViz[Balz 2009] SE-RAY-EM[Mametsa 2002]
Classification based on the radiometric/geometric correctness
Auer et al. proposed in [Auer 2010] another SAR simulators classification based on two approaches:
• Approach focusing on the radiometric correctness:
This approach uses formulas to calculate a high-quality intensity values of the scattered field. These models take into account the roughness param-eters (i.e., rms height and correlation length) and dielectric properties of the surfaces in the scene to calculate the scattering. However, the level of detail of 3-D models to be used is limited. For example, Franceschetti et
al. [Franceschetti 1992] developed a SAR raw signal simulator (SARAS) and added reflection models for describing multiple-bounce effects at buildings modelled by a parallelepiped ([Franceschetti 2002], [Franceschetti 2003]). Del-lière et al. [Delliere 2007] developed a SAR raw signal simulator using finite-difference time domain (FTDT) technique in order to quantitatively evaluate the EM return of a rectangular parallelepiped (placed either on smooth or
1.3. Review of the state-of-art 21
rough surface). Even if this simulator is able to predict fine EM effects, the FTDT technique is very demanding in terms of computation time and mem-ory. It is therefore limited in its practical ability to represent very large areas, • Approach focusing on the geometric correctness: This approach focuses on representing the geometric effects of a detailed scene. The radiometric quality is of less importance in this approach. Balz [Balz 2006a] used programmable graphics card units for generating single-bounce SAR images in real time. Margarit et al. analyzed reflection effects by including multiple reflections and SAR polarimetry for detailed 3-D models of vessels [Margarit 2006] and build-ings [Margarit 2007], in addition, they preserved high radiometric quality by using a RCS simulator [Rius 1993a] named GRECO. Indeed, GRECO method is regarded as one of the most effective methods for RCS calculation, so it is used to calculate the scattering map of complex targets. In fact, simulation results using GRECO on complex radar targets can be found in [Rius 1993b], [Rius 1990] and show good agreement with the measurements. Brunner et
al. [Brunner 2011] demonstrated that their simulator based on a simplified radiometric model is sufficient to calculate many various effects related to the scene geometry such as layover, shadowing, multi bounces scattering and diffuse corner reflection. In [Hammer 2008], Hammer et al. proposed a com-parison between three simulators focusing on the geometric correctness. This comparison is based on the SAR geometric effects they are able to perform on a simple and complex urban structure.
In order to choose between the simulators dedicated to urban areas, the one that fits more to our application of NLOS target detection inside urban canyons, we have summarized into two groups the most common simulators of urban areas based on the radiometric and geometric correctness like in the Auer’s classification. For each group of simulator, we have specified the inputs, the outputs, the simulation techniques, the EM method for backscattering calculation, the validity domain and applications (see Tab.1.2and Tab.1.3).
To measure how far from the reality are the results, the validation step is re-quired. It is an indicator of the performances achieved by a simulator. The valida-tion process concerns these three steps:
• Comparison between simulation results and analytical formulation, • Cross-comparison between simulators or "bechmarking",
• Comparison of simulation results with measurement.
The wide variety of SAR simulators types and their corresponding applications makes comparisons between them difficult. Thus, a cross comparison between sim-ulators is not feasible. Therefore, the validity domain of a simulator would concern rather the first and the third steps. Even if we have chosen the same classifica-tion scheme as Auer et al., there is a point of difference with them concerning the classification of GRECOSAR. In fact, we have included GRECOSAR in the group of simulators based on the radiometric correctness as it has been used (for the specific case of urban SAR simulations) to evaluate the scattering of a simple target (a box of gypsum over a perfectly conducting flat plane). Moreover, we have added in this group a new simulator developed by Nguyen et al. that proposed a 3D model to characterize the EM scattering by an urban area which is com-posed by a group of buildings for both monostatic and bistatic radar configurations
22 Chapter 1. Problematic and methodology
[Nguyen 2011]. They assessed a quantitative evaluation of the scattered field ac-cording to the polarization of the incident wave, the geometry and the materials composing the scene. We mean by quantitative evaluation, the validation of the expected theoretical effects by a set of simulations of the proposed model. Whereas, the qualitative evaluation is usually based on the validation of the proposed model with experimental measurements. Even if this simulator deals with a higher level of urban structures complexity by involving the scattering of multiple buildings, these considered buildings are composed by simple structures (the parallelepiped) without any additional features (building balconies, trees, cars..). So, we included this simulator in the group of simulators based on the radiometric correctness.
1.3.2.5 What is the best simulator to apply for our application?
At the end of this state-of-art study, we can say that all the simulators based on the geometric correctness achieved good results in simulating high level of detailed and extended urban scenes. However, as the radiometric quality is limited, we can not rely on the approximated amplitude of the scatterers to investigate the detection. For the second group of simulators based on the radiometric correctness, huge efforts have been made on the EM calculation of the scattered fields of simple urban structures. So, these simulators may achieve our goal as we are dealing also with simple canonical structures (the urban canyon). However, even if the calculated intensity of the scatterers is well performed, it has not been validated with experimental data as far as we know according to the literature. So, we can not rely also on radiometric accuracy based simulators for our purpose.
As we can conclude through this state-of-art, there is a wide variety of methods investigating the detection of NLOS moving and static targets inside simple urban scenes, in addition to a large variety of simulators trying to model the EM propaga-tion inside different urban environments varying by their complexity. However, even if these works achieved satisfying results in detecting targets or simulating correctly the most important effects occurring inside an urban scene, their validation is not totally achieved yet. Specifically, the amplitude parameter has not been validated by current state-of-art works dealing with the EM modelling of urban areas. As mentioned before, this parameter is important in the specific framework of target detection as it determines the possible detection or not of a target.
1.4 Specifications of the objective
1.4.1 RequirementsAs an ideal SAR simulator dedicated to urban areas, that addresses both the geo-metric and radiogeo-metric accuracy, and that has been validated in terms of amplitude and phase, is not achievable for the moment, we have first to define the requirements of our simulator and the followed strategy to validate it. As our ultimate objective is to investigate the possible detection of NLOS targets inside urban canyons, our proposed tool should be:
• Dedicated to urban canyon configuration, • Fast in terms of computation time,
1.4. Specifications of the objective 23
• Efficient for phase and amplitude simulation of the scatterers responses, • Validated both in terms of phase and amplitude.
1.4.2 Approach
Regarding the specificities of our final application, we agreed that there is no need of a full detailed SAR image to detect the possible presence of a NLOS target inside an urban canyon. It is better to first understand the EM phenomenology of propagation inside the canyon to build then the dedicated tool for this purpose. The simulating tool should be able to analyze all the possible canyon configurations (empty canyon and canyon with a target included) and to determine automatically if a return back to the radar is possible. Considering the large variety of the configurations to be analyzed, we cannot develop a complex tool that will be obviously time-consuming. Consequently, the approach is to develop a simulation tool with a specific output, fast to compute, and at the same time efficient to investigate about the detection of NLOS targets inside the canyon. This output will not be a full image but rather a radar range profile. Indeed, the comparison between the range profiles with or without a NLOS target (change detection) will help in determining if a NLOS target is present in the canyon. Moreover, in this case, a deeper analysis of the range profiles gives information about the possible location of the target, and we could also make assumptions on the nature of the target. For instance, we can have clues concerning the directivity of the target, as well as its orientation.
After building this tool, the validation process is required. So for this purpose, some indoor measurements are needed.
At the end of this work, we should have at our disposal an efficient and validated tool dedicated to the detection of NLOS targets inside a simple but representative structure of an urban area.
1.4.3 Methodology
To develop our simulation tool dedicated to NLOS target detection inside urban canyons, we adopted the following methodology based on two-steps validation pro-cess. First, we have conducted some measurements in the anechoic chamber to study the EM propagation inside a canyon with and without the presence of the target. An EM theoretical study has been carried out to help understanding the scattering phenomena for a canyon with a ratio between the typical dimension d of the object of interest and the wavelength ⁄ imposed by the technical constraints of the anechoic chamber that does not correspond to the real case. Once the theoret-ical EM scattering investigated, a benchmarking between different EM commercial codes has been performed to select the EM code that best reproduces the EM indoor phenomenology of propagation inside the canyon. In fact, different comparisons be-tween the simulation results of two codes (FEKO and CST) and the experimental data have shown a good agreement both for the phase and amplitude. Then, they have been used to simulate the scattering of more realistic configurations (in terms of d/⁄ ratio). All this study concerning the validation of the EM code is presented in the second part of this thesis.
valida-24 Chapter 1. Problematic and methodology
tion of a fast and simple developed in-house EM code dedicated to NLOS target detection inside urban canyons. In fact, based on the simulation results of the EM validated commercial tool applied to real case configurations, we have developed our own EM tool. This tool predicts for any canyon configuration, the detectability areas where a NLOS target can be detected, and for the case where the target is present if it can be detected or not and the corresponding range signature. As a direct validation (direct comparison with the experimental data) is not possible due to the fact that the d/⁄ ratio can not be respected in the anechoic chamber, we validated our code with one of the selected EM codes. Indeed, a good agreement between the simulation results has been found for both phase and amplitude. An application of the results of our EM code to interpret real InSAR data is proposed in the last chapter.
In Fig.B.2, we propose a block diagram summarizing the different steps of the proposed methodology.
To understand the indoor EM phenomenology of propagation inside
a canyon
To select a reliable EM tool that correctly simulates the EM indoor
scattering of a canyon To use the results of the selected EM code to study real case configurations
To develop our EM code based on the simulation results of the selected EM
code for real case configurations To compare between the simulation results of the selected EM code and
the developed code To apply the developed code to
interpret real InSAR data
Validation of
the EM tool
Validation of the developed in-house tool
Figure 1.3: A block diagram summarizing the different steps of the followed method-ology to develop and validate our EM simulation tool dedicated to the detection of NLOS targets inside urban canyons.
1.4. Specifications of the objective 25 Tab le 1. 2: E xam pl es of SAR si m ul at or s bas ed on th e rad iom et ric cor re ct ne ss . SAR si m ul at or In pu t Output Si m ul at ion princ iple B ac ks cat te rin g cal cu lat ion Val id at ion Ap pl ic at ion s SAR AS [ Fr an ce sc he tt i1992 ] Sim ple can on ic al st ru ct ur es SAR raw dat a si m u-lat or Ra y tr ac in g K irc ho ff ap pr oac h for P O / G O ap pr ox im at ion s [ Fr an ce sc he tt i2003 ] -Q uan tit at iv e val id at ion of th e ex pe ct ed th eor et ic al EM eff ec ts pro duc ed by si m pl e ur ban st ru ct ur es (a par al le le pi pe d) -Q uan tit at iv e as se ss m en tof th e eff ec ts of ac hi ev ab le SAR im age s ac cor di ng to th e SAR se ns or par am et er s for a fix ed ur ban sc en e -Q uan tit at iv e as se ss m en tof th e eff ec ts of th e sc en e ge om et ry on th e SAR im age s for a fix ed SAR se ns or De lliè re et al . si m ul at or [ D el lie re 2007 ] Sim ple can on ic al st ru ct ur es SAR raw dat a si m u-lat or Not m en -tion ed FTDT te chn iq ue -Q uan tit at iv e val id at ion of th e ex pe ct ed th eor et ic al E M ef -fe cts pro duc ed by sim ple ur-ban st ru ct ur es -Q uan tit at iv e ev al uat ion of th e E M re -tu rn of a par al le le pi pe d us in g a ge o-m et ric an d E M de ve lop ed m od el Ngu ye n et al . si m ul at or [ Ngu ye n 2011 ] Sim ple can on ic al st ru ct ur es SAR raw dat a si m u-lat or Ra y tr ac in g UT D -P has e an d am pl itu de val -id at ion of th e si m ul at ed sc at te rin g of a righ t-an gl ed w ed ge w ith an E M sof tw ar e (X GTD) -P has e val id at ion of th e si m -ul at ed sc at te rin g of a can yon con figu rat ion (w ith tar ge t) w ith in do or m eas ur em en ts in th e cas e of ne ar fie ld -3D m od el to ch ar ac te riz e hi gh fr e-qu en cy sc at te rin g by si m pl e ur ban st ru ct ur es in th e m on os tat ic an d bi st at ic cas e G R E C O SAR [ M ar gar it 2007 ] Sim ple can on ic al st ru ct ur es SAR raw dat a si m u-lat or R as te riz at ion Hi gh fr eq ue nc ie s meth ods im ple m en te d in R C S si m ul at ion sy st em G RE CO : P O /M E C /P T D /I B C [ R iu s 1993b ] -V al id at ion of th e sc at te rin g be ha vi ou r of si m pl e ur ban tar -ge ts vi a pol ar im et ric si m ul a-tion s -S up por t of di ffe re nt im age ry m od es : P O LS AR /P O LI SAR /P O LI nS AR -E xp loi tat ion of P O LI NS AR dat a for ur ban id en tifi cat ion pr oc ed ur e: di s-cr im in at ion of di ffe re nt ki nd s of tar -ge ts (b ui ld in gs ,p ar ks ..)