ORIGINAL ARTICLE
Combining clinical factors and quantitative ultrasound
improves the detection of women both at low and high risk
for hip fracture
C. Durosier&D. Hans&M. A. Krieg&C. Ruffieux&
J. Cornuz&P. J. Meunier&A. M. Schott
Received: 23 January 2007 / Accepted: 4 June 2007 / Published online: 11 July 2007 # International Osteoporosis Foundation and National Osteoporosis Foundation 2007
Abstract
Summary We hypothesized that combining clinical risk factors (CRF) with the heel stiffness index (SI) measured via quantitative ultrasound (QUS) would improve the detection of women both at low and high risk for hip fracture. Categorizing women by risk score improved the specificity of detection to 42.4%, versus 33.8% using CRF alone and 38.4% using the SI alone. This combined CRF-SI score could be used wherever and whenever DXA is not readily accessible.
Introduction and hypothesis Several strategies have been proposed to identify women at high risk for osteoporosis-related fractures; we wanted to investigate whether com-bining clinical risk factors (CRF) and heel QUS parameters could provide a more accurate tool to identify women at both low and high risk for hip fracture than either CRF or QUS alone.
Methods We pooled two Caucasian cohorts, EPIDOS and SEMOF, into a large database named“EPISEM”, in which 12,064 women, 70 to 100 years old, were analyzed. Amongst all the CRF available in EPISEM, we used only the ones which were statistically significant in a Cox multivariate model. Then, we constructed a risk score, by combining the QUS-derived heel stiffness index (SI) and the following seven CRF: patient age, body mass index (BMI), fracture history, fall history, diabetes history, chair-test results, and past estrogen treatment.
Results Using the composite SI-CRF score, 42% of the women who did not report a hip fracture were found to be at low risk at baseline, and 57% of those who subsequently sustained a fracture were at high risk. Using the SI alone, corresponding percentages were 38% and 52%; using CRF alone, 34% and 53%. The number of subjects in the intermediate group was reduced from 5,400 (including 112 hip fractures) and 5,032 (including 111 hip fractures) to 4549 (including 100 including fractures) for the CRF and QUS alone versus the combination score.
Conclusions Combining clinical risk factors to heel bone ultrasound appears to correctly identify more women at low risk for hip fracture than either the stiffness index or the CRF alone; it improves the detection of women both at low and high risk.
Keywords Clinical risk factors . Hip fracture . Osteoporosis . Quantitative ultrasound . Risk score
Introduction
Osteoporosis is a major public health problem. There are an estimated 9.4 million postmenopausal white women (i.e., 30% of all white women ≥50 years of age) with osteo-porosis in the United States [1], leading to more than
C. Durosier
:
D. Hans (*)Division of Nuclear Medicine, Geneva University Hospital, 1211 Geneva 14, Switzerland
e-mail: [email protected] C. Durosier
:
A. M. SchottClinical Epidemiology Unit, Medical Information, Hospices Civils of Lyon,
Lyon, France
M. A. Krieg
:
C. Ruffieux:
J. Cornuz Outpatient Clinic, University Hospital, Lausanne, SwitzerlandP. J. Meunier
:
A. M. Schott Edouard Herriot Hospital, Inserm U403,250,000 hip fractures annually [2–5], at least 90% of which occur in women≥70 years of age [6,7]. One in every six white women will sustain a hip fracture during her lifetime [8,9]. Hip fractures are responsible for an increased risk of mortality, increasing the 5-year mortality rate by about 20%. They also produce considerable morbidity, with many patients suffering from severe and often persistent physical and social limitations [6,10–15].
Dual X-ray absorptiometry (DXA) is the current gold standard to predict fractures. However, due to high costs, stringent reimbursement criteria, and a lack of awareness and available DXA devices in certain geographical parts of the world, only a small percentage (from approximately 20% to 30%) of women with osteoporosis are diagnosed using DXA [16, 17]. In instances wherein DXA is unavailable or not readily accessible, other methods – either historical, as in the use of clinical risk factors (CRF), or quantitative, as in quantitative ultrasound (QUS) of the heel – might be used as a surrogate method to identify women both at low and high risk for hip fracture. Indeed, numerous studies have shown that heel QUS is a strong predictor of hip fracture [18–26]. Similar findings have been reported for CRF [22,27–37]. However, there are no existing guidelines pertaining to the clinical use of QUS. Nonetheless, one could foresee several scenarios in which QUS might be used:
– Detecting women at very high risk for fracture, using a single threshold
– Detecting women at very low risk for fracture, using a single threshold; thereby avoiding further examination – Detecting both women at very high risk and women at
very low risk for fracture, using two thresholds; women in neither category (those at moderate risk) would be referred for further examination.
In addition, heel QUS and CRF predict hip fracture independent of each other [22, 27–37]. Therefore, the previous scenarios could be performed combining heel QUS and CRF, likely improving the predictive power of either instrument used alone. However, to date, only two published studies have addressed this question. Porter et al. combined the broadband ultrasound attenuation (BUA) and cognizance testing into a risk score [23]. They found that the incidence of hip fracture was 12.8% in the high risk (low BUA index and cognizance score) group, versus 1.5% in the lowest risk (high BUA index and cognizance score) group. Dargent-Molina et al. defined three specificity cutoffs (50%, 25% and 10%)[22]. They found that adding age to calcaneal BUA in a risk score increased sensitivity relative to using each parameter alone. Adding gait speed to the BUA improved sensitivity, but this increase was significant only at the 25% cutoff and relative to gait speed alone. These two studies focused only on those at high risk.
At a recent conference, Krieg et al. proposed a risk score based upon a linear combination of QUS and CRF, for use in the prediction of non-vertebral fracture risk [38].
Using a very large database, we took the next step, determining both a high-risk and a low-risk threshold, thereby identifying three categories of women (high-risk, moderate risk, and low-risk), and setting conditions for sensitivity or specificity during the construction of the two thresholds in order to compare QUS alone, CRF alone, and QUS and CRF used together. We hypothesized that combining heel QUS and CRF would improve the detection of women both at low and high risk for hip fracture. Our goal was to assess whether this easy-to-use composite risk score improves hip fracture detection in a large, population-based database.
Materials and methods
Study population
We pooled two large prospective cohorts of Caucasian women, EPIDOS and SEMOF, to generate a larger database, called ‘EPISEM’. This was feasible because of the similarity of the questionnaires on osteoporosis CRF used during data collection, the risk factors investigated, the measurement techniques used, and the study populations. The following are details about the two original databases: (1) EPIDOS (EPIDemiology of Osteoporosis): This was a cohort of French 7,598 women age 75 and over, enrolled in a multi-centre prospective study on hip fracture risk factors [18, 39]. Women who had undergone a bilateral hip replacement or had previ-ously suffered a hip fracture were excluded. From the EPIDOS study, we only used baseline data from the questionnaires, tests for osteoporosis, and the heel stiffness index (SI), determined using QUS (Achilles, GE-Lunar Corp.). QUS measures the speed of sound (SOS, in m/s) and the degree of attenuation of the ultrasound (BUA, in dB/MHz), so as to calculate a SI (%), which is a combination of BUA and SOS (SI= (0.66× BUA) + (0.28× SOS) - 416.7) [40,41]. Only 5,896 women in the database had undergone heel QUS and had non-outlier values for DMO by DXA and for SI by QUS. The survey instrument included questions or test instruments to collect data on anthropometric indices, behavior, health conditions/states, gynecologic state, fracture/treatment/fall history, simple function, and mental status. Women were followed for an average of 3 years, during which time, hip fracture occurrence and state/condition changes were deter-mined every 4 months.
(2) SEMOF (The Swiss Evaluation of the Methods of Measurement of Osteoporotic Fracture Risk): This was a cohort of 7,062 Swiss women, 70 years and over, who were enrolled in a prospective multi-centre study comparing three heel QUS devices in the assessment of hip fracture risk [42]. From the SEMOF study, we used only baseline data from the questionnaires/tests for osteoporosis CRF, and the heel SI as determined by QUS (Achilles, GE-Lunar Corp.). The survey instrument included questions or test instruments to collect data on anthropometric indices, behavior, health conditions/states, gynecologic status, fracture/ treatment/fall history, and simple function. As for the EPIDOS sample, all subjects had been followed for an average of 3 years to identify incident hip fractures. Consequently, the EPISEM database consisted of 12,958 women, 7,062 from SEMOF and 5896 from EPIDOS. However, due to missing values, we used a sample of 12,064 women Among all the CRF variables available in the EPIDOS and SEMOF studies, only 22 were retained for the EPISEM database, in accordance with our previously-published review article [43]; this article allowed us to select the CRF deemed most significant for hip fracture risk in prospective studies. Furthermore, we focused on factors related to bone. Finally, only variables available both in EPIDOS and SEMOF were used. These variables were age, height, weight, body mass index (BMI), heel stiffness index, prior history of fracture, prior history of fall, prior exposure to estrogen, current exposure to estrogen, chair test success, current diabetes, high level of education, sedentary lifestyle, current smoking, prior smoking, past glucocorticoid use lasting at least 3 months, current glucocorticoid use, maternal history of hip fracture, early menopause, surgical menopause, current thyroid hormone treatment, and parity (parous versus nulliparous).
Quality control procedures were conducted to assess the data gleaned from the two studies, which included in vitro and in vivo precision as well as cross-calibration between QUS devices, as described elsewhere [18,42,44]. Cross calibration between studies also was performed (data not published).
Statistical analysis
Baseline characteristics of the EPISEM sample were expressed as means and standard deviations (SD) for continuous variables, and as percentages for categorical variables. Inter-group comparisons, between the fracture and non-fracture groups, were conducted with p<0.05 set as the threshold for statistical significance.
Initial univariate analysis consisted of Cox regression to identify risk factors that were statistically associated with hip fracture. As a second step, Cox multivariate analysis
was performed, using backward stepwise selection, retain-ing variables at a 5% level of significance. All possible interactions between variables were examined. Cox analysis by STATA, in turn, generated hazards ratios (HR).
With respect to continuous variables, no transformation was performed for age, height or weight. BMI, on the other hand, was stratified into a categorical variable, consisting of three categories: <26, C26–31C, and ≥31. In addition, because no accepted thresholds exist for heel QUS, we used the high and low-risk thresholds for SI defined by Hans et al.: 59.1 and 77.6, respectively [45].
A primary model was generated to represent a risk score combining the stiffness index and clinical risk factor values. This combined SI-CRF score was compared with the risk score comprised of CRF data alone, and the risk score comprised of the SI plus the patient’s age.
The variable‘cohort’ was entered into the Cox model to prevent potential heterogeneity, but the corresponding β coefficient (calculated from the corresponding HR generat-ed by STATA) was not includgenerat-ed in the score. To adjust for bias introduced by using the same patient data to both generate and validate the score, we used the bootstrapping tool provided in STATA to assess the stability of each model; this bootstrapping step demonstrated that the coefficients in the multivariate model were statistically significant, and that the model was stable.
We constructed three Cox multivariate models, using (1) the heel stiffness index plus the patient’s age; (2) the clinical risk factors deemed significant (p≤0.05) on univariate analysis; and (3) the stiffness index, age and the CRF selected in model 2. We converted each final multivariate Cox model into a simple additive risk score, using theβ coefficient (calculated from the corresponding HR) for each independent predictor, thereby weighting each variable relative to its influence on hip fracture risk. To generate integer-valued additive factors, we multipliedβ by 10 and rounded the result to the nearest full digit to obtain risk points. The final SI-age score was constructed using a linear combination of the class value weighted by the associated risk points. For the categorical variables, we have attributed to each class a integer (0 vs. 1 or 1 vs. 2). We have named this integer value the“class value”.
For the risk score based upon CRF alone, we evaluated the potential effect of variables previously found non-significant on univariate analysis.
For each of the 3 risk scores, we determined two thresholds (high and low-risk), utilizing the approach described by Hans et al. [45]. The application of these thresholds to the database determined, for each score, three categories of women: those at low, intermediate and high risk for hip fracture. For each of the 3 scores, a ‘high risk’ threshold was defined as the value of the score corresponding to a specificity of 80%. Using this threshold, performance indicators were: (1)
sensitivity (the percentage of women defined at high risk at baseline among those who ultimately sustained a fracture); (2) positive predictive value (PPV, the percentage of women at high risk who sustained a fracture); and (3) 100%-PPV (the percentage of women at high risk who failed to develop a fracture, a group that represents those women who were treated inappropriately).
For the ‘low-risk’ threshold (corresponding to a sensi-tivity of 90%), we measured three other indicators: (1) specificity (the percentage of women defined at low risk at baseline among those without fractures); (2) negative predictive value (NPV, the percentage of women deemed to be at low risk who did not sustain a fracture); and (3) 100%-NPV (the percentage of women deemed to be at low risk who actually sustained a fracture, which represents the percentage of women who should have been treated).
All statistical analyses were performed using the statistical software package, STATA version 8.2.
Results
Baseline characteristics for the 12,064 women between 70 and 100 years old in the EPISEM database are shown in
Table1. During a mean follow-up period of 3.2±0.9 years, 307 hip fractures were observed, for an incidence rate of 7.32 per 1,000 woman-years.
In the univariate Cox model, several factors were associated with hip fracture at the 5% significance level. They were patient age, low height, low weight, low BMI, low stiffness index, a prior history of fracture, a prior history of a fall (within the past year), no prior or current exposure to estrogen, chair test failure, the presence of diabetes, and a sedentary lifestyle (Table1).
Risk score based upon SI and age
The variables entered in the multivariate Cox model were age, as a continuous variable, and stiffness index, as a categorical variable (≤59.1; ]59.1–77.6 [; ≥77.6) [45]; these variables all were significant at the 5% level. No interaction term was statistically significant. To calculate the risk score for each woman, the number of points associated with each indicator was multiplied by the corresponding class value (Table2). The final score was obtained easily as the sum of these weighted points. For example, a 82-year-old woman with a stiffness index of 74 had a risk score of (12×1) + (1×7) = 19. Even though the maximum possible score was
Table 1 Characteristics of baseline variables in the EPISEM sample (n =12,064)
Non-hip-fracture group Hip-fracture group Univariate Cox model
Mean ± SD % Mean ± SD % P-value* HR** (95% CI)
Age 77.6±4.3 81.0±4.8 0.0000 1.16 (1.13–1.18)
Height 156.3±6.5 155.0±6.8 0.0015 0.98 (0.96–0.99)
Weight 62.7±11.2 58.98±9.8 0.0000 0.97 (0.96–0.98)
BMI 25.7±4.3 24.5±3.8 0.0000 0.94 (0.91–0.97)
Stiffness index 68.9±13.5 59.7±12.6 0.0000 0.94 (0.93–0.95)
Prior history of fracture 48.3 55.9 0.0105 1.38 (1.10–1.75)
Prior history of fall 27.7 33.6 0.0286 1.36 (1.06–1.73)
Prior exposure to estrogen*** 18.1 12.2 0.0107 1.65 (1.16–2.36)
Current exposure to estrogen*** 8.1 4.2 0.0166 1.87 (1.05–3.33)
Chair test succeed*** 90.9 78.7 0.0000 2.82 (2.13–3.75)
Presence of diabetes 5.8 9.4 0.0093 1.76 (1.18–2.62)
High education 9.9 14.3 0.0131 1.31 (0.94–1.83)
Sedentary 37.3 53.5 0.0000 1.77 (1.40–2.24)
Current smoking 5.5 6.0 ns 1.18 (0.72–1.92)
Already smoked 18.4 15.1 ns 0.86 (0.62–1.19)
Glucocorticoids 3 months in past 5.0 6.4 ns 1.23 (0.77–1.99)
Current glucocorticoids 2.4 2.8 ns 1.25 (0.62–2.53)
Maternal hip fracture 8.6 8.7 ns 1.02 (0.67–1.53)
Early menopause 13.6 16.8 ns 1.24 (0.91–1.69)
Surgical menopause 19.0 15.7 ns 0.82 (0.60–1.13)
Current thyroid hormone treatment 4.6 3.8 ns 0.87 (0.47–1.58)
Parous 77.5 79.7 ns 1.13 (0.85–1.51)
HR: Hazard ratio; ns: non significant
* Comparison between the hip-fracture group and the non-hip-fracture group
62 [(30×1) for age=100, and (2×16) for a stiffness index ≤59.1], the maximum score observed in the study popula-tion was 44. Based upon the sensitivity and specificity criteria mentioned earlier, the‘low-risk’ threshold was set at 12 and the‘high risk’ threshold at 23.
Risk score based upon CRF alone
The variables that were entered into the Cox model were age as a continuous variable, BMI as a categorical variable (≥31; C26–31C; and <26), and several binomial variables: prior history of fracture, prior history of fall, no prior exposure to estrogen, chair test failure (failure to stand up at least 2 times from a chair without arms), presence of
diabetes, and cohort (Table 2). No interaction term was statistically significant.
The score was determined by weighting variables, as previously described. For example, an 82-year-old woman with a BMI of 30, who already had sustained a fracture, had fallen, took oestrogen, failed the chair-test, and has diabetes would have a score of [(12×1) + (1×6) + (1×4) + (1×3) + 0 + (1×8) + (1×7)] =40. Even though the maximum possible score was 76 [(30×1) points for age=100, (2×10) for a BMI <26, (1×4) for a prior history of fracture, (1×3) for a prior history of fall, (1×4) for not having taken estrogen treatment in the past, (1×8) for failing the chair-test, and (1×7) for diabetes], we observed a maximum of 54 in the study population. The ‘low-risk’ threshold was set at 19 and the ‘high-risk’ threshold at 28.
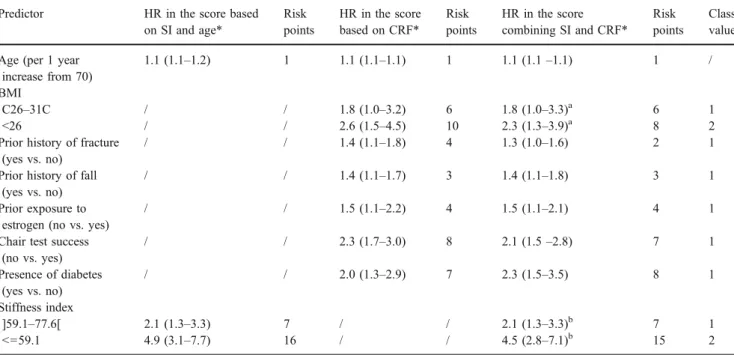
Table 2 For the prediction of hip fracture, the hazard ratio per standard deviation change (or class change for categorical parameters) for each parameters included into a multivariate Cox model corresponding to the three 3 risk scores are reported (SI plus age; clinical risk factors alone; and combining SI and clinical risk factors)
Predictor HR in the score based on SI and age* Risk points HR in the score based on CRF* Risk points HR in the score combining SI and CRF* Risk points Class value Age (per 1 year
increase from 70)
1.1 (1.1–1.2) 1 1.1 (1.1–1.1) 1 1.1 (1.1–1.1) 1 /
BMI
C26–31C / / 1.8 (1.0–3.2) 6 1.8 (1.0–3.3)a 6 1
<26 / / 2.6 (1.5–4.5) 10 2.3 (1.3–3.9)a 8 2
Prior history of fracture (yes vs. no)
/ / 1.4 (1.1–1.8) 4 1.3 (1.0–1.6) 2 1
Prior history of fall (yes vs. no)
/ / 1.4 (1.1–1.7) 3 1.4 (1.1–1.8) 3 1
Prior exposure to estrogen (no vs. yes)
/ / 1.5 (1.1–2.2) 4 1.5 (1.1–2.1) 4 1
Chair test success (no vs. yes) / / 2.3 (1.7–3.0) 8 2.1 (1.5–2.8) 7 1 Presence of diabetes (yes vs. no) / / 2.0 (1.3–2.9) 7 2.3 (1.5–3.5) 8 1 Stiffness index ]59.1–77.6[ 2.1 (1.3–3.3) 7 / / 2.1 (1.3–3.3)b 7 1 <=59.1 4.9 (3.1–7.7) 16 / / 4.5 (2.8–7.1)b 15 2
HR: hazard ratio; SI: stiffness index; CRF: clinical risk factors; vs.: versus *(95% Confidence Interval)
a
: reference class : BMI >=31
b
: reference class : stiffness index >=77.6
In addition the value attributed to the different class or risk are also mentioned.
Table 3 Comparative performance of the three risk scores (SI plus age; clinical risk factors alone; and combining SI and clinical risk factors) in the detection of women at high risk for hip fracture, using the high-risk threshold corresponding to a specificity∼80%
Strategies
Parameter (95% CI) Score based on SI and age Score based on CRF Score combining SI and CRF
sensitivity 51.7 (45.8–57.7) 52.8 (46.8–58.7) 57.0 (51.0–62.8)
PPV 6.0 (5.1–7.0) 5.7 (4.8–6.6) 6.5 (5.6–7.6)
1-PPV 94.0 (93.0–94.9) 94.3 (93.4–95.2) 93.5 (92.4–94.4)
Risk score combining SI and CRF
The variables entered into the multivariate Cox model were age as a continuous variable, BMI as an ordinal categorical variable (≥31; C26–31C; and <26), the stiffness index as an ordinal categorical variable (≤59.1; ]59.1–77.6[; and ≥77.6) and several binomial variables: prior history of fracture, prior history of a fall, no prior exposure to estrogen, chair test failure, diabetes, and cohort. These variables all were significant at the 5% level, and were retained in the final multivariate Cox model (Table2). No interaction term was statistically significant.
The composite score was determined as previously described. The maximum possible score was 100, but the maximum observed in the database was 64. The‘low-risk’ threshold was set at 25 and the‘high-risk’ threshold at 36. Using these two thresholds, 42% of the women were classified in the low-risk group (5,012 women), 21% in the high-risk group (2,503 women) and 38% in the intermedi-ate-risk group (4,549 women).
Detection of women at high risk for hip fracture
Using the high-risk threshold, we show the values for the three indicators (sensitivity, PPV and 1-PPV) in Table 3. The composite score, combining SI and CRF, seemed to yield the best results for all indicators. With respect to PPV
and 1-PPV, the score based upon CRF alone seemed to generate the least satisfactory results. The composite score produced a sensitivity of 57%, versus 51.7% for the SI-age score and 52.8% for the score based on CRF alone; among the fractured women, the composite score identified 163 women at high risk, 12 more than using CRF alone (151) and 15 women more than using the score comprised of SI plus age (148).
Detection of women at low risk for hip fracture
Using the low-risk threshold, we show the values for the three indicators (specificity, NPV, and 1-NPV) in Table 4. The score combining SI and CRF yielded the best results, but the SI + age score and the score based on CRF alone did produce correct values. The score based upon CRF alone seemed to be the least specific. NPV and 1 - NPV were identical with CRF alone versus SI + age alone. The composite SI-CRF score correctly identified approximately 9% more women at low risk for hip fracture than CRF alone (specificity of 42.4% versus 33.8%) and 4% more women than the SI + age score (42.4% versus 38.4%); among the women without fractures, the composite score identified 4,989 women at low risk, 465 women more than using the SI + age score (4,524) and 1,008 more than using CRF alone (3,981).
The areas under the receiver operating characteristic (ROC) curve were 0.729 (0.701–0.759), 0.746 (0.718– 0.774) and 0.762 (0.735–0.789) for CRF alone, SI + age, and SI + CRF, respectively (Fig. 1). Using chi-square analysis, statistically-significant differences were identified between the areas under the ROC curves, both between SI + age and SI + CRF (p<0.001) and between CRF alone and SI + CRF (p<0.001), but not between SI + age and CRF alone.
Discussion
In a large cohort of over 12,000 Caucasian women, derived from two prospective cohorts of Europeans, we found that a simple additive risk score combining the stiffness index (SI) and easily-assessed CRF (patient age, BMI, prior history of
Table 4 Comparative performance of the three risk scores (SI plus age; clinical risk factors alone; and combining SI and clinical risk factors) in the detection of women at low risk for hip fracture, using the low risk threshold corresponding to a sensitivity∼90%
Strategies
Parameter (95% CI) Score based on SI and age Score based on CRF Score combining SI and CRF
specificity 38.4 (37.5–39.3) 33.8 (32.9–34.7) 42.4 (41.5–43.3)
NPV 99.4 (99.1–99.6) 99.4 (99.1–99.6) 99.5 (99.3–99.7)
1-NPV 0.6 (0.4–0.9) 0.6 (0.4–0.9) 0.5 (0.3–0.7)
CI: confidence interval; SI: stiffness index; CRF: clinical risk factors; NPV: negative predictive value
Fig. 1 Receiver operating characteristic (ROC) curves for the 3 risk scores (SI plus age; clinical risk factors alone; and combining SI and clinical risk factors). SI: stiffness index; CRF: clinical risk factors
fracture, prior history of fall, no prior exposure to estrogen, chair test failure, and the presence of diabetes) was able to improve the detection of women at both low and high risk for hip fracture, relative to SI or CRF alone. This composite score improved specificity by 4%, corresponding to 465 additional women correctly identified, and up by 9%, corresponding to 1,008 additional women correctly identi-fied, relative to the SI + age score and the score for CRF alone, respectively. It improved sensitivity by 4%, corresponding to 12 additional women, and by 5%, corresponding to 15 additional women, relative to the score for CRF alone and the SI + age score, respectively. The composite score also tended to improve hip fracture prediction (PPV of 6.5% versus 6.0% and 5.7%), decreasing the number of women unnecessarily treated. Another positive aspect of the combination is the decrease of number of subjects in the intermediate group. Indeed, this number was reduced from 5,400 (including 112 hip fractures) and 5,032 (including 111 hip fractures) to 4,549 (including 100 including fractures) for the CRF and QUS alone versus the combination score.
On one hand, clinical risk factors are cheap and quite predictive; but, on the other hand, can one truly justify treating or not treating patients on the basis of qualitative parameter only? Indeed, prior initiating a treatment it is usually very reassuring to have quantitative information on the bone. In addition QUS is an inexpensive and effective measurement tool that is covered by many insurance policies. Comparing the cost of such a technique and the clinical outcome of the combination (adding SI to CRF), this approach would be likely cost-effective assuming that patients identified at very low or very high risk of fracture do not need any further DXA examination. In addition we have seen that adding SI to CRF will better classify the number fo subject in the intermediate group (moderate risk). Indeed about 900 subjects initially classified into this“grey zone” have been re-assigned to either high or low risk group demonstrating apparently a cost effective gain of this approach.
Similar findings but to lesser extend have been found for QUS users. Adding CRF to SI in a composite score is obviously a cost-effective advantage. Indeed, by just asking seven easy to ask questions, the predictive power of QUS is significantly improved (specificity and sensitivity). There-fore it would be recommended to use CRF in conjunction of QUS measurement. In addition for those who are still doubtful about the use of QUS in the management of osteoporosis, combining CRF with QUS would enhance positively the degree of confidence. Again the number of subjects in the intermediate group has been reduced by about 500 (including 11 hip fractures), meaning that these patients have been re-classified to either low or high risk group.
In both scenarios (CRF + SI or SI + CRF) for low-risk wom-en, we propose a reexamination after 5 years corresponding
approximatively to the monitoring time interval [45]. Accord-ing to our proposed strategy, those 38% of women deemed to be at the moderate-risk, who comprise what we would call an ‘osteopenic group’ if we were using DXA and the WHO definition, would have a DXA examination when available; otherwise, alternative management should be considered (e.g., nutrition, exercise, followed by re-examination after two years). It is important to remember that the risk score we propose predicts hip fracture relative to a gradient of risk, which has nothing to do with the classification of osteoporosis as in the WHO definition.
It is difficult to compare our results with those reported by other papers in the field, because our review of the literature demonstrated that strategies focusing on hip fractures in women either combine DXA and CRF (with or without QUS), DXA and QUS, or bone markers and DXA (and/or QUS) [43]. Combining QUS and CRF has been studied in the context of other kinds of fracture. The only two studies that assessed the combination of QUS and CRF for hip fractures in women both used very different CRF and BUA, and neither used the stiffness index as the QUS parameter [22,23].
The risk score using two thresholds allowed detection of both low-risk and high-risk women. In practice, further issues need to be addressed. What should be done with high-risk women? What should be done with low-risk women? With women at moderate risk? Our approach would mean treating high-risk women on the basis of a low QUS value (and the presence of some CRF) without further confirmation. A key challenging question is whether individuals identified by QUS as “high risk” for fracture will benefit significantly by treatment with antiresorptive agents or other medications. Currently, there are no randomized double blinded, placebo control clinical trials showing reduction of fracture risk in patients selected for treatment according to QUS measurement. However, as stated by Glüer, there are good reasons to believe that these patients would benefit from approved osteoporosis medi-cations; indeed, the primary effect of these medications is in improving bone strength, and heel QUS have been shown to reflect femoral bone strength [46].
Admittedly, our study has limitations. The first deals with the issue of generalizability. Because all the women in the study were volunteers, Caucasian and living indepen-dently at home, our results may not be applicable to less mobile, less healthy elderly women, such as nursing-home residents, or to Eurasian and black women. In addition, since the EPISEM population only included women who were 70-years old and over, our results may not be extrapolated to a large population of younger women, or to men. Second, the risk factors we included in our models were limited to those both easily-accessed and measured in the EPISEM study population. Other risk factors reported in
the literature might improve the performance of the risk score [43]. From a QUS prospective, it is well know that QUS parameters can predict hip fracture equally well than DXA [43]. However results for one device may not be extrapolated to another one technologically different. Therefore our results are device specific, although we believe that any other well validated heel ultrasound device will end up with similar results.
In conclusion, we have developed an additive composite risk score to assess the risk of hip fracture in older postmenopausal Caucasian women using specific thresholds. This score, which combines the heel stiffness index (SI), as measured by QUS, and a set of easily-determined clinical risk factors, appears to be more sensitive and specific than either the SI or CRF used alone, in terms of detecting women at low risk and women at high risk for hip fracture over 3 years. In addition, this composite score does not require supplementary time or costs and is not associated with any ionizing radiation exposure. As such, we believe that it may be useful in both the initial detection and ultimate management of osteoporosis among postmenopausal wom-en, especially in terms of reducing health care costs, and in communities wherein DXA is not readily accessible. The combined SI-CRF / CRF-SI potential also could eliminate the costs incurred by performing DXA examinations on both low and high risk group. Subsequently only 38% of elderly post-menopausal women who are at intermediate risk of hip fracture (4549) would need a DXA examination if available. Additional models currently are under investigation (differ-ent thresholds and methodology) as well as a cost-effective analysis.
Acknowledgements We want to thank the EPIDOS and SEMOF study groups for making their databases available to us. The EPIDOS study was supported by a contract INSERM-MSD-Chibret. This analysis was partly funded by a research grant provided by Geneva University Hospital.
Members of the EPIDOS study group: Coordinators: G. Bréart, P. Dargent-Molina, P.J. Meunier, A.M. Schott, D. Hans, P.D. Delmas. Principal investigators (center): C. Baudoin, J.L. Sebert (Amiens); M.C. Chapuy, A.M. Schott (Lyon); F. Favier, C. Marcelli (Montpellier); E. Hausherr, C.J. Menkes, C. Cormier (Paris); H. Grandjean, C. Ribot (Toulouse).
Members of the SEMOF study group: M-A. Krieg, J. Cornuz, C. Ruffieux, G. Van Melle, D. Büche, M. A. Dambacher, F. Hartl, H. J Häuselmann, M. Kraenzlin, K. Lippuner, M. Neff, P. Pancaldi, R. Rizzoli, F. Tanzi, R. Theiler, A. Tyndall, C. Wimpfheimer, P. Burckhardt.
References
1. Melton LJ 3rd (1995) How many women have osteoporosis now? J Bone Miner Res 10(2):175–177
2. Riggs BL, Melton LJ 3rd (1986) Medical progress series: Involutional osteoporosis. N Engl J Med 314:1676–1686
3. Riggs BL, Melton LJ 3rd (1995) The worldwide problem of osteoporosis: insights afforded by epidemiology. Bone 17(5 Suppl):505S–511S
4. Kelsey JL, Hoffman S (1987) Risk factors for hip fracture. N Engl J Med 316(7):404–406
5. Statistics NCfH (1986) Advance data from vital and health statistics: 1985 summary: national hospital discharge survey. US Public Health Service (PHS), Hyattsville, pp PHS 86–1250 6. Cummings SR, Kelsey JL, Nevitt MC et al. (1985) Epidemiology of
osteoporosis and osteoporotic fractures. Epidemiol Rev 7:178–208 7. Melton LJ 3rd, Riggs BL (1987) Epidemiology of age-related
fractures The osteoporotic syndrome: detection, prevention, and treatment. Grune & Stratton, New York, pp 45–72
8. Cummings SR, Black DM, Rubin SM (1989) Lifetime risks of hip, Colles’, or vertebral fracture and coronary heart disease among white postmenopausal women. Arch Intern Med 149 (11):2445–2448
9. Black DM, Cummings SR, Melton LJ, 3rd 1992 Appendicular bone mineral and a woman’s lifetime risk of hip fracture. J Bone Miner Res 7(6):639–646
10. Baudoin C (1997) [Fractures of the proximal femur. Epidemiology and economic impact]. Presse Med 26(3):1451–1456
11. Melton LJ 3rd (1996) Epidemiology of hip fractures: implications of the exponential increase with age. Bone 18(3 Suppl):121S–125S 12. Fisher ES, Baron JA, Malenka DJ et al (1991) Hip fracture incidence
and mortality in New England. Epidemiology 2(2):116–122 13. Sernbo I, Johnell O (1993) Consequences of a hip fracture: a
prospective study over 1 year. Osteoporosis Int 3(3):148–153 14. Wolinsky FD, Fitzgerald JF, Stump TE (1997) The effect of hip
fracture on mortality, hospitalization, and functional status: a prospective study. Am J Public Health 87(3):398–403
15. Cummings SR, Rubin SM, Black D (1990) The future of hip fractures in the United States. Numbers, costs, and potential effects of postmenopausal estrogen. Clin Orthop (252):163–166 16. IOF 2000 How fragile is her future? IOF Report
17. Siris ES, Brenneman SK, Barrett-Connor E et al (2006) The effect of age and bone mineral density on the absolute, excess, and relative risk of fracture in postmenopausal women aged 50–99: results from the National Osteoporosis Risk Assessment (NORA). Osteoporos Int:1–10
18. Hans D, Dargent-Molina P, Schott AM et al (1996) Ultrasonographic heel measurements to predict hip fracture in elderly women: the EPIDOS prospective study. Lancet 348(9026):511–514
19. Bauer DC, Gluer CC, Cauley JA et al (1997) Broadband ultrasound attenuation predicts fractures strongly and indepen-dently of densitometry in older women. A prospective study. Study of Osteoporotic Fractures Research Group. Arch Intern Med 157(6):629–634
20. Krieg MA, Comuz J, Ruffieux C et al (2004) [Role of bone ultrasound in predicting hip fracture risk in women 70 years or older: results of the SEMOF study and comparison with literature data]. Rev Med Suisse Romande 124(2):59–62
21. Gluer CC, Cummings SR, Bauer DC et al (1996) Osteoporosis: association of recent fractures with quantitative US findings. Radiology 199(3):725–732
22. Dargent-Molina P, Schott AM, Hans D et al (1999) Separate and combined value of bone mass and gait speed measurements in screening for hip fracture risk: results from the EPIDOS study. Epidemiologie de l’Osteoporose. Osteoporosis Int 9(2):188–192 23. Porter RW, Miller CG, Grainger D et al (1990) Prediction of hip
fracture in elderly women: a prospective study. Bmj 301 (6753):638–641
24. Garnero P, Dargent-Molina P, Hans D et al (1998) Do markers of bone resorption add to bone mineral density and ultrasonographic heel measurement for the prediction of hip fracture in elderly women? The EPIDOS prospective study. Osteoporosis Int 8(6):563–569
25. Schott AM, Hans D, Duboeuf F et al (2005) Quantitative ultrasound parameters as well as bone mineral density are better predictors of trochanteric than cervical hip fractures in elderly women. Results from the EPIDOS study. Bone 37(6):858–863 26. Dargent-Molina P, Piault S, Breart G (2003) A comparison of
different screening strategies to identify elderly women at high risk of hip fracture: results from the EPIDOS prospective study. Osteoporosis Int 14(12):969–977
27. Cummings SR, Nevitt MC, Browner WS et al (1995) Risk factors for hip fracture in white women. Study of Osteoporotic Fractures Research Group. N Engl J Med 332(12):767–773
28. De Laet CE, van Hout BA, Burger H et al (1997) Bone density and risk of hip fracture in men and women: cross sectional analysis. Bmj 315(7102):221–225
29. Hui SL, Slemenda CW, Johnston CC Jr (1988) Age and bone mass as predictors of fracture in a prospective study. J Clin Invest 81(6):1804–1809
30. Lauritzen JB, Schwarz P, McNair P et al (1993) Radial and humeral fractures as predictors of subsequent hip, radial or humeral fractures in women, and their seasonal variation. Osteoporosis Int 3(3):133–137
31. Bonjour JP, Schurch MA, Rizzoli R (1996) Nutritional aspects of hip fractures. Bone 18(3 Suppl):139S–144S
32. Dawson-Hughes B (1996) Calcium insufficiency and fracture risk. Osteoporosis Int 6(Suppl 3):37–41
33. Felson DT, Zhang Y, Hannan MT et al (1995) Alcohol intake and bone mineral density in elderly men and women. The Framing-ham Study. Am J Epidemiol 142(5):485–492
34. Law MR, Hackshaw AK (1997) A meta-analysis of cigarette smoking, bone mineral density and risk of hip fracture: recogni-tion of a major effect. Bmj 315(7112):841–846
35. NOF (1998) Osteoporosis review of the evidence for prevention, diagnosis, and treatment and cost-effectiveness analysis. Osteo-poros Int 8(Suppl 4):S1–S88
36. Espallargues M, Sampietro-Colom L, Estrada MD et al (2001) Identifying bone-mass-related risk factors for fracture to guide
bone densitometry measurements: a systematic review of the literature. Osteoporosis Int 12(10):811–822
37. Leslie WD, Metge C, Salamon EA et al (2002) Bone mineral density testing in healthy postmenopausal women. The role of clinical risk factor assessment in determining fracture risk. J Clin Densitom 5(2):117–130
38. Krieg MA, Cornuz J, Ruffieux C et al (2005) Non vertebral fracture risk in elderly women: a practical approach using heel bone ultrasound in association with other risk factors for osteoporosis ASBMR 39. Dargent-Molina P, Favier F, Grandjean H et al (1996) Fall-related
factors and risk of hip fracture: the EPIDOS prospective study. Lancet 348(9021):145–149
40. Krieg MA, Cornuz J, Ruffieux C et al (2003) Comparison of three bone ultrasounds for the discrimination of subjects with and without osteoporotic fractures among 7562 elderly women. J Bone Miner Res 18(7):1261–1266
41. Njeh C, Hans D, Fuerst T et al. Calcaneal quantitative ultrasound: water-coupled. Quantitative ultrasound: assessment of osteoporo-sis and bone status. In: Dunitz M (ed.), London:, pp 109–124 42. Krieg MA, Cornuz J, Ruffieux C et al (2006) Prediction of hip
fracture risk by quantitative ultrasound in more than 7000 Swiss women > or =70 years of age: comparison of three technologically different bone ultrasound devices in the SEMOF study. J Bone Miner Res 21(9):1457–1463
43. Durosier C, Hans D, Krieg MA et al (2006) Prediction and discrimination of osteoporotic hip fracture in postmenopausal women. J Clin Densitom 9(4):475–495
44. Hans D, Schott AM, Chapuy MC et al (1994) Ultrasound measurements on the os calcis in a prospective multicenter study. Calcif Tissue Int 55(2):94–99
45. Hans D, Hartl F, Krieg MA (2003) Device-specific weighted T-score for two quantitative ultrasounds: operational propositions for the management of osteoporosis for 65 years and older women in Switzerland. Osteoporosis Int 14(3):251–258
46. Gluer CC (2007) Quantitative Ultrasound-It is time to focus research efforts. Bone 40(1):9–13