ORIGINAL ARTICLE
Maturation of the limbic system revealed by MR FLAIR
imaging
Jacques Frédéric Schneider&Klara Vergesslich
Received: 20 September 2006 / Revised: 8 January 2007 / Accepted: 11 January 2007 / Published online: 27 February 2007 # Springer-Verlag 2007
Abstract
Background Cortical signal intensity (SI) of the limbic system in adults is known to be higher than in neocortical structures, but time-related changes in SI during childhood have not been described.
Objective To detect maturation-related SI changes within the limbic system using a fluid-attenuated inversion recovery (FLAIR) MR sequence.
Materials and methods Twenty children (10 boys, 10 girls; age 3.5–18 years, mean 11.2 years) with no neurological abnormality and normal MR imaging examination were retrospectively selected. On two coronal FLAIR slices, ten regions of interest (ROI) with a constant area of 10 mm2 were manually placed in the archeocortex (hippocampus), periarcheocortex (parahippocampal gyrus, subcallosal area, cingulate gyrus) and in the neocortex at the level of the superior frontal gyrus on both sides.
Results Significant SI gradients were observed with a higher intensity in the archeocortex, intermediate intensity in the periarcheocortex and low intensity in the neocortex. Signif-icant higher SI values in hippocampal and parahippocampal structures were detected in children up to 10 years of age. Conclusion These differences mainly reflected differences in cortical structure and myelination state. Archeocortical structures especially showed significant age-related intensi-ty progression suggesting ongoing organization and/or myelination until early adolescence.
Keywords Children . Brain . Maturation . MRI
Introduction
Since the introduction of the fluid-attenuated inversion recovery (FLAIR) sequence, numerous studies have dem-onstrated the superior sensitivity of this technique in showing pathological changes in cerebral white and grey matter over conventional T1- or T2-weighted images. The few studies in which the normal appearance of cortical structures has been investigated in healthy adult volunteers have shown a higher signal intensity (SI) of the limbic system relative to neocortical structures [1–4]. The limbic system encompasses mainly the embryological older archeocortex and the periarcheocortex arranged at the periphery [5–7].
The aim of our study was twofold: firstly, to determine if FLAIR imaging was able to detect SI differences within the limbic system, and secondly, to detect maturation-related SI alterations in cortices of different embryological origin.
Patients and methods
Twenty patients (10 boys, 10 girls; age 3.5–18 years, mean 11.2 years) with normal neurological examination and normal developmental milestones underwent cranial MR imaging (Picker 1.5 T, Marconi/Philips Medical System) including a FLAIR sequence that is part of our routine examination protocol. Patients were referred to our institu-tion for various reasons that included headaches (n=8), spinal malformations (n=6), and orofacial tumours (n=6). The cranial MR studies were retrospectively and indepen-dently reviewed by two neuroradiologists (J.F.S., K.V.) and deemed normal. The patients were divided into four groups according to age: group 1 five patients, mean age 4.5±
DOI 10.1007/s00247-007-0415-3
J. F. Schneider (*)
:
K. Vergesslich Department of Paediatric Radiology, University Children’s Hospital UKBB, Römergasse 8,Basel 4058, Switzerland
0.9 years; group 2 five patients, mean age 9.7±1 years; group 3 five patients, mean age 14±0.1 years; group 4 five patients, mean age 16.6±0.9 years.
Two slices at the level of the limbic system were obtained in the coronal plane, perpendicular to the bicommissural plane. Scan parameters were inversion time 1,900 ms, TR 7,800 ms, effective echo time 180 ms, matrix 198×256, FOV 240 mm, and slice thickness 4 mm.
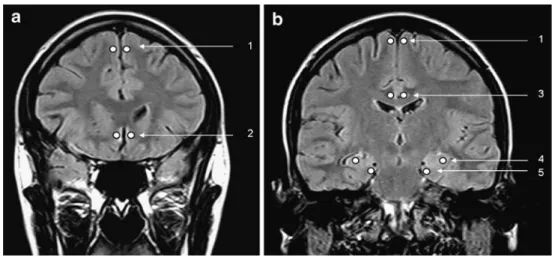
SIs were measured at the workstation using a“region of interest” (ROI) method which involved placing symmetri-cal ROIs of constant area (10 mm2) within the cortical ribbon of the following structures: hippocampal head, parahippocampal gyrus, subcallosal area, cingulate gyrus, superior frontal gyrus (Fig. 1). Mean SI and standard deviation (SD) values representing the SI of the cortex
compared with the attenuated cerebrospinal fluid (CSF) were obtained. Symmetrical left and right ROIs were measured separately. There was no statistically significant difference in the data obtained between left and right, so the results were averaged. There was also no statistically significant difference in the data obtained from the frontal cortex between the two slices, so these results were also averaged before further analysis.
Values from all regions were analyzed using a non-parametric rank-based Kruskal-Wallis test for multiple means comparisons. All group means were then compared pair-wise using a post hoc one-way ANOVA Tukey-Kramer HSD test. Statistical analysis was conducted with JMP software (JMP IN, version 5.1.2, SAS, Cary, N.C.). We considered P values <0.05 as statistically significant.
Fig. 1 Coronal FLAIR MR images. a First slice showing circles at the locations of the ROIs in the frontal isocortex (1) and subcallosal area cortex (2). b Second slice showing circles at the locations of the ROIs in the frontal isocortex (1), cingu-late gyrus cortex (3), hippocam-pus (4) and parahippocampal gyrus (5)
Fig. 2 Box plot illustrating SI values (all age groups con-founded) between the different cortical areas of the frontal iso-cortex (F), hippocampus (H), parahippocampal gyrus (PH), cingulate gyrus (CG) and sub-callosal area (SC). The limits of the boxes represent the lower quartile (25th percentile) and upper quartile (75th percentile); the height of the boxes is the interquartile range. The top and bottom whiskers are the maxi-mum and minimaxi-mum values. The line dividing the boxes is the median
Results
Mean SI values showed a homogeneous distribution within the ROIs with a low SD in all the examined regions. Within the same structures there was no significant difference between the right and left hemispheres. The hippocampal cortex showed the highest SI of all examined cortices (Fig. 2). There were no significant differences in SI between the three periarcheocortical structures (subcallosal area, cingulate gyrus, parahippocampal gyrus), and their SIs were significantly higher than those of the frontal neocortex and lower than those of the hippocampal cortex (Fig. 2). The frontal neocortex showed the lowest SI of all examined
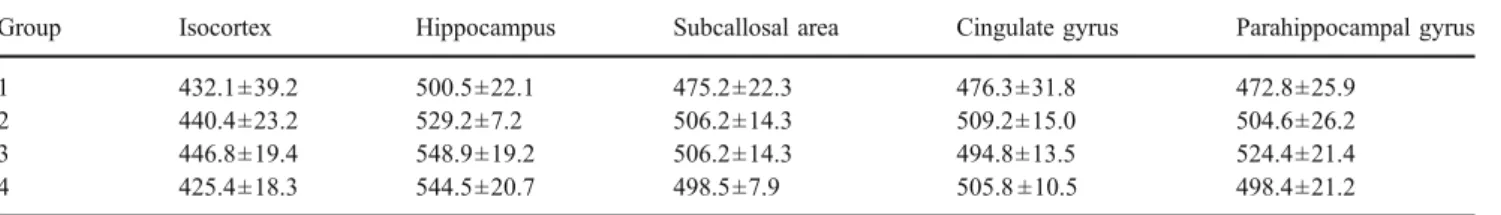
areas (Table1, Fig.2). Comparing the same cortical region between groups 1 and 4 (to evaluate changes during maturation), the SIs were significantly higher in group 4 than in group 1 for archeocortical structures (11% in the hippocampus) and periarcheocortical structures (16% in the cingulate gyrus, 18% in the parahippocampal gyrus, and 20% in the subcallosal area). The main differences in relation to maturity were seen between groups 1 and 3 for archeocortical structures and between groups 1 and 2 for periarcheocortical structures (Fig. 3). The SI of the para-hippocampal gyrus in group 4 was significantly higher than that in group 3. The SIs of the frontal neocortex were not significantly different between the age groups (Table1).
Table 1 SI values (means±SD) of all measured cortical areas in relation to age group
Group Isocortex Hippocampus Subcallosal area Cingulate gyrus Parahippocampal gyrus 1 432.1±39.2 500.5±22.1 475.2±22.3 476.3±31.8 472.8±25.9
2 440.4±23.2 529.2±7.2 506.2±14.3 509.2±15.0 504.6±26.2 3 446.8±19.4 548.9±19.2 506.2±14.3 494.8±13.5 524.4±21.4 4 425.4±18.3 544.5±20.7 498.5±7.9 505.8 ±10.5 498.4±21.2
Fig. 3 Box plot illustrating SI values in the four age groups (a–d groups 1–4, respectively) for the cortical areas hippocampus (H), parahippocampal gyrus (PH), cingulate gyrus (CG) and subcallosal area (SC). The limits of the box represent the lower quartile (25th
percentile) and the upper quartile (75th percentile); the height of the boxes is the interquartile range. The top and bottom whiskers are the maximum and minimum values. The line dividing the boxes is the median
Discussion
FLAIR imaging relies primarily on T2 weighting for image contrast although it has some T1 sensitivity. It uses a predefined inversion recovery time which nullifies the signal from the CSF. It is widely and routinely used for identifying abnormal areas of high SI in both the white and grey matter. Areas of pathological or defective myelination, as well as ischaemic or gliotic areas, are demarcated from normal tissue or adjacent fluid-filled cavities due to their intrinsically higher signal [2,7].
Hyperintensity of the limbic system compared to the neocortex has been described previously [3]. However, the principal finding of this study is a variation of SI within specific subgroups of limbic and paralimbic cortical territories. The archeocortex showed a higher SI than the periarcheocortex in all age groups. On the other hand, all areas within the periarcheocortex showed a comparable SI, probably reflecting their common embryological origin (Table 1, Fig. 2). A second major finding is that cortical maturation could only be detected in the cortex of the limbic system and was not observed in neocortical structures (Table2, Fig. 3). The major maturation process takes place during the first decade of life, as seen in the statistically significant difference in SI between groups 1 and 2 (Table2). The significantly higher SI in group 4 than in group 3, representing a late increase in SI, in the parahippocampal cortex remains unexplained (Table2).
Structural and architectonic specificity of the archeocor-tex and periarcheocorarcheocor-tex in comparison with neocortical structures may explain these differences in SI. A more primitive cellular organization with fewer than six neuronal layers, a different microvascularization pattern and, partic-ularly, a different myelin structure may be involved at a different level in each limbic and paralimbic region. Naidich et al. [8,9] have postulated that identifying a thick layer of myelinated fibres called the medullar superficial layer, which delimits the allocortical structures (the combi-nation of archeocortex and paleocortex), may allow differentiation between allo- and neocortical structures.
Other authors, however, have explained the higher SI in relation to the particular thickness and superficiality of this layer, ruling out a role of an eventual chemical shift or the effect of superficial vessels [3,6]. Limbic myelin, however, appears to be wrapped more loosely compared to neocor-tical myelin, thus allowing a higher concentration of water protons, and might, therefore, contribute to the higher SI observed [10].
Newer techniques based on diffusion tensor imaging have recently demonstrated that myelination of cerebral white matter is a process that continues during childhood much longer than previously thought, with subtle changes still being demonstrated in adolescence [11]. An equivalent myelination process in the limbic and paralimbic cortical pathways based on a different myelin structure may account for the progressively higher SI observed in this study, with adult levels of intensity being reached in early adolescence. A potential limitation of this study was the relatively small number of patients; the results should be validated in a larger cohort of subjects.
Conclusion
We have demonstrated that architectonic and embryolog-ical differences between the neocortex, archeocortex and periarcheocortex influence their characteristic SI as iden-tified on FLAIR imaging. Ongoing maturation and myelination of these distinct cortical subtypes, which persist until early adolescence, may accentuate these age-related differences in SI.
References
1. Bendersky M, Rugilo C, Kochen S et al (2003) Magnetic resonance imaging identifies cytoarchitectonic subtypes of the normal human cerebral cortex. J Neurol Sci 1–2:75–80
2. Hajnal JV, Bryant DJ, Kasuboski L et al (1992) Use of fluid attenuated inversion recovery (FLAIR) pulse sequences in MRI of the brain. J Comput Assist Tomogr 6:841–844
3. Hirai T, Korogi Y, Yoshizumi K et al (2000) Limbic lobe of the human brain: evaluation with turbo fluid-attenuated inversion-recovery MR imaging. Radiology 2:470–475
4. Murakami JW, Weinberger E, Shaw DW et al (1999) Normal myelination of the pediatric brain imaged with fluid-attenuated inversion-recovery (FLAIR) MR imaging. AJNR 8:1406–1411 5. Bronen RA (1992) Hippocampal and limbic terminology. AJNR
3:943–945
6. Kier EL, Fulbright RK, Bronen RA et al (1995) Limbic lobe embryology and anatomy: dissection and MR of the medial surface of the fetal cerebral hemisphere. AJNR 9:1847–1853 7. Parazzini C, Baldoli C, Scotti G et al (2002) Terminal zones of
myelination: MR evaluation of children aged 20–40 months. AJNR 10:1669–1673
Table 2 Intergroup analysis (statistical significance) of cortical SI values
Cortical structure Group 1 vs. 2 Group 2 vs. 3 Group 3 vs. 4 Hippocampus 0.002* 0.024* 0.690 Subcallosal area 0.020* 0.204 0.207 Cingulate gyrus 0.042* 0.316 0.074 Parahippocampal gyrus 0.005* 0.085 0.020* *P<0.05
8. Naidich TP, Daniels DL, Haughton VM et al (1987) Hippocampal formation and related structures of the limbic lobe: anatomic–MR correlation. Part II. Sagittal sections. Radiology 3:755–761 9. Naidich TP, Daniels DL, Haughton VM et al (1987) Hippocampal
formation and related structures of the limbic lobe: anatomic–MR correlation. Part I. Surface features and coronal sections. Radiology 3:747–754
10. Jackson GD, Kuzniecky RI, Cascino GD et al (1994) Hippocam-pal sclerosis without detectable hippocamHippocam-pal atrophy. Neurology 1:42–46
11. Schneider JF, Il’yasov KA, Hennig J et al (2004) Fast quantitative diffusion-tensor imaging of cerebral white matter from the neonatal period to adolescence. Neuroradiology 4:258– 266