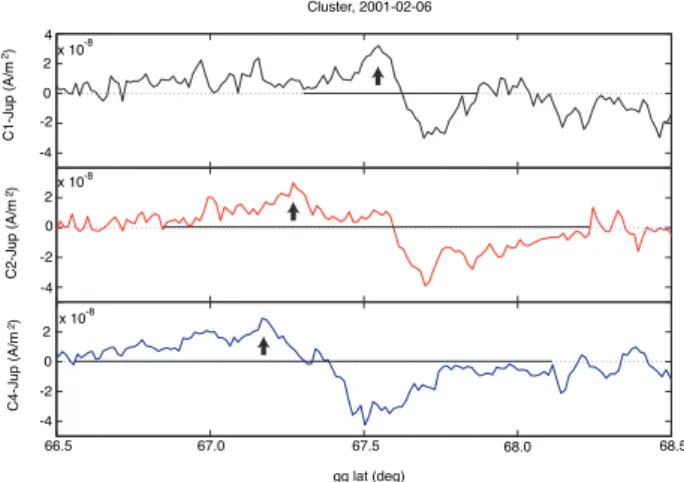
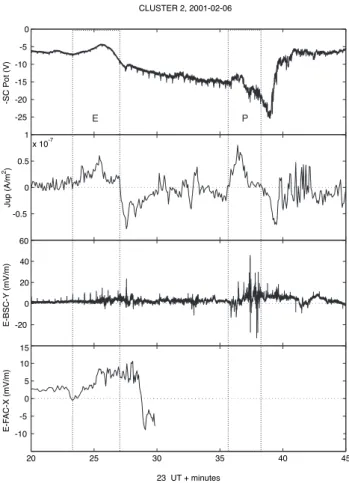
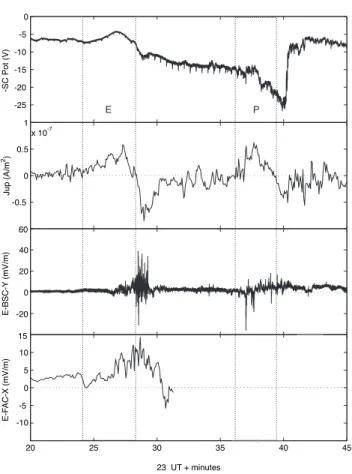
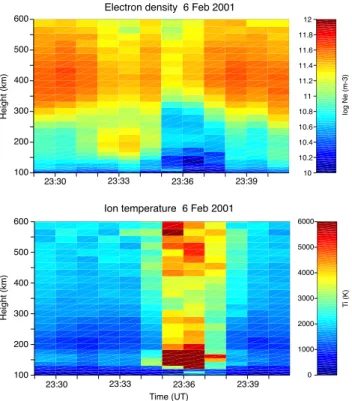
Temporal evolution of two auroral arcs as measured by the Cluster satellite and coordinated ground-based instruments
Texte intégral
Figure


Documents relatifs
Inhibition of autophagy by adding spautin 1 blocks apoptosis (Figure 1C), but also dramatically decreases the production of ROS in bystander cells cocultured with
Moreover, publications in the time interval between 2000 and 2008 were compared to publications in the time interval between 2009 and 2015; papers published in journals with high
The Hyuga tectonic mélange and the Foliated Morotsuka are metasedimentary units constituting the Shimanto accretionary prism (Japan). They were deformed at temperatures
Thus, the main ore genesis model for Ni ores in New Caledonia is based on a single per descensum model where most elements (Mg, Ni, and Si) are leached from the surface,
The first step taken in the design of the alpha prototype was to assign the different subsystems to the members of the product development team (PDT).. The main subsystems
Au sein des gasté- ropodes, on compte également des formes de grande taille, telles que les nérinées ou les ptérocères (10 cm et plus), ces derniers ayant encore des
Based on mantle circulation modeling and tectonic reconstructions, we surmise that the forces necessary to sustain slab-suction mountain building in those orogens derive,
Chen (2007), Slip rates on the Chelungpu and Chushiang thrust faults inferred from a deformed strath terrace along the Dungpuna river, west central Taiwan,
