HAL Id: hal-00298660
https://hal.archives-ouvertes.fr/hal-00298660
Submitted on 8 Mar 2006HAL is a multi-disciplinary open access
archive for the deposit and dissemination of sci-entific research documents, whether they are pub-lished or not. The documents may come from teaching and research institutions in France or abroad, or from public or private research centers.
L’archive ouverte pluridisciplinaire HAL, est destinée au dépôt et à la diffusion de documents scientifiques de niveau recherche, publiés ou non, émanant des établissements d’enseignement et de recherche français ou étrangers, des laboratoires publics ou privés.
Footprints of climate in groundwater and precipitation
A. Liebminger, G. Haberhauer, W. Papesch, G. Heiss
To cite this version:
A. Liebminger, G. Haberhauer, W. Papesch, G. Heiss. Footprints of climate in groundwater and precipitation. Hydrology and Earth System Sciences Discussions, European Geosciences Union, 2006, 3 (2), pp.271-283. �hal-00298660�
HESSD
3, 271–283, 2006 Footprints of climate in groundwater and precipitation A. Liebminger et al. Title Page Abstract Introduction Conclusions References Tables Figures J I J I Back Close Full Screen / EscPrinter-friendly Version Interactive Discussion Hydrol. Earth Syst. Sci. Discuss., 3, 271–283, 2006
www.hydrol-earth-syst-sci-discuss.net/3/271/2006/ © Author(s) 2006. This work is licensed
under a Creative Commons License.
Hydrology and Earth System Sciences Discussions
Papers published in Hydrology and Earth System Sciences Discussions are under open-access review for the journal Hydrology and Earth System Sciences
Footprints of climate in groundwater and
precipitation
A. Liebminger, G. Haberhauer, W. Papesch, and G. Heiss
Biogenetics – Natural Resources, Austrian Research Centers Seibersdorf, A-2444 Seibersdorf, Austria
Received: 16 January 2006 – Accepted: 4 February 2006 – Published: 8 March 2006 Correspondence to: G. Haberhauer ([email protected])
HESSD
3, 271–283, 2006 Footprints of climate in groundwater and precipitation A. Liebminger et al. Title Page Abstract Introduction Conclusions References Tables Figures J I J I Back Close Full Screen / EscPrinter-friendly Version Interactive Discussion
EGU
Abstract
In the last decades, the 18O/16O signature of meteoric water became a key tracer intensively used both in hydrology and in paleoclimatology, based primarily on the cor-relation of the18O/16O ratio in precipitation with temperature. This correlation with tem-perature is generally well understood as a result of Rayleigh processes of atmospheric
5
vapour during the formation of precipitation. The resulting isotopic signals in precip-itation are also transferred into the groundwater body since the isotopic composition of groundwater is determined by the precipitation infiltrating into the ground. However, the whole variability of the18O/16O ratio especially in temporal data series of precipi-tation and groundwater can not be explained with temperature alone. Here we show
10
for the first time that certain interactions between different climate induced changes in local parameters prevailing during precipitation events are responsible for the observed deviation. These effects are superimposed by an overall isotopic pattern representing the large scale climate input primarily based on temperature. The intense variability of isotopes due to the particular topography of Austria recorded over a time period of 40
15
years provides an unique possibility to uncover this hidden information contributed by relative humidity and type of precipitation. Since there is a growing need to predict the variation of climate together with its associated potential hazards like floods and dry periods the results of this work are contributing to a better overall understanding of the complex interaction of climate with the corresponding water cycle.
20
1 Introduction
It is of common understanding that isotopic depletion in atmospheric waters is based conceptually on a Rayleigh distillation process (Dansgaard, 1964; Clark and Fritz, 1997) describing the fractionation that differentiates the heavy and light molecules as to be strongly dependent on temperature. Although simple distillation models fail to
25
precipi-HESSD
3, 271–283, 2006 Footprints of climate in groundwater and precipitation A. Liebminger et al. Title Page Abstract Introduction Conclusions References Tables Figures J I J I Back Close Full Screen / EscPrinter-friendly Version Interactive Discussion tation it is found that there is indeed some correlation between the isotopic composition
of precipitation and the local temperature (Siegenthaler and Oeschger, 1980), but at all timescales examined a large part of the variance in the isotope data remains unex-plained. Typically only 20% of this isotope variance can be explained by temperature changes (Noone and Simmonds, 2002) and thus the accurate acquisition of
paleotem-5
perature from isotope data has been placed under scrutiny (Edwards and Wolfe, 1996; Jouzel et al., 1997).
Most of the research regarding the relationship between stable isotopes in meteoric waters and climatic parameters is dealing with model approaches based on physical and meteorological processes. These models take into account the complex
depen-10
dences of the (isotopic) composition of atmospheric vapor upon environmental condi-tions, such as the transport pathways and the source region conditions. On the other hand due to their wide scale such global circulation models (GCM) are consequently neglecting the influences on the final isotope concentration coming from the location of the precipitation event itself. To cope with that new models have been recently
15
developed mainly based on the local climatic conditions (Liebminger et al., 2006b). Moreover it has been shown that the spatial isotopic variability especially in alpine re-gions is to a large extent due to meteorological conditions prevailing at the sampling site (Liebminger et al., 2006a).
In general, groundwater values of δ18O (which are the per mille deviation of the
iso-20
tope ratio of the accepted standard, VSMOW – Vienna standard mean ocean water) are reflecting the volume-weighted mean of annual precipitation (Clark and Fritz, 1997). The amplitude of the isotopic signal in the groundwater becomes more and more atten-uated as the mean residence time (MRT) is increasing which therefore decreases the possibility to obtain climatic information from groundwater samples. Temporal changes
25
in the conditions affecting the δ18O of precipitation can therefore only be expected to be seen in groundwater of shorter MRTs.
HESSD
3, 271–283, 2006 Footprints of climate in groundwater and precipitation A. Liebminger et al. Title Page Abstract Introduction Conclusions References Tables Figures J I J I Back Close Full Screen / EscPrinter-friendly Version Interactive Discussion
EGU
2 Methods
The precipitation is collected on a daily basis in ombrometers (500 cm2) and mixed to monthly samples. Samples for this study were taken between 1961 and 2003. Anal-yses of oxygen 18 have been made by the isotope laboratories of Austrian Research Centers Seibersdorf (formerly Arsenal research). All together more than 16000
sam-5
ples were collected during this period. Climate data for this period were provided by Central Institute for Meteorology and Geodynamics, Vienna1, Auer et al. (2006)2 and Sch ¨oner (2004).
3 Results and discussion
In the following the results of an analysis of a unique dataset of almost 30 years
10
of monthly Vienna drinking water samples are presented together with temporal iso-topic precipitation data of the corresponding recharge area located in the Austrian Alps (Wildalpen). Figure 1a clearly shows an continuous increase of δ18O in the 1980s fol-lowed by an opposite trend from 1990 to 1996 within the drinking water samples. Since recharge is not a constant process over the whole season, i.e. there is less recharge
15
occurring during seasons of warmer temperatures and stronger plant growth due to en-hanced evapotranspiration, it is essential not to use the plain precipitation data from the
1
CD-ROM: Klimadaten von ¨Osterreich 1971–2000, Central Institute for Meteorology and Geodynamics, Vienna ZAMG 2002
2
Auer, I., B ¨ohm, R., Jurkovic, A., Lipa, W., Orlik, A., Potzmann, R., Sch ¨oner, W., Ungersb ¨ock, M., Matulla, C., Briffa, K., Jones, P., Efthymiadis, D., Bruntetti, M., Nanni, T., Maugeri, M., Mer-calli, L., Mestre, O., Moisselin, J. M., Begert, M., M ¨ullerwestermeier, G., Kveton, V., Bochnicek, O., Stastny, P., Lapin, M., Szalai, S., Szentimrey, T., Cegnar, T., Dolinar, M., Gajic-Capka, M., Zaninovic, K., Majstorovic, Z., and Nieplov, E.: HISTALP – Historical Instrumantal Climatolog-ical Surface Time Series of the Greater Alpine Region 1760–2003, Intern. J. Climat., revised version submitted, 2006.
HESSD
3, 271–283, 2006 Footprints of climate in groundwater and precipitation A. Liebminger et al. Title Page Abstract Introduction Conclusions References Tables Figures J I J I Back Close Full Screen / EscPrinter-friendly Version Interactive Discussion recharge area for comparison but to calculate an input function including an
appropri-ate recharge factor for this area. Figure 1b shows the input function for the concerned recharge area of the Vienna drinking water calculated according to Maloszewski and Zuber (1996) applying a sinusoidal fit for the recharge factor (McGuire et al., 2002). The temporal pattern found in the drinking water is also observed in the input
func-5
tion data whereas the summer months do not reflect the same trends (Fig. 1d). This observation is leading to the assumption that the colder months are main responsible for the observed pattern in the Vienna drinking water. The corresponding temperature data explains 27% (R2for Summer; p=0.006) to 32% (R2 for Winter; p=0.003) of the variance in the δ18O pattern whereas the peak in 1989/90 is also present within the
10
winter temperature data (Fig. 1c).
The δ18O fluctuations of precipitation correlate to a large extent (R2=34%; p=0.002) with those of the North Atlantic Oscillation (NAO) index, especially for the most extreme values during years 1989/90 and 1996 (Fig. 2a). The NAO has strong impacts on the mean wind speed and direction over the Atlantic and the heat and moisture transport
15
between the North Atlantic region and surrounding continents, especially Europe (Hur-rel et al., 2003). Since the NAO is particularly dominant in winter, average values of the December to March period are shown in the time series of Fig. 2. The ratio of snow to total precipitation (S/P) is a hydrologic indicator that like the NAO is sensitive to cli-mate variability and can be used to detect and monitor hydrologic responses to climatic
20
change (Huntington et al., 2004). Changes in S/P ratio over time could influence the magnitude and timing of spring runoff and recession to summer base flow. While the climate information within the NAO index is primarily determined at the source of the precipitation (Atlantic Ocean) the S/P ratio, although also mainly based on temperature changes, is potentially influencing the final composition of the precipitation due to
non-25
equilibrium fractionation taking place at the location of the precipitation event itself. The formation of snow as well as sub cloud evaporation processes are both considered to be kinetic processes shifting the final concentration of stable isotopes in precipitation to opposite directions (Liebminger et al., 2006a). Especially the non-equilibrium
fraction-HESSD
3, 271–283, 2006 Footprints of climate in groundwater and precipitation A. Liebminger et al. Title Page Abstract Introduction Conclusions References Tables Figures J I J I Back Close Full Screen / EscPrinter-friendly Version Interactive Discussion
EGU
ation during sub cloud evaporation processes of the falling rain drops plays a key role in governing higher δ18O values. At inter mountain valley stations where air masses ar-rive due to surrounding mountains at a high level above the ground and at large basins where convective movement of clouds due to higher temperatures is prevailing relative humidity which is mainly responsible for sub cloud evaporation is therefore of increased
5
importance. On the other hand, at locations in front of orographic barriers enhanced precipitation amounts are occurring which leads to a faster saturation of the ambient air during a precipitation event, thus limiting the effect of evaporation on the falling rain drop. As shown in Fig. 2b the S/P ratio is nearly in anti phase to the δ18O pattern indicating that higher δ18O values are prevailing when there is more rain among the
10
precipitation falling in the winter months (R2=29%; p=0.005). Considering a lower rel-ative humidity at these winter days with rain (Fig. 2c; R2=25%; p=0.010) δ18O values are definitely more influenced by sub cloud evaporation than at days with snowfall and higher relative humidity prevailing.
Figure 3a and b prove strong evidence of such local influences on the δ18O variation
15
as there are quite different isotopic trends despite of geographic proximity of the sam-ple locations Innsbruck (valley) and Patscherkofel (mountain) as well as quite similar trends at stations located in regions farther away but within a comparable landscape profile like Weyregg and Kufstein. For both examples the overall year to year δ18O variation remains quite similar overriding an essential part of the information which
20
does not come directly from temperature. In order to reveal this hidden part it is nec-essary to compare the δ18O data of interest to a different data set with lower or none dependence upon sub cloud evaporation. This is the case for the above mentioned val-ley/mountain example, because the influence of sub cloud evaporation at the summit of Patscherkofel (2245 m a.s.l.) is negligible. Another possibility is to compare δ18O with
25
δD since Deuterium will be enriched by a lesser extent during evaporation processes. Figure 3c and d clearly show a decrease of the relative difference between δ18O and δD over the last decades for sample stations Innsbruck and Kufstein manifested in a steeper slope of δ18O in comparison to δD clearly indicating that sub cloud evaporation
HESSD
3, 271–283, 2006 Footprints of climate in groundwater and precipitation A. Liebminger et al. Title Page Abstract Introduction Conclusions References Tables Figures J I J I Back Close Full Screen / EscPrinter-friendly Version Interactive Discussion has become of increased importance during the last 30 years.
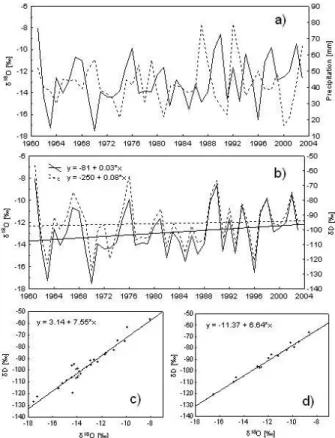
The above described effect is either enhanced or lowered by the amount of precipita-tion which is occurring during the events. Drizzle or very small rain drops are relatively more affected by sub cloud evaporation as heavy rain during storm events. Therefore smaller precipitation amounts have to be expected at times with higher δ18O values
5
and vice versa which is confirmed by Fig. 4a showing an example of Vienna precipita-tion records. From the local meteoric water lines (LMWL) drawn for this locaprecipita-tion for the time periods before 1989 (Fig. 4c) and after 1989 (Fig. 4d) it can be seen that the slope of the later values is significantly lower than that of the earlier values which is always a strong indicator of enhanced evaporation effects (Clark and Fritz, 1997).
10
4 Conclusion
We summarize that the isotopic composition of meteoric water is not only reflecting the influence of temperature but also that of local meteorological parameters which will definitely be of considerable interest for (paleo)climatic applications! Especially we show for the first time that younger groundwater due to special recharge
condi-15
tions is a potential reservoir of climate information bearing just more than temperature. A general overview over the processes described in this study is given in the sup-plement (http://www.hydrol-earth-syst-sci-discuss.net/3/271/hessd-3-271-sp.pdf). Al-though especially alpine regions are able to deliver a lot of different and representative sample sites future studies covering larger geographical areas will be necessary in
or-20
der to get more input on the extent of the obvious and hidden information within the stable isotopes variation in precipitation and groundwater.
Acknowledgements. We thank the Umweltbundesamt (Vienna) which is in charge of the ma-jority of the sampling stations. We are further grateful to the people of the “Bundesminis-terium f ¨ur Land- und Forstwirtschaft, Umwelt und Wasserwirtschaft, Abteilung VII/3 –
Wasser-25
HESSD
3, 271–283, 2006 Footprints of climate in groundwater and precipitation A. Liebminger et al. Title Page Abstract Introduction Conclusions References Tables Figures J I J I Back Close Full Screen / EscPrinter-friendly Version Interactive Discussion
EGU
(status: 05/2004) and to R. B ¨ohm from the Central Institute for Meteorology and Geodynamics, Vienna for his valuable input on climatology.
References
Clark, I. and Fritz, P.: Environmental Isotopes in Hydrogeology, Lewis Publishers, New York, pp. 328, 1997.
5
Dansgaard, W.: Stable isotopes in precipitation, Tellus, 16, 436–468 1964.
Edwards, T. W. D. and Wolfe, B. B.: Influence of Changing Atmospheric Circulation on Precip-itation δ18O – Temperature Relations in Canada during the Holocene, Quarterny Research, 46, 211–218, 1996.
Huntington, T. G., Hodgkins, G. A., Keim, B. D., and Dudley, R. W.: Changes in the Proportion
10
of Precipitation Occurring as Snow in New England (1949–2000), J. Climate, 17, 2626–2636, 2004.
Hurrell, J. W., Kushnir, Y., Ottersen, G., and Visbeck, M.: An Overview of the North Atlantic Oscillation, in: The North Atlantic Oscillation: climatic significance and environmental impact, edited by: Hurrell, J. W., Kushnir, Y., Ottersen, G., Visbeck, M., Geophys. Monograph, 134,
15
1–35, 2003.
Jouzel, J., Koster, R. D., Hoffmann, G., and Armengaud, A.: Model evaluations of the water isotope-climate relationships used in reconstructing paleotemperatures, Isotope Techniques in the study of enviromental change, IAEA-Keynote address, 485–502, 1997.
Liebminger, A., Haberhauer, G., Papesch, W., and Heiss G.: Correlation of the isotopic
com-20
position in precipitation with local conditions in alpine regions, J. Geophys. Res., 111(D5), D05305, doi:10.1029/2005JD006258, 2006a.
Liebminger, A., Haberhauer, G., Varmuza, K., Papesch, W., and Heiss G.: Modeling the oxygen 18 concentration in precipitation with ambient climatic and geographic parameters, Geophys. Res. Lett., 33, doi:10.1029/2005GL025049, 2006b.
25
Maloszewski, P. and Zuber, A.: Lumped Parameter Models for the Interpretation of Environmen-tal Tracer Data, Manual on Mathematical Models in Isotope Hydrology, International Atomic Energy Agency, Vienna, Austria, 9–58, 1996.
subsur-HESSD
3, 271–283, 2006 Footprints of climate in groundwater and precipitation A. Liebminger et al. Title Page Abstract Introduction Conclusions References Tables Figures J I J I Back Close Full Screen / EscPrinter-friendly Version Interactive Discussion
face waters using oxygen-18 fluctuations during drought conditions in the mid-Appalachians, J. Hydrol., 261, 132–149, 2002.
Noone, D. and Simmonds, I.: Associations between δ18O of Water and Climate Parameters in a Simulation of Atmospheric Circulation for 1979–95, J. Climate, 15, 3150–3169, 2002. Sch ¨oner, W.: The 2004-08 release of the HISTALP precipitation dataset in grid mode 1, Internal
5
project working paper of EC-project ALP-IMP, available on demand via the project website
http://www.zamg.ac.at/ALP-IMP, 2004.
Siegenthaler, U. and Oeschger, H.: Correlation of18O in precipitation with temperature and altitude, Nature, 285, 314–317, 1980.
HESSD
3, 271–283, 2006 Footprints of climate in groundwater and precipitation A. Liebminger et al. Title Page Abstract Introduction Conclusions References Tables Figures J I J I Back Close Full Screen / EscPrinter-friendly Version Interactive Discussion
EGU
Fig. 1. Time series of Vienna drinking Water and input factors at the recharge area. (a)
Monthly mean δ18O values of Vienna drinking water(b) Input function calculated from monthly
mean δ18O values of precipitation sampled at Wildalpen the recharge area for Vienna drinking Water;(c) Average air temperature data for winter months December to March measured at
Wildalpen;(d) Average δ18O values of precipitation for summer months June to August sam-pled at Wildalpen; For all plots low pass filters are applied (dashed lines).
HESSD
3, 271–283, 2006 Footprints of climate in groundwater and precipitation A. Liebminger et al. Title Page Abstract Introduction Conclusions References Tables Figures J I J I Back Close Full Screen / EscPrinter-friendly Version Interactive Discussion
Fig. 2. Comparison time series for δ18O values of precipitation sampled at Wildalpen (full lines) together with climate time series (dashed lines) averaged for winter months December to March(a) Comparison with NAO Index; (b) Comparison with snow to precipitation ratio (S/P); (c) Comparison with relative humidity calculated as a relative deviation from the long term mean
HESSD
3, 271–283, 2006 Footprints of climate in groundwater and precipitation A. Liebminger et al. Title Page Abstract Introduction Conclusions References Tables Figures J I J I Back Close Full Screen / EscPrinter-friendly Version Interactive Discussion
EGU
Fig. 3. Comparison time series for different locations in δ18O and δD. (a) δ18O values of precipitation sampled at Innsbruck (full line) and Patscherkofel (dashed line). The mountain sample station Patscherkofel at an altitude of 2245 m a.s.l. is located within 10 km of geographic proximity to the city of Innsbruck (577 m a.s.l.) in the deep inner alpine “Inn-valley”. (b) δ18O values of precipitation sampled at Weyregg (full line) and Kufstein (dashed line). Both sample stations are located on the northern border of the Alps but at a lateral distance of more than 150 km.(c) δ18O (full line) and δD (dashed line) trends for Innsbruck;(d) δ18O (full line) and δD (dashed line) trends for Kufstein. All time series represent average values for winter season.
HESSD
3, 271–283, 2006 Footprints of climate in groundwater and precipitation A. Liebminger et al. Title Page Abstract Introduction Conclusions References Tables Figures J I J I Back Close Full Screen / EscPrinter-friendly Version Interactive Discussion
Fig. 4. Influences on stable isotopes in Vienna precipitation. (a) Comparison time plot for δ18O values of precipitation (full line) and amount of precipitation (dashed line) sampled at Vienna Hohe Warte;(b) δ18O (full line) and δD (dashed line) trends for Vienna;(c) Plot of the Vienna
local meteoric water line for δ18O and δD representing the winter months of the years 1961 to 1989;(d) Plot of the Vienna local meteoric water line for δ18O and δD representing the winter months of the years 1989 to 2003.