HAL Id: hal-00298700
https://hal.archives-ouvertes.fr/hal-00298700
Submitted on 31 Aug 2005HAL is a multi-disciplinary open access
archive for the deposit and dissemination of sci-entific research documents, whether they are pub-lished or not. The documents may come from teaching and research institutions in France or abroad, or from public or private research centers.
L’archive ouverte pluridisciplinaire HAL, est destinée au dépôt et à la diffusion de documents scientifiques de niveau recherche, publiés ou non, émanant des établissements d’enseignement et de recherche français ou étrangers, des laboratoires publics ou privés.
Evapotranspiration computed by Darcy?s Law: Sudan
case study
O. A. E. Abdalla
To cite this version:
O. A. E. Abdalla. Evapotranspiration computed by Darcy?s Law: Sudan case study. Hydrology and Earth System Sciences Discussions, European Geosciences Union, 2005, 2 (4), pp.1787-1806. �hal-00298700�
HESSD
2, 1787–1806, 2005 Evapotranspiration computed by Darcy’s Law O. A. E. Abdalla Title Page Abstract Introduction Conclusions References Tables Figures J I J I Back Close Full Screen / EscPrint Version Interactive Discussion
EGU
Hydrol. Earth Sys. Sci. Discuss., 2, 1787–1806, 2005 www.copernicus.org/EGU/hess/hessd/2/1787/
SRef-ID: 1812-2116/hessd/2005-2-1787 European Geosciences Union
Hydrology and Earth System Sciences Discussions
Papers published in Hydrology and Earth System Sciences Discussions are under open-access review for the journal Hydrology and Earth System Sciences
Evapotranspiration computed by Darcy’s
Law: Sudan case study
O. A. E. Abdalla
Earth Science Dept., College of Science, Sultan Qaboos University, P.O. Box 36, Al-Khod P.C. 123, Oman
Received: 26 July 2005 – Accepted: 19 August 2005 – Published: 31 August 2005 Correspondence to: O. A. E. Abdalla ([email protected])
HESSD
2, 1787–1806, 2005 Evapotranspiration computed by Darcy’s Law O. A. E. Abdalla Title Page Abstract Introduction Conclusions References Tables Figures J I J I Back Close Full Screen / EscPrint Version Interactive Discussion
EGU
Abstract
The present study applies Darcy’s Law to compute evapotranspiration in the arid to semi-arid central Sudan. The average decline in groundwater level (s) along a dis-tance (L) of the aquifer’s cross section was calculated. Such decline is a function of discharge Q at any point across the unit width of the aquifer and effective porosity.
5
Groundwater in the study area generally flows from NW to the SE along basin axial trough and is characterized by variable hydraulic gradient. As the aquifer discharge is directly proportional to the gradient, different values of groundwater level decline were calculated along the flow direction.
The hydrogeological map constructed during this study indicates that the system
10
is hydrologicaly closed and groundwater doesn’t discharge in the neighboring White Nile River. Geological, hydrological and climatological settings of the discharge area demonstrate that evapotranspiration is the main mechanism of groundwater discharge and reveals that the area is suited for the application of Darcy’s Law to compute evap-otranspiration.
15
Evapotranspiration was estimated from Darcy’s law to be 1.2 mm/a and is sufficient to balance the present system. Greater similarity in geology, hydrology, climate and vegetation encourages the application of Darcy’s Law in the Sahara and sub-Sahara to compute for evapotranspiration. Such cost effective method can be applied in arid to semi-arid areas if conditions are favorable.
20
1. Introduction
Evapotranspiration is the primary ground water discharge mechanism that seems to be of vital importance in arid to semi-arid areas as it appeared to have played a major role in ground water depletion in the Saharan and sub-Saharan Africa including Su-dan (Kontny, 1993; Heinl et al., 1993; Abdalla, 2000). Central SuSu-danese Rift Basins
25
HESSD
2, 1787–1806, 2005 Evapotranspiration computed by Darcy’s Law O. A. E. Abdalla Title Page Abstract Introduction Conclusions References Tables Figures J I J I Back Close Full Screen / EscPrint Version Interactive Discussion
EGU
regions and they represent one of the vast arenas in which ground water discharge takes place through evapotranspiration (EL Tohami, 1978; Heinl et al., 1993; Salama, 1997; Abdalla, 2000). These rift basins exhibit closed hydrologic systems in which ground water flow eventually forms hydraulic head closures lower than the head in the neighboring surface water bodies. Such hydrogeological setting eliminates the
likeli-5
hood that the hydraulic gradient is of a residual (paleo) nature. Therefore, it can be concluded that ground water discharge is limited to evapotranspiration. There exist high concentrations of Acacia species, which are the dominant trees in those areas, and also the increase of salinity characterizes areas of discharge (Salama, 1997; Ab-dalla, 2000). The precise determination of the ground water uptake by plants is a
10
long-term study that requires financial support beyond the capabilities of the African Countries. Methods estimating and evaluating the uptake of ground water from trees have been developed and implemented but are expensive (Hatton et al., 1990; Far-rington et al., 1989, 1992, 1994; Salama et al., 1997). As a consequence of financial constraints cheaper, though less precise, methods have to be developed to enhance
15
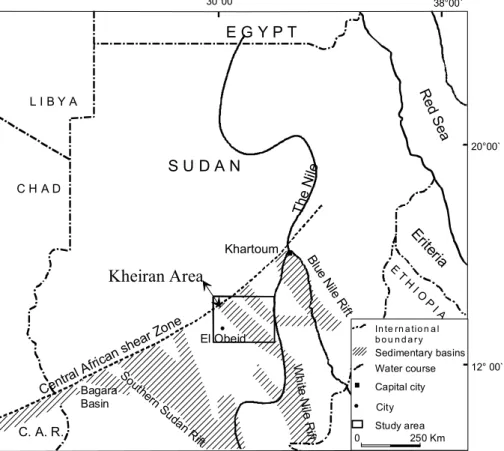
such estimation in African Countries. Hence, this paper applies Darcy’s Law and aims at determining the evapotranspiration value in a selected part of Central Sudanese Rift System. The selected area is bounded by longitudes 30◦000E and 32◦300E, and lati-tudes 12◦300N and 14◦150N and lies in west-central Sudan (Fig. 1) and extends west of the White Nile covering an area of approximately 60 000 km2(Fig. 1).
20
2. Geology and hydrogeology
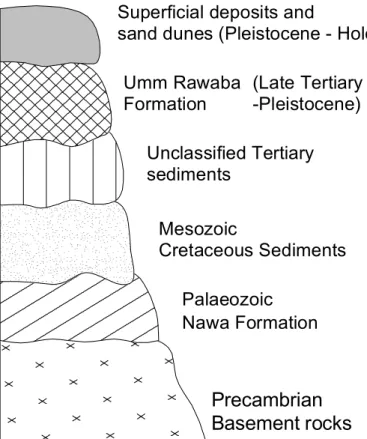
The study area encompasses the Bara and Kosti Basins and is characterized by vari-able sedimentary thickness that sometimes exceeds 3000 m. These basins are elon-gated NW–SE and are bounded by deep faults. They represent the most northern extensions of the White and Blue Nile Rift Systems (Fig. 1). The geological succession
25
varies between late Jurassic-Early Cretaceous to Recent sediments (Fig. 2).
HESSD
2, 1787–1806, 2005 Evapotranspiration computed by Darcy’s Law O. A. E. Abdalla Title Page Abstract Introduction Conclusions References Tables Figures J I J I Back Close Full Screen / EscPrint Version Interactive Discussion
EGU
Formation form the main aquifer system. This aquifer lies under semi-confining con-ditions and is separated from the overlying sand dunes by a clay-rich layer that varies in thickness and clay content. The hydraulic conductivity shows considerable variation within the aquifer. However, it averages for 6.8×10⁻⁶m/s while the storage coefficient is found to be 1.7×10⁻⁴. The mean aquifer thickness is 150 m. Ground water generally
5
flows along the axial trough of the Bara and Kosti Basins from the Northwest to the Southeast and is characterized by variable hydraulic gradient. The hydraulic gradient is steeper in the North and becomes less steep towards the South. Ground water velocities are decreasing southward and amount to few meters per year.
The hydrologic system in the study area was saturated 1500–2000 years B.P. when
10
the last humid period that occurred in the area had terminated (Adamson et al., 1980). The present arid conditions have then followed and resulted in a continuous ground wa-ter depletion that caused the deepening of the static wawa-ter level, which ranges between 10 to 100 m below ground surface (bgs). The depth to the water level is shallower in the Northwest at Kheiran area and deeper towards the South. Steady state flow conditions
15
have been currently reached as indicated by the ground water flow simulation carried out by Abdalla (2000).
The climate is a semi-arid with rainfall ranges between 200 mm/a in the North to 450 mm/a in the South. Temperature varies between 46◦C in the summer to 10◦C in the winter and averages 27◦C.
20
3. Theory and discussion
The hydrogeological map of the study area (Fig. 3) has been prepared after execution of a field study of the area. The map reveals that ground water flow is taking place along and parallel to the main axial troughs of the Bara and Kosti Basins forming two major flow components. In the Bara Basin, it flows from the extreme northwestern part
25
(the Kheiran area west of Bara) towards the SE and ESE. It also flows from the extreme northwestern part of the Kosti Basin to the South and Southeast.
HESSD
2, 1787–1806, 2005 Evapotranspiration computed by Darcy’s Law O. A. E. Abdalla Title Page Abstract Introduction Conclusions References Tables Figures J I J I Back Close Full Screen / EscPrint Version Interactive Discussion
EGU
The highest hydraulic head is recorded at the Kheiran (480 m), whereas the lowest (345 m) is found at the most southeastern part and is enclosed by a circular 350 m ground water contour line, which forms a hydrologic trough that is elongated parallel to the White Nile (Fig. 4). The ground water flow terminates at this trough and no further flow to the South could be recorded. This closure marks the area of ground
5
water discharge that most probably takes place by evapotranspiration. The topograph-ical elevations in this area average 390 m a.s.l., which makes a total difference of 40 m from the static water level (water table surface is 350 m). This 40 m difference repre-sents the average depth to the static water level. Should evapotranspiration be capa-ble of pumping water from this great depth, a low value of absolute
evapotranspira-10
tion is more likely. Ground water discharge by evapotranspiration seems to be active at depths greater than 30 m, which is previously suggested by some authors (Vrbka, 1996; Kontny, 1993). Christman et al. (1987) explained that evaporation could reach depths of up to 100 m but with less effectiveness.
The study area is covered by different species of Acacia, whose roots are known
15
to go deep and in some occasions exceed 60 m (Canadell et al., 1996; De Vries et al., 2000). Depending on the availability of water, these trees can therefore take their demand from the unsaturated and/or saturated zone as they are characterized by both shallow and deep rooting systems. The deep roots will stay immediately above the static water level as trees die if they reach the static water level. They receive their
20
water supply from the saturated deep zone through the uprising of ground water into the vadose zone by the capillary fringes.
In reality, the area of the hydrologic trough is characterized by relatively higher rain-fall (450 mm/a) and more clayey soil compared to the northern part. That is to say, water from the unsaturated zone is available for trees during humid months that occur
25
from July to September. Nevertheless, the high value of potential evapotranspiration (2500 mm/a) in addition to a long dry period (October–June) do not allow for water storage within the soil to supply the trees for the whole year. Therefore, trees will take their water demand from the saturated zone during drought, which takes place yearly
HESSD
2, 1787–1806, 2005 Evapotranspiration computed by Darcy’s Law O. A. E. Abdalla Title Page Abstract Introduction Conclusions References Tables Figures J I J I Back Close Full Screen / EscPrint Version Interactive Discussion
EGU
in some months, and during some infrequent years every few decades.
The general NW–SE ground water flow in the area is characterized by different hy-draulic gradient along both basins. The gradient is steep, moderate and gentle in the Northwest, Central and South and Southeast respectively (Fig. 3). Three different hy-draulic gradients are recorded in the Kosti, while four are encountered in the Bara
5
Basin. This variation in the hydraulic gradient enabled the subdivision of the system into different hydraulic zones shown in Fig. 3. Bara Basin has been subdivided into four zones named: zone 1, zone 2, zone 3, and zone 4; while Kosti Basin is subdivided into three zones called zone a, zone b, and zone c (Fig. 3). In the Kosti Basin ground water flows from the NW to the SE along the basin axis up to the area of Khor Abu Habil,
10
where it flows to the South to join the flow from the Bara Basin at point s3, at the center of the hydrologic trough. The hydraulic head inside this trough is always below 350 m.
The flow along the axial troughs of both basins is illustrated in Figs. 5 and 6, which are hydrogeological cross sections along the axial troughs of the Bara and Kosti Basin respectively. The total length of the flow amounts to about 333 and 242 km. for the
15
Bara and Kosti Basin respectively, while the length of the flow in each zone is denoted by capital letter L (Figs. 5 and 6). Due to the variation in the hydraulic gradient, the estimation of the discharge and decline in the groundwater level was carried out for each zone independently. Each zone represents an independent hydrologic system in which recharge occurs as subsurface inflow from the previous zone and discharge
20
takes place as subsurface outflow to the next zone and as evapotranspiration as well. Evapotranspiration is assumed to contribute to the discharge mechanism in each zone independently. The subsurface natural discharge and the evapotranspiration causes drop in the static water level which leads to the deepening of that level to reach some-times 100 m bgs in some areas. This static water level deepening has been taking
25
place for long time (1500–2000 year B.P.). It is an exponential drop that is reduced with time till the hydrologic system achieves the steady state conditions whereby inflow and outflow are equal. The discharge mechanisms that might have been previously prevail-ing (mainly natural discharge into the White Nile) are now limited to evapotranspiration
HESSD
2, 1787–1806, 2005 Evapotranspiration computed by Darcy’s Law O. A. E. Abdalla Title Page Abstract Introduction Conclusions References Tables Figures J I J I Back Close Full Screen / EscPrint Version Interactive Discussion
EGU
and natural subsurface outflow. The effect of the present artificial discharge is almost negligilble, as the total volume of extracted water does not exceed 2×10⁵m3/day and is concentrated in the northern part (Abdalla, 2000). The number of boreholes drilled in the southeast is very limited as the ground water is saline and there is adequate surface water supply. Hence, the amount of the present ground water discharge is
re-5
duced compared to the past and therefore the expected decline in the static water level is minimum. The current decline in the groundwater level consequent to the natural discharge could be computed from Darcy’s law under the following assumptions:
– Ground water flow is unidirectional. That is to say, ground water flows only along
and parallel to the cross section (Figs. 5 and 6). The ground water flow direction
10
in the study area shows reasonable parallelism indicated by Fig. 3.
– No ground water recharge is taking place from direct infiltration. The rainfall in
the study area ranges between 200 to 450 mm/a and is restricted to 3 months in the year (Summer time). Direct infiltration of rainwater into the aquifer at the area of the hydrologic trough is unlikely as the static water is deeper (40 m), the
15
soil is clayey and the daily temperature during rainy season is higher. Recharge occurs only along the northern edge of the basins subsequent to storm events and through drainage basins disappearing beneath the sand dunes in the northern part (Abdalla, 2000).
According to Darcy’s law, the constant discharge Q at any point across the aquifer of
20
unit width equals:
Q= K.I.b , (1)
where, b represents the thickness of the aquifer, K is the hydraulic conductivity and I is the gradient.
The average decline in groundwater level (s) along a distance L of unit width of the
25
aquifer cross sections (Figs. 5 and 6) can be calculated:
HESSD
2, 1787–1806, 2005 Evapotranspiration computed by Darcy’s Law O. A. E. Abdalla Title Page Abstract Introduction Conclusions References Tables Figures J I J I Back Close Full Screen / EscPrint Version Interactive Discussion
EGU
where, neis the effective porosity.
The hydraulic gradient (I) is calculated from the hydrogeological map (Fig. 3) for all zones to be I1=3.0×10⁻³, I2=8.4×10⁻⁴, I3=1.4×10⁻⁴, I4=1.0×10⁻⁴, Ia=3.6×10⁻⁴,
Ib=1.4×10⁻⁴and Ic=7×10⁻⁴.
Aquifer’s thickness examined during this study from the borehole data of over 500
5
wells is in agreement with the previous hydrogeological investigations conducted in the area (Geotehnika, 1985, 1988; IFAD, 1993; Rodis et al., 1965; Abdalla, 2000) which assumed 150 m as an average thickness of the aquifer although some variations are observed. This average thickness value is apparently true in the whole area except west of Kosti (at zone 4) where drilling showed that aquifer thickness averages only
10
70 m.
The effective porosity of the deep aquifer could not be determined during this study as no core samples were available. The average effective porosity value (10%) that has been implemented in the following calculations is based mainly on previous estimations cited in Abdel Salam, 1966; El Boushi et al., 1982; El Tohami, 1978; Thorweihe, 1982;
15
Heinl et al., 1993; Kheir, 1986; Vrbka, 1996; and Abdalla, 2000.
The hydraulic conductivity (K ) varies significantly from one zone to another. It has been calculated during this study from several pumping tests available in the database of the Natural Corporation of Rural Water Development (NCRWD). Representative mean hydraulic conductivity, is estimated to be 4.0×10⁻⁵m/s for zone 1, 1.5×10⁻⁶m/s
20
for zones 2 and 3, and 1.0×10⁻⁵m/s for zone 4, while it is estimated to be 8.0×10⁻⁷m/s for zones a and b, and 1.5×10⁻⁶m/s for zone c.
Based on the above mentioned values for I, K and ne the amount of the subsurface flow (Q) and decline in groundwater (s) along each zone is calculated, first for the Bara Basin and next for Kosti Basin, according to Eqs. (1) and (2).
HESSD
2, 1787–1806, 2005 Evapotranspiration computed by Darcy’s Law O. A. E. Abdalla Title Page Abstract Introduction Conclusions References Tables Figures J I J I Back Close Full Screen / EscPrint Version Interactive Discussion
EGU
3.1. Bara Basin
The amount of the flow (Q) along the different zones in Bara Basin was found to be:
Q1= 3.0 × 10−3× 4.0 × 10−4× 150= 1.8 × 10⁻⁵m3/s= 1.56 m2/day Q2= 8.4 × 10−4× 1.5 × 10−6× 150= 1.9 × 10⁻⁷m3/s= 1.6 × 10⁻² m2/day Q3= 1.4 × 10−4× 1.5 × 10−6× 150= 3.2 × 10⁻⁸m3/s= 2.7 × 10⁻³ m2/day
5
Q4= 1.0 × 10−4× 4.0 × 10−5× 70= 2.8 × 10⁻⁷m3/s= 2.4 × 10⁻² m2/day
The values Q1, Q2 and Q3 represent the subsurface outflow from the aquifer, while
Q4represents the subsurface inflow from the White Nile into the aquifer (Fig. 3). The length of the flow along the different zones in the Bara Basin is found to be:
L1=52.6 km, L2=96.1 km, L3=118.4 km and L4=66 km. Hence, the average decline in
10
groundwater level s has been calculated on the basis of Eq. (2) to be:
s1= 1.56/(0.1 × 52.6 × 103)= 2.97 · 10−4m/day= 108.3 mm/a
s2= 1.6 × 10⁻²/(0.1 × 96.1 × 103)= 1.67 × 10⁻⁶ m/day= 0.608 mm/a
s3= 2.7 × 10⁻³/(0.1 × 118.4 × 103)= 2.30 × 10⁻⁷m/day= 0.083 mm/a
s4= 2.4 × 10⁻²/(0.1 × 66.0 × 103)= 3.67 × 10⁻⁶ m/day= 1.330 mm/a
15
The average groundwater decline in zone 4 represents a residual decline whereby water level rises along a distance L4 (66 km) instead of falling. This is because Q4 represents an inflow from the White Nile rather than outflow from the hydrologic system. Thus, at the point s3 (Fig. 3) where zones 3 and 4 terminate, ground water surplus is indicated (as 1.33–0.083=1.247 mm/a). This is valid under the condition that no other
20
HESSD
2, 1787–1806, 2005 Evapotranspiration computed by Darcy’s Law O. A. E. Abdalla Title Page Abstract Introduction Conclusions References Tables Figures J I J I Back Close Full Screen / EscPrint Version Interactive Discussion
EGU
the hydrologic trough where the main ground water discharge by evapotranspiration seems to take place. But the system is known to be under equilibrium conditions (Abdalla, 2000), which indicates that the 1.25 mm/a could be the possible amount of evapotranspiration in the specified area to balance the system if ground water flow from Kosti Basin is neglected.
5
3.2. Kosti Basin
On the basis of Eqs. (1) and (2) the groundwater discharge (Q) and level decline (s), have been calculated from the cross section in Fig. 6 for the Kosti Basin provided that the length of flow along zone a, b, and c corresponds to 97, 75, and 70 km, respectively:
Qa= 3.6 × 10−4× 8 × 10−7× 150= 3.7 × 10⁻³ m2/day 10 Qb= 1.4 × 10−4× 8 × 10−7× 150= 1.5 × 10⁻³ m2/day Qc= 7 × 10−5× 1.5 × 10−6× 150= 1.4 × 10⁻³ m2/day sa= 4.3 × 10⁻⁸/(0.1 × 97 × 103)= 4.4 × 10⁻¹²m/s= 0.140 mm/a sb= 1.7 × 10⁻⁸/(0.1 × 75 × 103)= 2.3 × 10⁻¹²m/s= 0.073 mm/a sc= 1.6 × 10⁻⁸/(0.1 × 70 × 103)= 2.3 × 10⁻¹²m/s= 0.073 mm/a 15
The evapotranspiration seems to be active in the whole area with emphasis on the area of the hydrologic trough. The absolute amount of the evapotranspiration (E ) at point s3 should be in equilibrium with the recharge as subsurface inflow from zones 3, 4 and c to achieve the steady state flow conditions. Therefore, the value of evapotranspiration at the hydrologic trough could be estimated from the decline in the groundwater level
20
values obtained in the two cross sections (Figs. 5 and 6). This value was estimated at point s3to be:
HESSD
2, 1787–1806, 2005 Evapotranspiration computed by Darcy’s Law O. A. E. Abdalla Title Page Abstract Introduction Conclusions References Tables Figures J I J I Back Close Full Screen / EscPrint Version Interactive Discussion
EGU
where the values in brackets are the groundwater declines along zone 3 and zone c, while the first value is the expected rise of the water level along zone 4. This is calculated under the assumption that the flow is taking place only along the cross sections and each zone represents an independent hydrologic system. This value (1.2 mm/a) could be generalized to indicate the absolute value of evapotranspiration
5
in the study area. It may also indicate the value of the ground water consumption by
Acacia trees in the discharge areas around the Central Sudanese Rift Basins.
The application of Darcy’s law to estimate absolute evapotranspiration faces some constrains. Unidirectional flows do not commonly occur in the nature as anisotropy is very common in several aquifers. Therefore, the consideration of the general flow
10
direction and assumption of the parallelism of this flow ignores the local flows and produces errors in the calculation of the natural discharge Q. Aquifer heterogeneity represents another constrain as it affects the value of the hydraulic conductivity (K ).
K value should be representative and errors in the estimation of the K result in errors
in s. The assumption of no recharge is taking place by direct infiltration is valid only
15
in arid to semi-arid areas which restricts the application of this method to those areas. The Saharan and sub-Saharan African countries represent the most suitable areas as geological, hydrological and climatological conditions of those areas are characterized by remarkable regional similarities. The type, density and distribution of vegetation cover on the other hand are quite similar across the region. Those countries are also
20
suffering financial limitations that make relying on the less expensive method of com-puting evapotranspiration, like the current one, more favored. Nonetheless, in these areas studies on recharge should be taken before the application of this method.
4. Conclusions
Darcy’s law can be used in estimating the absolute evapotranspiration in arid to
semi-25
arid areas where no other discharge mechanism is prevailing. This will be successfully achieved if no direct infiltration occurs and the ground water flow is more or less
unidi-HESSD
2, 1787–1806, 2005 Evapotranspiration computed by Darcy’s Law O. A. E. Abdalla Title Page Abstract Introduction Conclusions References Tables Figures J I J I Back Close Full Screen / EscPrint Version Interactive Discussion
EGU
rectional.
Acknowledgements. Thanks are due to the German Academic Exchange Services (DAAD) for the financial support all over the period of the study. I am greatly indebted to the NCRWD offices in Khartoum and El Obeid for providing the data and the thorough discussion and motivation.
References
5
Abdalla, O. A. E.: Groundwater Hydrology of the west-central Sudan, Verlag Dr. Koster, Berlin Germany, ISBN 3-89574-364-X, 2000.
Abdel Salam, Y.: The ground water geology of the Gezira. M.Sc. thesis, Department of Geology, University of Khartoum, Khartoum, Sudan, 1966.
Adamson, D. A., Gasse, F., Street, F. A., and Williams, M. A. J.: Late Quaternary history of the
10
Nile, Nature, 288, 50–55, 1980.
Canadell, J., Jakson, R. B., Ehleringer, J. R., Mooney, H. A., Sala, O. E., and Schulze, E. D.: Maximum rooting depth of vegetation types at the global scale. Oecologia, 108, 583–595, 1996.
De Vries, J. J., Selaolo, E., and Beekman, H. E.: Groundwater recharge in the Kalahari, with
15
reference to paleo-hydrologic conditions, J. Hydrol., 238, 110-123, 2000. 110-123
El Boushi, I. M. and Abdel Salam, Y.: Stratigraphy and ground water geology of the Gezira, in: A land between two Niles, edited by: Williams, M. A. J. and Adamson, D., Rotterdam, Balkema, 65–80, 1982.
El Tohami, M. S.: Geology and hydrogeology of Baggara Basin, Sudan, Ph.D. thesis,
Depart-20
ment of Geology, London University, London, United Kingdom, 1978.
Farrington, P., Greenwood, E. A. N., Bartel, G. A., Beresford, J. D., and Watson, G. D.: Evapo-ration from Banksia woodland on a ground water mound, J. Hydrol., 105, 173–186, 1989. Farrington, P., Watson, G. D., Bartel, G. A., and Greenwood, E. A. N.: Evaporation from
damp-land vegetation on a ground water mound, J. Hydrol., 115, 65–75, 1990.
25
Farrington, P., Bartel, G. A., Watson, G. D., and Salama, R. B.: Long term transpiration from two Eucalypt species in a native woodland estimated by the heat pulse technique, Aust. J. Ecol., 5, 224–225, 1994.
HESSD
2, 1787–1806, 2005 Evapotranspiration computed by Darcy’s Law O. A. E. Abdalla Title Page Abstract Introduction Conclusions References Tables Figures J I J I Back Close Full Screen / EscPrint Version Interactive Discussion
EGU
and native plants in a Western Australian wheatbelt catchment, Agricultural Water Manage-ment, 22, 4, 357–367, 1992.
Geotehnika: El Obeid water supply project, Feasibility study of ground water resources, Master report, National Water Administration, Ministry of Energy and Mining, Khartoum, Sudan, 1985.
5
Geotehnika: El Obeid water supply project, Exploration of ground water resources, National Corporation for development of rural water resources, Ministry of Irrigation and water re-sources, Khartoum, Sudan, 1988.
Hatton, T. J. and Vertessy, R. A.: Transpiration of plantation of Pinus radiata estimated by the heat pulse method and Bowen Ratio, J. Hydrol., 4, 289–298, 1990.
10
Heinl, M. and Thorweihe, U.: Ground water balance of the sedimentary aquifer in Darfur, Upper Nile area, Sudan, in: Geoscientific research in Northeast Africa, Proc. of Intern. Conf. on Geosci. Res., Northeast Africa, edited by: Thorweihe, U. and Schandelmeier, H., Rotterdam, 687–692, 1993.
IFAD: Northern Kordofan Rural Development Project, Special Identification Mission Reports,
15
Ministry of Irrigation and water resources, Khartoum, Sudan, 1993.
Kheir, O. M.: Hydrogeology of Dongola area, Northern Sudan, Berl. Geowiss. Abh. (A), 74, 81 p., Berlin, Germany, 1986.
Kontny, J.: Grundwasserverdunstung in ostsaharischen Senkgebieten unter besonderer Ber ¨ucksichtigung der Transpiration wild wachsender Vegetation, Berl. Geowiss. Abh. (A),
20
151, 99 p., Berlin, Germany, 1993.
National Corporation of Rural Water Development (NCRWD): Different well reports (unpub-lished). Ministry of Irrigation, Khartoum, Sudan, 1958–1995.
Rodis, H. G., Hassan, A., and Wahdan, L.: Ground water geology of Kordofan Province, Sudan. Bulletin No. 14, Ministry of Irrigation, Khartoum, Sudan, 1965.
25
Salama, R. B., Bartle, G. A., and Farrington, P.: Water use of plantation Eucalyptus camaldu-lensis estimated by ground water hydrograph separation techniques and heat pulse method, J. Hydrol., 156, 163–180, 1997.
Salama, R. B.: African basins, in: Sedimentary basins of the world, edited by: Selly, R. C., 3, 105–1149, Elsevier, 1997.
30
Thorweihe, U.: Hydrogeologie des Dakhla-Beckens ( ¨Agypten), Berl. Geowiss. Abh., (A), 38, 53 p., Berlin, Germany, 1982.
HESSD
2, 1787–1806, 2005 Evapotranspiration computed by Darcy’s Law O. A. E. Abdalla Title Page Abstract Introduction Conclusions References Tables Figures J I J I Back Close Full Screen / EscPrint Version Interactive Discussion
EGU
Problemen der GW-Neubildung, der GW-Zirkulation und des Wasserhaushaltes im Nord-sudan, Berl. Geowiss. Abh. (A), 186, 158 p., Berlin, Germany, 1996.
HESSD
2, 1787–1806, 2005 Evapotranspiration computed by Darcy’s Law O. A. E. Abdalla Title Page Abstract Introduction Conclusions References Tables Figures J I J I Back Close Full Screen / EscPrint Version Interactive Discussion EGU S U D A N E G Y P T L I B Y A C H A D C. A. R. E T H I O P I A Blu e N ile R ift W hite N ile R ift Centra l Africa n shea r Zone R ed S ea Khartoum El Obeid In te rn a tio n a l b o u n d a r y Sedimentary basins Water course Capital city City 12° 00` 250 Km Study area The Nile 20°00` 30°00` 38°00` Eriteria 0 Bagara Basin So uth ern Su dan R ift Kheiran Area
Fig. 1. The location of the study area within the Central Sudan Rift Basins, which are bounded
on their north edges by the Central African Shear Zone. The location of the study area is marked by the square.
HESSD
2, 1787–1806, 2005 Evapotranspiration computed by Darcy’s Law O. A. E. Abdalla Title Page Abstract Introduction Conclusions References Tables Figures J I J I Back Close Full Screen / EscPrint Version Interactive Discussion
EGU
19
Superficial deposits and
sand dunes (Pleistocene - Holocene)
Umm Rawaba
Formation
Unclassified Tertiary
sediments
(Late Tertiary
-Pleistocene)
Basement rocks
Nawa Formation
Mesozoic
Cretaceous Sediments
Palaeozoic
Precambrian
Top Figure 2 Abdalla
ABDALLA
Fig. 2. Schematic diagram shows the geological succession.
HESSD
2, 1787–1806, 2005 Evapotranspiration computed by Darcy’s Law O. A. E. Abdalla Title Page Abstract Introduction Conclusions References Tables Figures J I J I Back Close Full Screen / EscPrint Version Interactive Discussion EGU 14°00' 32°00' 31°00' 31°00' 14°00' K h o r R igei la E l H am ir 0 25 Km 489.4 475.2 472 480 475 468 478.75 476.8 468.57 469.7 459.8 418.9 417.8 414.1 404.3 386.1 476.2 470.24 469.1 471.19 417.8 412 433 359.9 350 367 350 363 364.6 361 375.5 403 392 393.2 361.6 397 387.23 466.6 423,3 418.1 391.7 387.3 379.1 374 384 416.9 407.1 363 361 361.1 14°00' Basement rocks Sediments LEGEND: Groundwater contour line (m amsl) 32°45' 12°30' 13°00' W h ite N ile Bara El Obeid Umm Rawaba Umm Balagei Tendelti Sherkeila Abu Hamra El Semeih Er Rahad Wad Ashana Umm Dam Et Tayara
Khor Abu Habil
J. EdDaeir J. Muginus J. Helmaul J. Kon El Beshiri J. Dumbeir Ed Dueim J. Arashkol J. Heleiba Khor Abu Ha bil 480 12°30' 30°00' 13°00' Groundwater flow direction Cross section 400 480 480 470 410 390 420 440 460 450 370 360 360 360 380370 390 350 430 32°00' 370 331.3 342.2 348 352 350 349.6 353 352.9 358.8 358.5 357.6 353.2 354 359.2 364.2 348.8 359 373 357.1 347 341.6 355.2 343.2 355.9 347.7 340.2 345.5 Hashaba Elevated Hills City Small town or big village Deep boreholes Kosti W hite N ile 359 350 480 480 460 30°00' 370 374.1 374 369 370 370 390 380 380 380 s 3 zo ne 2 zone 1 zo ne b zo n e c zone 4 zone 3 zone a Bara Basin Kosti Basin
Fig. 3. Hydrogeological map of the study area. Ground water flows generally from the NW
to the SE with variable hydraulic gradients. Closed contour lines are recorded east of Bara indicating steeper hydraulic gradient, while widely spaced lines characterize the southeastern part and indicate a gentler gradient. The diagram also illustrates the location of the point s3, where evapotranspiration is estimated, and the cross sections, which are plotted in the next Figs. 5 and 6.
HESSD
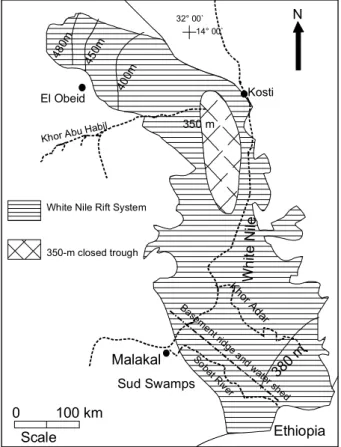
2, 1787–1806, 2005 Evapotranspiration computed by Darcy’s Law O. A. E. Abdalla Title Page Abstract Introduction Conclusions References Tables Figures J I J I Back Close Full Screen / EscPrint Version Interactive Discussion EGU Kosti El Obeid Khor Abu Ha bil Whi te N ile Base me nt ridg e a nd w ate r sh38ed 0 m 350 m 400m 450m 480m Malakal Kh or A dar 100 km 0 N 32° 00` 14° 00`
White Nile Rift System
350-m closed trough Scale Ethiopia Sud Swamps Soba t R iver
Fig. 4. The hydrogeology of the White Nile Rift System. The diagram shows the location of
the closed hydrologic trough, through which discharge mechanism takes place. The study area represents the northern part of the Rift System. Ground water moves from the South and North towards the center of the Rift System.
HESSD
2, 1787–1806, 2005 Evapotranspiration computed by Darcy’s Law O. A. E. Abdalla Title Page Abstract Introduction Conclusions References Tables Figures J I J I Back Close Full Screen / EscPrint Version Interactive Discussion
EGU
Umm Rawaba Sub-basin
>5000 m Dar Agil Sub-basin
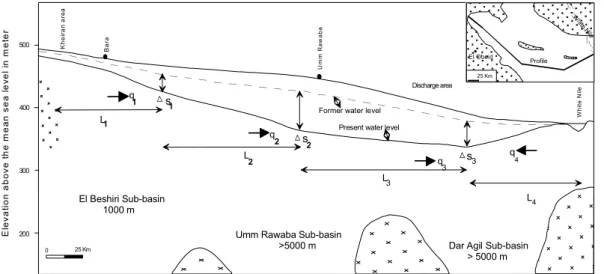
> 5000 m 1 s2 2 q 1 3 s3 4 4 El Beshiri Sub-basin 1000 m 2 q q q L1 L L3 L Wh it e N ile Ba ra Um m R a w a b a Discharge area Kh e ir a n a re a
Present water level Former water level 500 400 300 200 El e v a ti o n abo v e t h e m e a n s e a l e ve l in m e te r s 0 25 Km 25 Km El Obeid Profile
Fig. 5. Cross section illustrates the hydrogeological situation of the deep aquifer along the axial
trough of the Bara Basin. The section trends NW–SE, begins at the Kheiran area, and ends at the White Nile. Four different zones of different hydraulic gradients are recorded and the distances of the flow path are marked by capital letter L. The total length of the section is about 362 km. The small letter q indicates specific discharge when is multiplied by aquifer thickness (b) yields discharge per quifer unit width (Q) that is used in the calculation.
HESSD
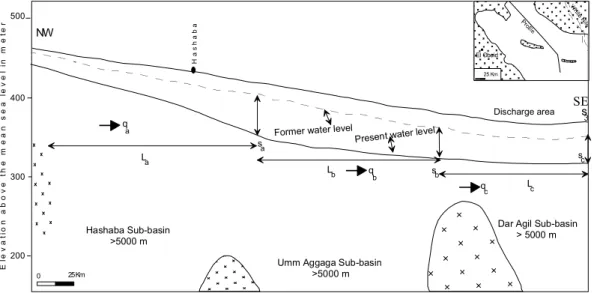
2, 1787–1806, 2005 Evapotranspiration computed by Darcy’s Law O. A. E. Abdalla Title Page Abstract Introduction Conclusions References Tables Figures J I J I Back Close Full Screen / EscPrint Version Interactive Discussion EGU q b qc q a La Lb Lc H a s haba E le v at io n ab o v e t h e m e a n s e a l e v e l in m e te r c s b s sa 0 25 Km 25 Km El Obeid 3 s NW SE
Umm Aggaga Sub-basin >5000 m
Dar Agil Sub-basin > 5000 m Hashaba Sub-basin
>5000 m
Present water level Former water level
500
400
300
200
Discharge area
Fig. 6. A cross section along the axial trough of the Kosti Basin. Three different hydraulic zones
are identified. The section generally trends NW–SE. It starts at the northwestern part of the Kosti Basin and ends at the White Nile. It covers the hydrologic situation in the basin with a total length of about 229 km.