HAL Id: hal-00295781
https://hal.archives-ouvertes.fr/hal-00295781
Submitted on 10 Nov 2005
HAL is a multi-disciplinary open access
archive for the deposit and dissemination of
sci-entific research documents, whether they are
pub-lished or not. The documents may come from
teaching and research institutions in France or
abroad, or from public or private research centers.
L’archive ouverte pluridisciplinaire HAL, est
destinée au dépôt et à la diffusion de documents
scientifiques de niveau recherche, publiés ou non,
émanant des établissements d’enseignement et de
recherche français ou étrangers, des laboratoires
publics ou privés.
The bi-directional exchange of oxygenated VOCs
between a loblolly pine (Pinus taeda) plantation and the
atmosphere
T. Karl, P. Harley, A. Guenther, R. Rasmussen, B. Baker, K. Jardine, E.
Nemitz
To cite this version:
T. Karl, P. Harley, A. Guenther, R. Rasmussen, B. Baker, et al.. The bi-directional exchange of
oxygenated VOCs between a loblolly pine (Pinus taeda) plantation and the atmosphere. Atmospheric
Chemistry and Physics, European Geosciences Union, 2005, 5 (11), pp.3015-3031. �hal-00295781�
Atmos. Chem. Phys., 5, 3015–3031, 2005 www.atmos-chem-phys.org/acp/5/3015/ SRef-ID: 1680-7324/acp/2005-5-3015 European Geosciences Union
Atmospheric
Chemistry
and Physics
The bi-directional exchange of oxygenated VOCs between a loblolly
pine (Pinus taeda) plantation and the atmosphere
T. Karl1, P. Harley1, A. Guenther1, R. Rasmussen2, B. Baker3, K. Jardine3, and E. Nemitz4
1National Center for Atmospheric Research, Boulder, Colorado, USA 2Oregon Health and Science University, Oregon, USA
3South Dakota School of Mines and Technology, Rapid City, South Dakota, USA 4Centre for Ecology and Hydrology, Edinburgh, UK
Received: 1 July 2005 – Published in Atmos. Chem. Phys. Discuss.: 11 August 2005 Revised: 26 October 2005 – Accepted: 26 October 2005 – Published: 10 November 2005
Abstract. Using new in-situ field observations of the most abundant oxygenated VOCs (methanol, acetaldehyde, ace-tone, C3/C4carbonyls, MVK+MAC and acetic acid) we were able to constrain emission and deposition patterns above and within a loblolly pine (Pinus taeda) plantation with a sweetgum (Liquidambar styraciflua) understory. During the day canopy scale measurements showed significant emis-sion of methanol and acetone, while methyl vinyl ketone and methacrolein, acetaldehyde and acetic acid were mainly de-posited during the day. All oxygenated compounds exhibited strong losses during the night that could not be explained by conventional dry deposition parameterizations. Accompany-ing leaf level measurements indicated substantial methanol and acetone emissions from loblolly pine. The exchange of acetaldehyde was more complex. Laboratory measure-ments made on loblolly pine needles indicated that acetalde-hyde may be either emitted or taken up depending on am-bient concentrations, with the compensation point increas-ing exponentially with temperature, and that mature dles tended to emit more acetaldehyde than younger nee-dles. Canopy scale measurements suggested mostly depo-sition. Short-term (approx. 2 h) ozone fumigation in the lab-oratory had no detectable impact on post-exposure emissions of methanol and acetone, but decreased the exchange rates of acetaldehyde. The emission of a variety of oxygenated com-pounds (e.g. carbonyls and alcohols) was triggered or sig-nificantly enhanced during laboratory ozone fumigation ex-periments. These results suggest that higher ambient ozone levels in the future might enhance the biogenic contribution of some oxygenated compounds. Those with sufficiently low vapor pressures may potentially influence secondary organic aerosol growth. Compounds recently hypothesized to be pri-marily produced in the canopy atmosphere via ozone plus terpenoid-type reactions can also originate from the
oxida-Correspondence to: T. Karl
tion reaction of ozone with leaf surfaces and inside the leaf. This needs to be taken into account when scaling up very re-active biogenic compounds.
1 Introduction
The emission of biogenic volatile organic compounds (VOC) is recognized as the largest terrestrial source of reactive car-bon to the atmosphere (Guenther et al., 1995). While sig-nificant emissions of oxygenated VOC (OVOC) from plants are generally acknowledged, their budgets remain very un-certain (Heikes et al., 2002; Singh et al., 2004). Biochemi-cal pathways for the production of some of these oxygenated compounds have recently been elucidated by various groups and reviewed by Fall (2003). For example, methanol is pro-duced in plants from demethylation of pectin and attributed to plant cell wall growth and repair. While acetone is be-lieved to originate from cyanogenesis and the decarboxyla-tion of acetoacetate, acetaldehyde has been shown to be emit-ted as a result of the oxidation of ethanol arising in anoxic tis-sues (Kreuzwieser et al., 2000). Labeling studies using13C suggest that acetaldehyde can also originate from recently fixed carbon and could be produced from cytosolic pyru-vate, which could trigger its formation under rapidly chang-ing light conditions (Karl et al., 2002a; Graus et al., 2004) have hypothesized that Acetyl-Co A might also be linked to the production of acetaldehyde and related to wound VOCs (Fall et al., 1999; Hatanaka, 1996).
Emissions of aldehydes and ketones have been observed from various plants, but in most cases only limited qualitative assessments are available above forests (Steinbrecher and Rabong, 1994; Janson et al., 1999). Compensation point and canopy scale measurements of OVOCs are still extremely scarce (Kesselmeier, 2001). Rottenberger et al. (2004) re-ported the compensation point of acetaldehyde for three tropical tree species and its variation between wet and dry
3016 T. Karl et al.: Exchange of oxygenated VOCs in the atmosphere
seasons. Cojocariu et al. (2004) presented similar measure-ments for Norway Spruce (Picea abies) using branch enclo-sures. Schade and Goldstein (2001) observed high fluxes of methanol, acetone and acetaldehyde above a plantation of ponderosa pine (Pinus ponderosa) and investigated plant-physiological influences on these emissions (Schade and Goldstein, 2002). Similarly, Spirig et al. (2005) found sig-nificant methanol fluxes from a temperate ecosystem. Sea-sonal variations in biogenic OVOCs above a North American deciduous forest in Michigan were attributed to a combina-tion of senescing and growing vegetacombina-tion (Karl et al., 2003). Overall these studies provide experimental evidence that the emission of compounds such as methanol, acetaldehyde and acetone exhibit a complex emission/deposition behavior. It is now also recognized that these compounds can be released from decaying plant material (Warneke et al., 1999), natu-rally drying grass (Karl et al., 2005) and crops (Schade and Custer, 2004).
Holzinger et al. (2004) recently reported the presence of a large number of higher molecular weight compounds (>100 amu) in the air within and above a ponderosa pine plantation and speculated that they were exclusively products of reactions between ozone and highly reactive terpenoids, many of which were undetected, that were emitted from the forest. While some of these compounds may originate from gas phase terpenoid oxidation with ozone (Calogirou et al., 1999), some are also known to be formed from the reaction of ozone with leaf surfaces (Fruekilde et al., 1998; Wildt et al., 2003). It is still not clear which of these processes is the dom-inant source of oxygenated species observed in forest atmo-spheres, especially in the higher mass range (e.g. >100 amu). Recently, various parameterizations have been incorpo-rated into global chemistry and transport models in order to constrain biogenic OVOC emissions and derive budget estimates (Jacob et al., 2002). While complex plant phys-iological models (Niinemets et al., 2004) are being devel-oped, a semi-mechanistic model has been used to assess the global budget of methanol (Galbally and Kirstine, 2002). Global and regional chemistry models typically incorporate an exponentially increasing temperature dependence for the emissions of all VOC, including those of OVOC. However, whether OVOCs are emitted or deposited depends on their relative concentrations within the leaf and in the atmosphere outside the leaf boundary layer. The rate of OVOC produc-tion, and thus the compensation point, depends on many pa-rameters such as enzyme activities, stress and nutrient levels, and may vary seasonally. In order to model the exchange of these compounds and constrain regional and global bud-gets, combined investigations of process level and canopy scale studies are a crucial link in order to develop accurate emission algorithms. Here we present results from the re-cent CELTIC (Chemical Emission, Loss, Transformation and Interaction within Canopies) field study in the eastern US above a loblolly pine (Pinus taeda) plantation with a sweet-gum (Liquidambar styraciflua) understory. Using a
combi-nation of leaf and canopy level measurements we investi-gated the bi-directional exchange of the most abundant oxy-genated compounds.
2 Experimental
2.1 Laboratory leaf level measurements
Young saplings of loblolly pine (Pinus taeda) and sweet-gum (Liquidambar styraciflua) were purchased in 2004 from Forestfarm Nursery (Williams, OR, USA) and maintained in the NCAR Frost Phytotron. Leaf gas exchange measure-ments were made using a commercial leaf photosynthesis system (MPH-1000, Campbell Scientific, Logan, UT, USA) in conjunction with a temperature-controlled glass leaf en-closure constructed in house. Humidifed and dry zero air (Zero Air Generator) were mixed with CO2(16 700 ppmv in zero air) using mass flow controllers (Model 824, Edwards High Vacuum, MA) to generate a gas stream of known CO2 concentration and dew point, free of O3, which was passed to the enclosure. Flow rate of air flowing into the enclosure was measured with a mass flow controller (Model 824, Ed-wards High Vacuum, MA). The difference in CO2and H2O vapor partial pressures between air entering and leaving the enclosure was measured with an infrared gas analyzer (LI-6262, Li-Cor, Lincoln, NE) in differential mode. The dew point of air entering the enclosure was measured using a dew point mirror (General Eastern, Watertown, MA). Rates of net photosynthesis, transpiration and stomatal conductance were calculated according to Farquhar et al. (1980).
The enclosure consisted of an upper and lower chamber, each consisting of a glass cylinder (8 cm diameter) enclosed on one end (total volume=approx. 300 cm3). A small hole in the lower chamber accommodated the shaft of a fan motor (ESCAP Model 22N28, Danaher Motion, Wood Dale, IL) to which was attached a plastic fan blade 4 cm in diameter (Mi-cronel, Vista, CA). Leaves or needles were inserted between the two chamber halves, sandwiched between two 1/8-inch closed cell foam gaskets. Incident photosynthetically active radiation (PAR) was measured outside the enclosure with a photodiode calibrated against a PAR quantum sensor (LI-192 Li-Cor, Lincoln, NE), and leaf temperature was measured us-ing a copper-constantan thermocouple (Omega Engineerus-ing, Stamford, CN) appressed to the bottom of the leaf (in the case of sweetgum) or placed in close proximity to a needles in the case of loblolly pine. Temperature control (±0.2◦C, between 20◦C and 45◦C) was achieved using two Peltier thermoelec-tric coolers sandwiched between the bottom of the enclosure and an air cooled heat sink.
Optionally a photolytic O3source was inserted either be-fore or after the plant chamber to assess the effect of ozone fumigation. Ozone concentrations in air entering and exiting the enclosure were measured by UV absorption (Model 202, 2B Technologies, USA). Blank tests using the empty glass
T. Karl et al.: Exchange of oxygenated VOCs in the atmosphere 3017
cuvette showed no significant increase of background con-centrations for compounds above 75 amu after the addition of ozone (<20% change). The VOC increase associated with the Teflon lines was small in comparison to the VOC increase associated with a plant inside the glass cuvette during ozone fumigation (<10%). In addition, measuring ozone imme-diately before and after the cuvette minimized any contri-bution associated with Teflon tubing during ozone fumiga-tion. For some oxygenated compounds (e.g. acetaldehyde, acetone) however, we observed significantly increased con-centrations due to artifact formation in the blank experiment. For example the acetaldehyde (acetone) background could increase by as much as 2 (1) ppb after adding ozone through the empty sampling system compared to an increase of 4–8 (3–5) ppb when a plant was inserted in the cuvette. A study evaluating the role of heterogeneous oxidation of alkenes in the detection of atmospheric acetaldehyde (Northway et al., 2004) found similar artifact problems for Teflon lines.
An ozone fumigation and reactivity experiment was typi-cally performed in the following sequence: (1) measurement of steady state VOC emissions in ozone free air; (2) ozone addition before the plant chamber until VOCs exiting the plant chamber reached steady state, (3) turn off ozone and wait until VOCs exiting the plant chamber were in steady state again, (4) insert a second glass reaction chamber, simi-lar in volume to the leaf enclosure, in the gas line exiting the enclosure, (5) generate ozone in the line between the plant chamber and the second reaction chamber, and measure VOC composition exiting the second chamber, (6) turn off ozone and wait until VOC emissions were approx. in steady state again. Each experiment lasted approx. 20–40 min. The two pathways were tested to determine the effects of ozone on the leaf surfaces separate from the ozone reactions with the gas-phase emissions. Ozone was produced in line and no di-lution was necessary. After the ozone source was turned off, all VOCs concentrations quickly returned to the initial con-ditions.
In order to determine a compensation point, which is de-fined as the ambient concentration level above which the plants takes up VOCs, the inlet air concentration of methanol, acetaldehyde and acetone was varied between 0 and 12 ppb. After each experiment the needles or leaves were harvested for determination of their dry weight and/or leaf area.
2.2 Field site description and experimental details
The CELTIC (Chemical Emission, Loss, Transformation and Interaction within Canopies) experiment was conducted at Duke Forest C-H2O, an experimental loblolly pine planta-tion (average tree height 18 m) in North Carolina (35.98◦N, 79.09◦W) of the site of the Duke University FACE (Free Air CO2 Enrichment) Study. More specific details can be found in Katul et al. (1999).The study began on 7 July and ended on 27 July 2003. The gas phase measurement instru-mentation was situated in a mobile trailer next to a 24 m
sampling tower (situated in FACE ring #6, a control ring with no canopy CO2fumigation). Above canopy air, drawn from 24 m through a common 30 m (O.D.3/800) Teflon line using a rotary pump, supplied two Proton-transfer-reaction mass spectrometers (PTR-MS) (Lindinger et al., 1998) with a delay time of ∼5 s. In addition, one chemiluminescense isoprene sensor (FIS) (Guenther and Hills, 1998) was de-ployed on the tower. All VOC instruments were dede-ployed for measuring fluxes using either the eddy correlation or re-laxed eddy accumulation method as described by Baker et al. (2005)1. In addition, one of the PTR-MS instruments was deployed for within-canopy gradient measurements on 3 days of the study (17, 18 and 23 July). Micrometeorological measurements at ring 6 included turbulence measurements at 4 heights using the following sonic anemometers: RM Young 81000 (R. M. Young Company, USA) (16 m above ground) and ATI K-probe (Applied Technologies, USA) (2, 8 and 26 m above ground). Meteorological data (UV radiation, air temperature, precipitation, net radiation, 2-D winds) were collected during the whole campaign on top of the tower using a weather station (Vantage Pro2, Davis Instruments Corp., USA). Photolysis rates were measured on top of the tower and within the canopy at ring 6 using a UV-B Biome-ter (Model 501, Solar Light Co., USA) and filBiome-ter radiomeBiome-ters (Metcon Inc., USA). PAR was measured using quantum sen-sors (Model LI-190SA, Li-Cor Inc., USA).
2.3 PTRMS
The PTRMS instrument has been described in detail else-where (Lindinger et al., 1998). Specifics on disjunct eddy covariance (DEC) measurements with PTR-MS can be found in Karl et al. (2002b, 2004) and for a detailed evaluation of the instrument we refer the reader to de Gouw et al. (2003a). The instrument was operated at 119 Td at 2 mbar drift pres-sure. The transmission of the quadrupole mass spectrometer was checked by spiking pure compounds up to 178 amu into the instrument and comparing the ratio of primary to product ions. Above 130 amu we observed a 30% decrease in trans-mission compared to the 70–120 amu range. The detection limit based on a reaction rate constant of 2×10⁻⁹cm3/s, 10 s integration time and 1 count per second background noise was on the order of 5 ppt. The quantification of VOCs was based on gravimetrically prepared calibration standards with an estimated uncertainty of approximately ±20%. For those species for which no calibration standard was available, we calculated concentrations using the collisional rate constant, which is typically within 30% of the measured rate con-stant. Reference measurements for determining the instru-ment background were taken through a catalytic converter (platinum wool held at 430◦C) and were performed every 1Baker, B., Jardine, K., Mielke, L., Arnts, R. R., and Karl,
T.: Above canopy flux measurements of biogenic VOCs during the 2003 CELTIC experiment at Duke Forest North Carolina, in prepa-ration, 2005.
3018 T. Karl et al.: Exchange of oxygenated VOCs in the atmosphere
30 min to 2 h. A detailed description of VOC eddy covari-ance (EC) (Guenther and Hills, 1998) and relaxed eddy ac-cumulation measurements during CELTIC will be presented elsewhere (Baker et al., 20051).
2.4 Gradient methodology
A VOC gradient system similar to that described by Karl et al. (2004) was deployed during the CELTIC study. Air was pulled through a 30 m teflon line (1/400 O.D.) from the top of the sampling tower at a high flow rate (∼0.3 l/s), reducing the pressure inside the line to 400 mbar in order to avoid wa-ter condensation, minimize memory effects and assure a fast response time. The overall delay time was ∼6 s, measured by introducing an isoprene and acetone pulse at the top of the tower. The gradient sampling inlet line was attached to a pulley controlled by an automated winch, and canopy air was sampled continuously from the ground to 24 m height. The canopy line moved at a constant speed of 0.2 m/s resulting in a complete profile about every 2 min.
Source/sink profiles were computed according to,
C − Cref= ↔
D ·S (1)
with C (concentration vector), Cref (concentration at refer-ence height 24 m), D (dispersion matrix) and S (source/sink vector). Parameterization of the dispersion matrix (21 con-centration layers and 5 source/sink layers) was based on mea-sured turbulent profiles and estimated Lagrangian timescales as described by Karl et al. (2004). For more detailed infor-mation on inverse Lagrangian modeling we refer the reader to Raupach (1989).
2.5 Footprint calculation
In order to estimate the flux footprint during day- and night-time conditions we used a random walk model similar to that described by Baldocchi (1997) and Strong et al. (2004), pa-rameterized with turbulence measurements made during the CELTIC study.
The random walk model was parameterized according to the random forcing term (dw) for the one-dimensional case according to the Fokker-Planck equation (e.g. Eq. 4 in Bal-docchi, 1997): dw = −wL TL +1 2 " 1 + w 2 L σ2 w # ∂σw2 ∂z ! dt + s 2σ2 w TL dr, (2)
with wL (Lagrangian vertical velocity), TL (Lagrangian timescale), σw (standard deviation of vertical wind compo-nent), dr (random forcing).
The trajectories for 5000 particles were released at 4 levels (25%, 50%, 75% and 100% of canopy) and computed for typical day and nighttime conditions. The mean residence time and horizontal distance traveled by the ensemble mean was used to assess the footprint in each layer and over the whole canopy (sum over 4 levels).
During daytime the mean horizontal distance traveled by an air mass was sufficiently short (∼130–150 m) that the measured VOC concentration in the canopy was dominated by emissions from the pine plantation. The surrounding oak forest had only a slight influence. During the night the preva-lent wind direction originated from 300 degrees. The plan-tation extended 800 m in this upwind direction; compared to the average total distance traveled by the sampled air mass (∼620–650 m), this was sufficient to ensure that the sampled air originated within the plantation.
3 Results and discussion
3.1 Leaf level measurements
Leaf level measurements with potted plants performed in the NCAR laboratory were used to examine the processes con-trolling canopy scale exchanges.
3.1.1 Methanol and acetone
Over the examined concentration range (0–12 ppb) both methanol and acetone were predominantly emitted from both young (younger than approx. 2 months) and mature (older than approx. 6 months) loblolly pine needles; emissions of both compounds exhibited an exponential temperature de-pendence between 20 and 40◦C. Table 1 summarizes the re-sults for loblolly pine (4 leaf enclosure experiments using 4 different sets of needles from the same tree, each lasting for 3–4 days) and compares leaf level and eddy covariance measurements. Based on a measured leaf area index in the plantation of 2.8 m2 leaf m−2 ground (Stroud et al., 2005) and a leaf mass per area (LMA) of 230 g m−2(Geron et al., 2000) for loblolly pine the average emission rates (164 and 144 pg g−1s−1for methanol and acetone, respectively) mea-sured at standard conditions (30◦C, ∼1000 µmol m−2s−1 PAR) compare well with results from the eddy covariance measurements. This comparison also supports findings from our gradient measurements that show a strong correlation between methanol and acetone emissions and the loblolly pine leaf area index. A set of leaf level measurements with sweetgum (Liquidambar styraciflua) (Table 2) indicate that substantial amounts of methanol can be emitted from young leaves (i.e., 20 times higher emission compared to a more mature leaf) and that acetone is emitted from both young and mature leaves. These observations of enhanced methanol production in young leaves support findings from previous studies (Fall and Benson, 1996). However, due to lower biomass density (LAI: 30% of total, LMA: 50 g m−2) and more shading in the understory the contribution of sweetgum to observed above canopy fluxes at Duke is small. In fact, canopy scale gradient measurements (next section) suggest that the portion of the canopy associated with most of the sweetgum biomass acts as a sink for both methanol and ace-tone.
T. Karl et al.: Exchange of oxygenated VOCs in the atmosphere 3019
Table 1. Temperature dependent methanol and acetone emissions obtained for Loblolly pine (Pinus taeda); listed are the emission rate from disjunct eddy covariance (DEC) measurements and emission rates scaled up from leaf level measurements at 303 K. Leaf level emission rates are normalized by dry weight in gram (e.g. g g−1).
E303DEC(a) E303Leaf(a) b(eca) b(La)
(ng m−2s−1) (ng m−2s−1) (ng g−1s−1) (K−1) (K−1)
Methanol 101±33 118±32 6.0±1.2 0.16±0.03 0.12±0.02 Acetone 107±34 104±32 2.1±0.4 0.08±0.01 0.09±0.01
(a)fitted according to E
303×exp(b×(T (K)−303))(b)converted from dry weight emission rate using a LAI of 2.8 m2m−2and a LMA of
230 g m−2
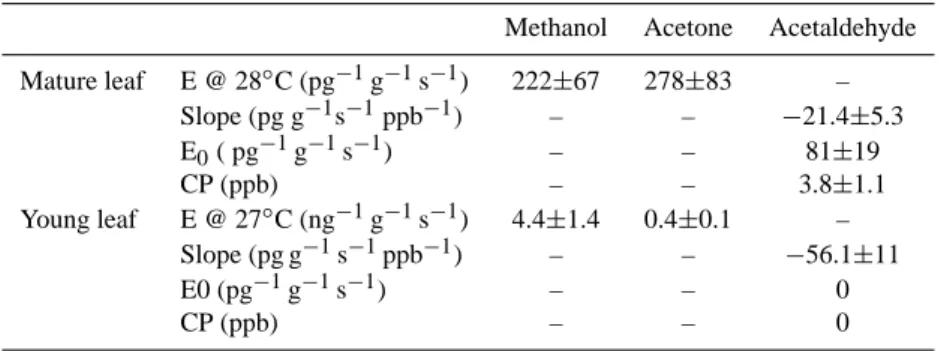
Table 2. Leaf Level measurements of methanol, acetone and acetaldehyde with sweetgum (Liquidambar styraciflua): E (methanol and acetone emission for a mature and young leaf at 28◦C and 27◦C, respectively), Slope (inferred from the compensation point regression analysis), E0(zero intercept inferred from regression analysis: exchange rate at 0 ppb concentration in incoming air) and CP (compensation
point). Leaf level exchange rates are normalized by dry weight in gram (e.g. g g−1).
Methanol Acetone Acetaldehyde Mature leaf E @ 28◦C (pg−1g−1s−1) 222±67 278±83 – Slope (pg g−1s−1ppb−1) – – −21.4±5.3 E0( pg−1g−1s−1) – – 81±19 CP (ppb) – – 3.8±1.1 Young leaf E @ 27◦C (ng−1g−1s−1) 4.4±1.4 0.4±0.1 – Slope (pg g−1s−1ppb−1) – – −56.1±11 E0 (pg−1g−1s−1) – – 0 CP (ppb) – – 0 3.1.2 Acetaldehyde
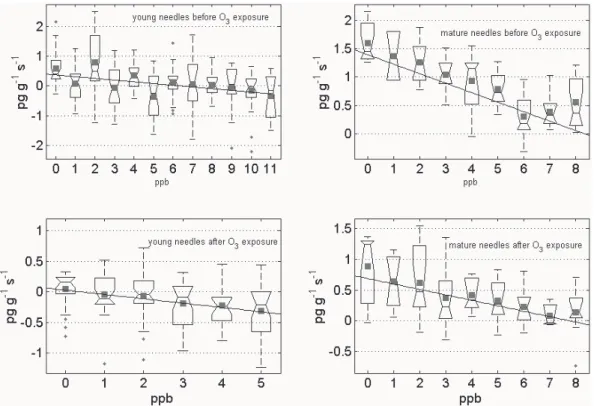
In order to determine the exchange pattern of acetaldehyde we performed detailed compensation point measurements on needles of Pinus taeda, the results of which are listed in Ta-ble 3. As an example, Fig. 1 illustrates the exchange of ac-etaldehyde plotted versus the concentration of outgoing air for young (left panels) and mature needles (right panels) be-fore (top panels) and after (bottom panels) fumigation with 120 ppb ozone. We selected periods when stomatal conduc-tance did not change significantly and the temperature fluc-tuation inside the cuvette was less than 1◦C. For young nee-dles, the exchange of acetaldehyde showed an average daily compensation point of 7.4 ppb. The range of compensation points observed for mature needles ranged between 3.7 and 8.5 ppb (Table 3). This is comparable to values (6.2 ppb) re-ported by Cojocariu et al. (2004) for Norway Spruce (Picea
abies). Maximum uptake was typically observed in the
after-noon and evening (15:00–22:00). While acetaldehyde bursts were observed after all rapid light/dark transitions, no signif-icant emission of compounds related to wounding (e.g. hex-enals) were present during these transitional periods.
Following several days of measurements using ozone free air, the same needles were fumigated with 100–150 ppb ozone for 2 h. An increase of acetaldehyde emissions
dur-ing ozone exposure was observed. However it was not pos-sible to quantify this increase due to a varying background of acetaldehyde triggered by the addition of ozone. After ozone treatment the VOC emissions declined rapidly. Dur-ing the days followDur-ing ozone fumigation we observed de-creased exchange rates of acetaldehyde. With the exception of young needles, the post-fumigation compensation point returned close to the original value (suggesting no change in the total enzyme amount); however the slope (enzyme ac-tivity) typically changed to half of the original level. A re-cent study investigated the effect of elevated ozone concen-trations on acetaldehyde emissions from beech (Fagus
syl-vatica) (Cojocariu et al., 2005). A significant increase in the
acetaldehyde exchange rates was observed at 120 ppb ozone, similar to results obtained during this study; however, it is not clear to what extent earlier results were masked by arti-fact formation of acetaldehyde as observed during the present study. Nevertheless our experiments show that even though no physiologically significant changes were obvious, the ex-change rates of acetaldehyde were systematically lower on the days following 2 h of ozone fumigation. This argues that damage to enzymes responsible for acetaldehyde metabolism might have already occurred at ozone concentrations in the 100–150 ppb range.
3020 T. Karl et al.: Exchange of oxygenated VOCs in the atmosphere
Table 3. Leaf level compensation point measurements of acetaldehyde for Loblolly Pine (Pinus taeda). Compensation point measurements with 4 sets of needles are summarized as follows (lines 1–7): Slope (inferred from the compensation point regression analysis), E0c(zero
intercept inferred from regression analysis: emission at 0 ppbv concentration in incoming air) and CP (compensation point). Net photosyn-thesis rates (Net PS rate per gram dry weight) are summarized in the last column. The temperature dependence is summarized in lines 9 and 10: E0c303(zero intercept inferred from regression analysis at 303 K: emission at 0 ppbv concentration in incoming air), b0
(exponen-tial temperature dependence of zero intercept), CP303(compensation point at 303 K) and bcp(exponential temperature dependence of the
compensation point). Leaf level emission rates are normalized by dry weight in gram (e.g. g g−1).
Slope (pg g−1s−1ppb−1) E0c(pg g−1s−1) CP (ppb) Net PS rate (µmol g−1h−1)
Set 1 before O3 (mature) −3.1±0.3 11.1±1.1 3.7±0.6 147±7 Set 1 1 day after O3 −1.7±0.1 5.6±0.6 3.5±0.5 138±6 Set 2 before O3 (mature) −10.8±0.8 91.7±2.8 8.5±1.3 203±14 Set 2 1 day after O3 −5.5±0.3 50±2.8 8.0±1.3 203±10 Set 3 before O3 (young) −3.5±0.3 25.7±5.6 7.4±2.5 – Set 3 1 day after O3 −4.3±0.6 3.3±0.1 0.8±0.4 – Temperature dependence E(0c303a) (pg−1g−1s−1) b0(a)(K−1) CP303(b) (ppb) b(cpb)(K−1)
Set 4 (mature) 26.8±2.8 0.10±0.005 4.3±0.5 0.11±0.006
(a)fitted according to E
0c303×exp (b0×(T (K)−303)); R2=0.98.(b)fitted according to CP303×exp (bcp×(T (K)−303)); R2=0.99.
33
Figure 1:
Fig. 1. Example of compensation point measurements for acetaldehyde with Loblolly pine (Pinus taeda) using young needles before (upper left) and after 120 ppb ozone exposure (lower left) and mature needles before (upper right) and after 120 ppb ozone exposure (lower right). Exchange rates (pg g−1s−1)are plotted vs outgoing air concentration in ppb. Leaf level exchange rates are normalized by dry weight in gram (e.g. g g−1). Symbols in statistical plot are defined as following: gray square symbol: mean; center horizontal line: median: upper and lower horizontal lines: upper and lower quartile; whiskers: extent of the rest of the data.
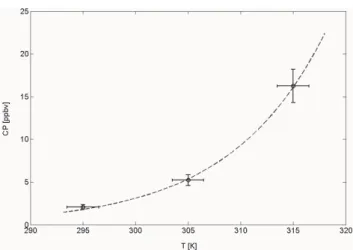
Acetaldehyde emissions changed with temperature re-flected by an exponentially increasing compensation point (Table 3). Figure 2 shows a plot of the compensation point versus temperature for mature loblolly needles. The
tem-perature dependence points toward competing enzyme reac-tions similar as observed for CO2 uptake in plants. Multi-ple competing enzyme reactions involved with acetaldehyde metabolisms in plants have been proposed in previous studies
T. Karl et al.: Exchange of oxygenated VOCs in the atmosphere 3021
(Kreuzwieser et al., 2000; Karl et al., 2002a; Graus et al., 2004). The production rate per ppb of acetaldehyde (slope in Fig. 1), which corresponds to the total enzyme activity, did not change drastically at different temperatures.
An emission rate dependent on ambient acetaldehyde con-centration has also been observed above different ecosystems (Cojocariu et al., 2004; Rottenberger et al., 2004) and im-plies that the temperature dependence of canopy scale VOC fluxes should only be applied to a temperature range that was measured during a particular study. Extrapolation to higher temperatures would need to include the effect of a compensa-tion point and other factors such as transpiracompensa-tion rates. Oth-erwise the overall emissions would at best be guesstimates. In these cases a relationship between VOC fluxes with sen-sible or latent heat fluxes might be more accurate for upscal-ing purposes as it includes physiologically driven variables (such as transpiration). Inappropriate upscaling of biogenic OVOC emissions by Singh et al. (2004) could explain part of the variability between different studies summarized by these authors.
3.1.3 Other oxygenated VOCs observed during ozone fu-migation
OVOC appearing in air exiting the leaf enclosure during ozone fumigation could represent either direct leaf emissions or oxidation products arising from ozone reacting with either leaf surfaces or with other reactive gas-phase emissions, such as mono- or sesquiterpenes. Two experimental protocols were used distinguish between primary (i.e., direct OVOC emissions or the OVOC products of leaf surface-ozone re-actions) and secondary OVOC production (i.e., the OVOC products of ozone reactions with gas-phase emissions). In the first case, ozone was added immediately before the plant cuvette. The mixing time was measured to be on the order of 25–30 s. In the second case ozone was added to the air stream exiting the plant cuvette and passed through a sec-ond glass mixing vessel, sized so that the total residence time (25–30 s) roughly matched the residence time in the plant cuvette. In the second case, in which the needles are not exposed directly to ozone, any additional OVOC ob-served exiting the second mixing vessel must be secondary in nature, i.e., the product of reactions between ozone and VOC emissions from the needles. By subtraction, the nature and amount of OVOC arising from either direct emission or ozone-needles interactions, i.e., primary OVOC, can be esti-mated. Empty cuvette blanks showed that artifact formation on glass surfaces during the addition of ozone were minimal. While an ozone induced increase of terpene emissions cannot be excluded on longer timescales (hours), our measurements of post-exposure emissions immediately after fumigation in-dicated that the total amount of terpenes and sesquiterpenes did not change significantly within the time scale of minutes (e.g. 15–40).
34 Figure 2
Fig. 2. Compensation point (CP) plotted vs temperature. The dashed line shows a fit according to CP303×exp (bcp×(T
(K)−303)); R2=0.99.
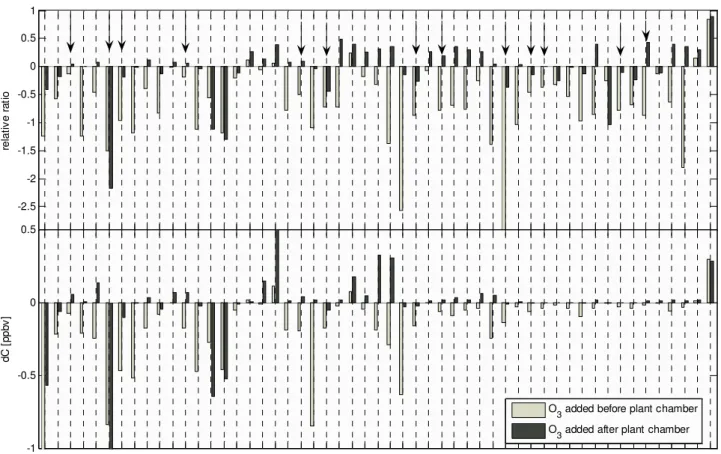
The results of one fumigation experiment are shown in Fig. 3, which shows the relative (upper panel) and absolute (lower panel) concentration difference of mass spectra ob-served by the PTR-MS instrument between the no ozone fu-migation base case and the two fufu-migation experiments in which 200 ppb O3 was added either before or after the leaf enclosure (∼15 min exposure time in both cases). For sim-plicity, only odd m/z ratios above 100 amu are shown. Pos-itive values indicate reactive losses. For example more than 80% (relative ratio >0.8) of the reactive sesquiterpenes (m/z 205) (dominated by β-caryophyllene as inferred from par-allel GC-FID measurements) were oxidized during the brief mixing time within the chamber, regardless of whether ozone was added before or after the chamber. Negative values rep-resent the production of compounds during the addition of ozone. In particular ions corresponding to a series of C9 -C13 aldehydes and unsaturated alcohols (m/z 125 and 143, m/z 139 and 157, m/z 153 and 171, m/z 167 and 185 and m/z 181 and 199) and compounds exhibiting ions 2 amus higher (e.g. saturated alcohols) were dramatically enhanced when ozone was added before the plant chamber (Fig. 3, dark bars). Many of these aldehydes and alcohols are known to be linked to wounding and plant damage through lipoxyge-nase type reactions that are also responsible for the so-called “green odor” of plants (Hatanaka, 1996; Fall, 1999; Wildt et al., 2003). Some others may correspond to compounds that have been identified during ozonolysis at vegetation sur-faces (e.g. m/z 127: 6-methyl-5-hepten-2-one and m/z 195: geranyl acetone) (Fruekilde et al., 1998). When ozone was added after the plant chamber, the biggest changes were ob-served in ions exhibiting m/z 111 and 129, and m/z 127 and 145; these must result from secondary gas phase formation via oxidation of reactive plant emissions (e.g., terpenoids). These ions most likely correspond to ketones, ketoaldehdyes and aldehydes that have tentatively been identified from the oxidation of terpenoids (Calogirou et al., 1999).
3022 T. Karl et al.: Exchange of oxygenated VOCs in the atmosphere
35
Figure 3
-2.5 -2 -1.5 -1 -0.5 0 0.5 1 re la tiv e ra tio -1 -0.5 0 0.5 m/z dC [p pb v] 10 1 10 3 10 5 10 7 10 9 11 1 11 3 11 5 11 7 11 9 12 1 12 3 12 5 12 7 12 9 13 1 13 3 13 5 13 7 13 9 14 1 14 3 14 5 14 7 14 9 15 1 15 3 15 5 15 7 15 9 16 1 16 3 16 5 16 7 16 9 17 1 17 3 17 5 17 7 17 9 18 1 18 3 18 5 18 7 18 9 19 1 19 3 19 5 19 7 19 9 20 1 20 3 20 5O3 added before plant chamber O3 added after plant chamber
Fig. 3. PTR-MS mass scans during ozone fumigation. For simplicity only odd m/z ratios are plotted. Upper panel: The Y-axis depicts the relative concentration difference before minus after the addition of 200 ppb ozone (CnoO3-CO3)/CnoO3. Positive values indicate reactive
losses (positive if the concentration without ozone was higher) and negative values indicate production induced by ozone. By definition the upper limit is 1 (100% is lost after the addition of ozone). Arrows indicate m/z ratios recently assigned to secondary oxygenated compounds (Holzinger et al., 2004). Lower panel: The Y-axis shows the absolute concentration difference (dC) before minus after the addition of 200 ppbv ozone.
Of particular interest are those masses which increased during ozone exposure, but which exhibited marked differ-ences depending on whether the ozone was added before or after the leaf enclosure. If the increase in a given mass is the result of reactions between ozone and primary leaf emis-sions, the enhancement should be independent of where the ozone addition takes place. However, if the enhancement is the result of interactions between ozone and the plant itself, enhancement should be greater when ozone is added before the plant chamber.
The timescales of mixing in these laboratory experiments (∼30 s) are somewhat lower than typical turbulent time scales (60–120 s) in a 6 m tall canopy; however, they are within the range of chemical lifetimes of very reactive ter-penes. The arrows in Fig. 3 indicate compounds that have previously been assigned to secondary species formed due to reactions of ozone with very reactive compounds emitted from pines (Holzinger et al., 2004). Our measurements imply
that, with the exceptions of m/z 111, 127, 129, 143 and 145, the bulk of these compounds are likely the result of either direct reactions of ozone with plant surfaces or damaging ef-fects of ozone inside the plant (comparison of negative ratios in Fig. 3).
Overall, 13 ozone addition experiments were conducted. We performed 5 (3) experiments on the same loblolly (pon-derosa) pine tree using different branches for each exper-iment. Qualitatively similar results were obtained at 50– 80 ppb ozone concentrations. While results shown in Fig. 3 were obtained with loblolly pine, similar results (not shown) were found for needles of ponderosa pine (Pinus ponderosa).
3.1.4 Ozone uptake measurements
In order to determine what fraction of ozone is lost through stomata and what fraction reacts in the gasphase and on leaf surfaces a set of experiments was performed where the ozone
T. Karl et al.: Exchange of oxygenated VOCs in the atmosphere 3023
Table 4. Temperature Dependence of VOC emissions during an ozone exposure experiment of 100 ppb and oVOC emissions as a function of ozone flux. Fits were obtained from data shown in Figs. 5 and 6. Wound VOCs are defined as the sum of lipoxygenase products (C6leaf
aldehydes and alcohols). Oxy VOCs are defined as the sum of all masses indicated by arrows in Fig. 3. MT is the sum of monoterpenes and SQT is the sum of sesquiterpenes (mostly beta-caryophellene). Experiment was performed on needles of Loblolly pine (Pinus taeda).
Temperature Wound VOC OXY VOC MT SQT ET0(pmol g−1s−1)(a) 8.6±0.2 3.4±0.2 4.6±0.3 0.25±0.05 b0(K−1)(a) 0.070±0.003 0.082±0.004 0.131±0.007 0.155±0.019 Ozone EO3(pmol g−1s−1)(b) 7.9±1.0 3.2±0.5 – – a (g s pmol−1)(b) 0.047±0.02 0.05±0.02 – – (a)fitted according to E
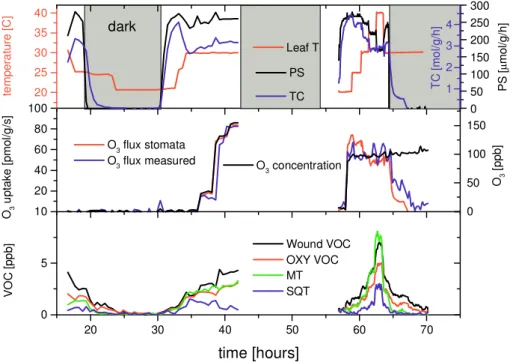
T0×exp ( b0×(T (K)−303))(b)fitted according to EO3×a×FO3/sqrt(1+a2FO3)), with FO3being the ozone uptake Figure 4 20 30 40 50 60 70 0 5 10 Wound VOC OXY VOC MT SQT VO C [p pb ] time [hours] 20 40 60 80 100 O3 u pt ak e [p m ol /g /s ] O3 flux stomata O3 flux measured 20 25 30 35 40 dark te m pe ra tu re [C ] Leaf T 0 50 100 150 200 250 300 PS PS [ µ m ol /g /h ] 0 50 100 150 O3 [p pb ] O3 concentration 1 2 3 4 TC [m ol /g /h ] TC
Fig. 4. Ozone fumigation of Loblolly Pine (Pinus Taeda). Top panel shows net photosynthesis rates (PS) in black, total conductance (TC) in blue and leaf temperature in red. Middle panel shows ozone flux calculated from total conductance data (O3flux stomata: red), ozone flux
measured in differential mode (O3flux measured blue) and ozone concentration entering the cuvette (black). Lower panel shows C6wound aldehydes (black), OXY VOCs (sum of all compounds indicated by arrows in Fig. 3 with the exception of m/z 111, m/z 127 and m/z 129 which are predominantly produced from gas phase reactions: red), monoterpenes (MT: green) and sesquiterpenes (SQT: blue).
difference between air entering and exiting the cuvette was measured. The top panel shows net photosynthesis rates (black), total conductance to water vapor (blue) and temper-ature (red). Gray shaded areas indicate dark periods. As-suming ozone and water vapor diffuse into the leaf along the same diffusion path, leaf conductance to ozone can be esti-mated by dividing conductance to water vapor by the ratio of their diffusivities in air (1.6). Assuming that ozone reacts immediately upon entering the leaf (i.e., ozone concentra-tion within the leaf is zero) then the ozone flux into the leaf can be estimated as the product of leaf conductance to ozone times the ozone concentration surrounding the leaf. The
mid-dle panel compares the ozone uptake flux calculated in this way (red) with a direct measurement of ozone uptake, deter-mined by an ozone difference measurement (blue) between air entering and exiting the cuvette. Also shown is the ozone concentration entering the cuvette (black). Blank runs were used to characterize ozone destruction on wall surfaces of the cuvette, which were found to be small due to the short residence time. In this experiment most of the ozone loss can be explained by ozone uptake through stomata. Photo-synthesis rates and stomatal conductance were not impacted significantly by this short term ozone exposure (O3 con-centration range: 0–150 ppb, accumulated ozone threshold
3024 T. Karl et al.: Exchange of oxygenated VOCs in the atmosphere
37 Figure 5
Fig. 5. Temperature dependence of VOC emissions at 100 ppb Ozone entering the leaf cuvette for VOCs shown in Fig. 4. Cor-responding fits are included in Table 4.
above 40 ppbv (AOT 40): 15.6 ppb h); temperature impacted photosynthesis rates and stomatal conductance to a much larger extent. Despite no clear physiological evidence of leaf damage, VOC emissions related to ozone damage were al-ready triggered at these ozone concentrations. The lower panel in Fig. 4 shows the concentrations of monoterpenes and sesquiterpenes (corrected for lifetime, assuming mostly b-caryophellene) as well as the sum of C6 wound VOCs (m/z 143, m/z 101, m/z 99, m/z 83 and monoterpene cor-rected residual on m/z 81) and OXY VOCs (sum of all com-pounds indicated by arrows in Fig. 3 with the exception of m/z 111, m/z 127 and m/z 129 which are predominantly pro-duced from gas phase reactions). Figure 5 shows a plot of VOC emissions versus leaf temperature from the same ex-periment. In general, all VOC emissions follow an exponen-tially increasing temperature trend under constant conditions (PAR=740±18 and 100 ppb O3), obeying the general expo-nential equation (y=ET0×exp(b0(Tk−303)) where ET0is the measured emission rate at 303 K and Tk is leaf temperature (K). Results are summarized in Table 4. The exponential b0factor is similar for wound VOCs and oxygenated VOCs but is about a factor of two higher for mono- and sesquiter-penes. Assuming that very reactive terpenes (Holzinger et al., 2004) exhibit a temperature dependence similar to that of mono- and sesquiterpenes, this may indicate that the emis-sion of many oxygenated VOCs might not be entirely linked to the emission of reactive terpenes, but could potentially be generated by ozone reacting with leaf constituents. Figure 5 shows a plot of VOC emission rates vs. rates of ozone loss, which in the present case was mostly the result of stomatal uptake. A fit to an equation (Table 4) similar to that used by Wildt et al. (2003) is used to relate the increase of VOC emissions to ozone uptake. At higher rates of ozone uptake, the VOC emissions saturate which suggests primary produc-tion of these compounds by the plant. If gas phase reacproduc-tions
38 Figure 6
Fig. 6. VOC emission increase from baseline emissions as a func-tion of ozone uptake measured at 30◦C. C6 wound aldehydes are
plotted in blue circles and OXY VOCs (sum of all compounds in-dicated by arrows in Fig. 3 with the exception of m/z 111, m/z 127 and m/z 129 which are predominantly produced from gas phase re-actions) are plotted in red square symbols. Corresponding fits are included in Table 4.
dominated, a linear increase would be expected. More mea-surements will be needed in the future to examine the effect of long term O3exposure and variability on the production of these compounds.
3.2 Canopy scale measurements
3.2.1 Eddy covariance measurements
A more detailed analysis of VOC flux measurements will be presented elsewhere (Baker et al., 20051). Results obtained from eddy covariance measurements of methanol and ace-tone agreed within the variability of the gradient measure-ments (Table 5) during the day and generally showed a di-urnal cycle. The emission of both compounds correlate with latent and sensible heat fluxes (Baker et al., 20051). Eddy covariance data for acetaldehyde are more ambiguous due to the complex exchange pattern of this compound and some instrumental problems associated with one PTR-MS instru-ment that was used for DEC measureinstru-ments. The gradient data (next section) suggest acetaldehyde loss in the canopy and emission during certain transitional morning and evening hours.
3.2.2 Gradient measurement
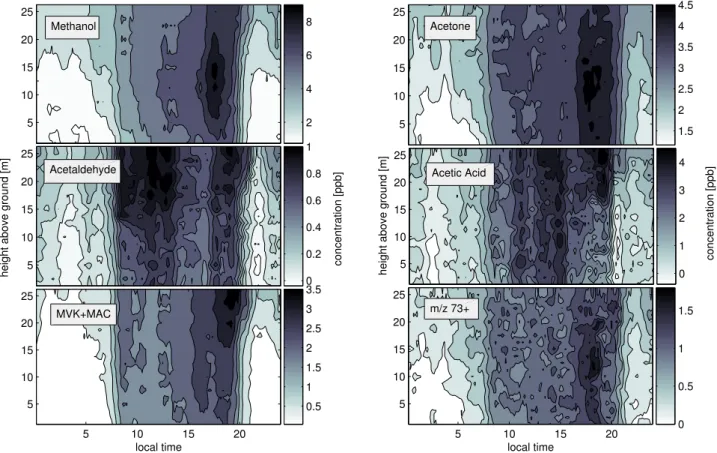
Figure 7 depicts concentration profiles measured for methanol, acetone, acetaldehyde, acetic acid, MVK+MAC and m/z 73. Using the PTR-MS instrument, ions observed at m/z 73 have tentatively been assigned to C4and C3carbonyls such as methyl ethyl ketone and methyl-glyoxal (de Gouw et al., 2003b). Under conditions of low collisional energies and
T. Karl et al.: Exchange of oxygenated VOCs in the atmosphere 3025
39
Figure 7
5 10 15 20 25 5 10 15 20 25height above ground [m] 5
10 15 20 25
height above ground [m]
concentration [ppb] 5 concentration [ppb] 10 15 20 25 local time 5 10 15 20 5 10 15 20 25 local time 5 10 15 20 5 10 15 20 25 2 4 6 8 1.5 2 2.5 3 3.5 4 4.5 0 0.2 0.4 0.6 0.8 1 0 1 2 3 4 0.5 1 1.5 2 2.5 3 3.5 0 0.5 1 1.5 Methanol Acetone
Acetaldehyde Acetic Acid
MVK+MAC m/z 73+
Fig. 7. Concentration gradients measured within the Duke Forest stand for methanol, acetone, acetaldehyde, acetic acid, MVK+MAC and C3+C4carbonyls.
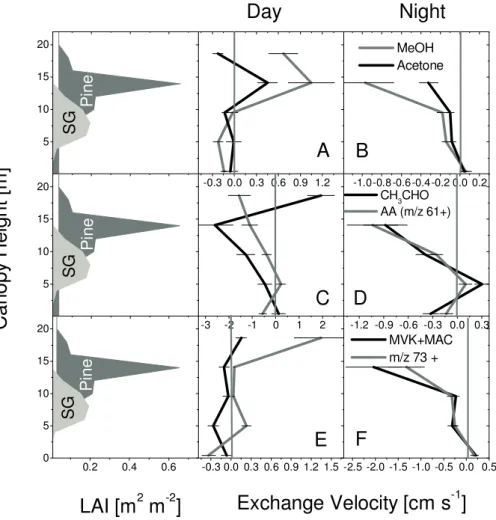
high humidity the third water cluster ((H2O)3H3O+) could also interfere at m/z 73. Reference measurements through a conditioned catalytical converter however can be used to characterize this interference, since water is not removed by the converter. Under the operating conditions used during the CELTIC study most of the water cluster was fragmented and we conclude that the abundance on m/z 73 was most likely caused by carbonyls. From these concentration gra-dients source and sink profiles are calculated according to Eq. (1) and expressed as an exchange velocity (ev), which we define as the flux (Fc) divided by the mean concentration (C) in each layer (ev:=Fc/C). Figure 8 shows a plot of these profiles as a function of height for mean daytime (10 to 17 h) and nighttime conditions (22 to 5 h). Negative values indicate uptake and positive values indicate emission. The nighttime inversion was assumed to lie between 12 and 15 m (canopy top). The reference height (zref) for the inverse calculation during night was averaged over this interval. Errors associ-ated with these profiles were estimassoci-ated to be on the order of
±30%, based on a comparison of different inverse schemes (Karl et al., 2004). Fluxes as well as average exchange ve-locities are summarized in Table 5. We define an average exchange velocity as the mean and a net exchange velocity as the integral over the whole canopy. The mean daytime flux
obtained from the gradient method compares well to fluxes calculated from the eddy covariance method (Baker et al., 20051). Results from both flux measurement methods are listed in Table 5.
3.2.3 Methanol and acetone (Fig. 5 panels a and b)
During the day, methanol is predominantly emitted from loblolly pine and mostly deposited in the lower part of the canopy and to the ground (Fig. 5, panels a and b). The mean daytime flux inferred from the ILT technique was 144 ng m−2s−1 (mean temperature: 27.3◦C, mean ra-diation 1466 µmol m−2s−1 PAR) . Within the variability this agrees with results from the EC measurements of 89 ng m−2s−1. Recent observations above a deciduous fest in Germany found similar methanol emissions on the or-der of 87 ng m−2s−1(Spirig et al., 2005). At night there is significant methanol uptake, similar to what was observed above a tropical ecosystem (Karl et al., 2004). The net ex-change velocity (integral over the canopy height) was as high as −0.96 cm/s and was ∼33% of that estimated for a tropical rain forest (−2.9 cm s−1) in Costa Rica. The mean night-time exchange velocity (ev) (Table 5 was −0.30 cm s−1). The exchange velocity in the lowest layer (soil) during the day, which includes the forest floor, was −0.14 cm s−1. For
3026 T. Karl et al.: Exchange of oxygenated VOCs in the atmosphere
40
figure 8
5 10 15 20Pi
ne
S
G
-0.3 0.0 0.3 0.6 0.9 1.2A
-1.0-0.8-0.6-0.4-0.2 0.0 0.2B
MeOH Acetone 5 10 15 20Pi
ne
SG
C
an
op
y
H
ei
gh
t [
m
]
-3 -2 -1 0 1 2C
-1.2 -0.9 -0.6 -0.3 0.0 0.3D
CH3CHO AA (m/z 61+) 0.2 0.4 0.6 0 5 10 15 20Pi
ne
SG
LAI [m
2m
-2]
-0.3 0.0 0.3 0.6 0.9 1.2 1.5E
Exchange Velocity [cm s
-1]
-2.5 -2.0 -1.5 -1.0 -0.5 0.0 0.5Night
Day
F
MVK+MAC m/z 73 +Fig. 8. Inverse source/sink profiles for mean day (10:00 to 17:00) and nighttime (22:00 to 05:00) conditions calculated for methanol (MeOH), acetone (A, B), acetaldehyde (CH3CHO) , acetic acid (AA) (C, D), MVK+MAC and C3/C4carbonyls (m/z 73+)(E, F). Left panels depict
the leaf area index (LAI) for sweetgum (SG) (Liquidambar styraciflua) and loblolly pine (LP) (Pinus taeda) inferred from Stroud et al. (2005).
comparison the aerodynamic limit for nighttime deposition velocities was measured to be on the order of 1 to 2 cm s−1. The upper limit of the dry deposition velocity for methanol and acetone calculated according to Wesely (1989) would be on the order of ∼0.02 cm s−1. Air chemistry models which rely on this parameterization might therefore underestimate the effect of deposition. The acetone emission profile indi-cates that the loblolly pine stand was the main source, which was verified by plant enclosure measurements. During the night the exchange velocities suggest mostly deposition. The deposition is smaller than that of methanol, although still sig-nificant with a total net exchange velocity of −0.46 cm s−1 and a mean nighttime exchange velocity of −0.11 cm s−1 comparable to our results above a tropical rain forest.
Methanol is lost and the exchange of acetone is close to zero in the lower canopy during daytime, in contrast to leaf level measurements which demonstrated that methanol and acetone can potentially be emitted from sweetgum
(Liq-uidambar styraciflua). This indicates that the lower part of
the canopy acts as a sink for methanol rather than a source of
these compounds implying additional loss processes such as dry deposition. Understory species typically “see” less light and therefore transpiration rates and stomatal conductance were likely lower in the field resulting in lower emissions. The fact that the canopy acted as sink could be explained by a combination of small emission and dry deposition to the ground and other surfaces. It is interesting to note that the exchange rate of the more soluble/polar species methanol is significantly below 0, while the acetone exchange is close to 0.
Overall the magnitude of methanol (83–139 ng m−2s−1) and acetone emissions (31–103 ng m−2s−1) are comparable to those found in similar ecosystems. Schade and Goldstein (2001) for example reported typical daytime fluxes (T=25◦C) of ∼1.2 µg m−2s−1 and ∼97 ng m−2s−1 for methanol and acetone above a ponderosa pine (Pinus ponderosa) plan-tation. Assuming an LAI of 3–4 m2m−2 the acetone flux from a Norway spruce (Picea abies) canopy pub-lished by Cojocariu et al. (2004) would equate to 111– 139 ng m−2s−1. Methanol and acetone fluxes (T=18◦C)
T. Karl et al.: Exchange of oxygenated VOCs in the atmosphere 3027
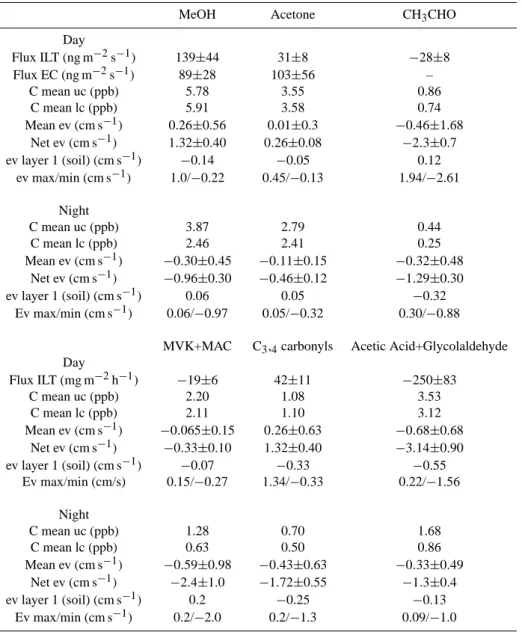
Table 5. Summary of Gradient Observations: Flux ILT (flux calculated from Inverse Lagrangian Transport Model), Flux EC (flux calculated from Eddy Covariance measurements), C mean uc (mean concentration above the canopy), C mean lc (mean concentration below the canopy top), mean ev (average exchange velocity calculated from ILT flux), net ev (net exchange velocity calculated from ILT flux), ev layer 1 (exchange velocity for layer one: ground to ∼2 m above ground) and ev max/min (maximum and minimum exchange velocity inferred from Fig. 5).
MeOH Acetone CH3CHO
Day Flux ILT (ng m−2s−1) 139±44 31±8 −28±8 Flux EC (ng m−2s−1) 89±28 103±56 – C mean uc (ppb) 5.78 3.55 0.86 C mean lc (ppb) 5.91 3.58 0.74 Mean ev (cm s−1) 0.26±0.56 0.01±0.3 −0.46±1.68 Net ev (cm s−1) 1.32±0.40 0.26±0.08 −2.3±0.7 ev layer 1 (soil) (cm s−1) −0.14 −0.05 0.12 ev max/min (cm s−1) 1.0/−0.22 0.45/−0.13 1.94/−2.61 Night C mean uc (ppb) 3.87 2.79 0.44 C mean lc (ppb) 2.46 2.41 0.25 Mean ev (cm s−1) −0.30±0.45 −0.11±0.15 −0.32±0.48 Net ev (cm s−1) −0.96±0.30 −0.46±0.12 −1.29±0.30 ev layer 1 (soil) (cm s−1) 0.06 0.05 −0.32 Ev max/min (cm s−1) 0.06/−0.97 0.05/−0.32 0.30/−0.88 MVK+MAC C3,4carbonyls Acetic Acid+Glycolaldehyde
Day Flux ILT (mg m−2h−1) −19±6 42±11 −250±83 C mean uc (ppb) 2.20 1.08 3.53 C mean lc (ppb) 2.11 1.10 3.12 Mean ev (cm s−1) −0.065±0.15 0.26±0.63 −0.68±0.68 Net ev (cm s−1) −0.33±0.10 1.32±0.40 −3.14±0.90 ev layer 1 (soil) (cm s−1) −0.07 −0.33 −0.55 Ev max/min (cm/s) 0.15/−0.27 1.34/−0.33 0.22/−1.56 Night C mean uc (ppb) 1.28 0.70 1.68 C mean lc (ppb) 0.63 0.50 0.86 Mean ev (cm s−1) −0.59±0.98 −0.43±0.63 −0.33±0.49 Net ev (cm s−1) −2.4±1.0 −1.72±0.55 −1.3±0.4 ev layer 1 (soil) (cm s−1) 0.2 −0.25 −0.13 Ev max/min (cm s−1) 0.2/−2.0 0.2/−1.3 0.09/−1.0
above a subalpine ecosystem consisting mostly of lodgepole pine (Pinus contorta) were on the order of 278 ng m−2s−1 and 139 ng m−2s−1(Karl et al., 2002b).
3.2.4 Acetaldehyde, acetic acid, MVK+MAC and m/z 73 (Fig. 5 panels c, d, e and f)
The daytime emission profile for acetaldehyde (Fig. 5, panel c) suggests mostly deposition to the canopy. The exchange velocity at the highest level is positive and could indicate en-hanced photochemical production in the surface layer. The
mean exchange velocity and the net exchange velocity during the day were −0.46 cm s−1 and −2.3 cm s−1, respectively. While previous canopy scale measurements at forested sites (Schade and Goldstein, 2001; Karl et al., 2003, 2004) showed emissions during daytime, measurements at Duke Forest sug-gest mostly uptake by the loblolly pine stand, similar to ob-servations by Rottenberger et al. (2004). The highest up-take rates correspond to the peak of the loblolly pine leaf area index (Fig. 8, Table 5). This is in contrast to our leaf level emission measurements which indicate compen-sation points (2–8 ppb) well above ambient concentrations
3028 T. Karl et al.: Exchange of oxygenated VOCs in the atmosphere
(0.86 ppb) observed during the CELTIC experiment. The reason for this discrepancy is not entirely clear but could be due to the fact that potted plants grown in a greenhouse have altered their biochemical production pathways leading to an increased emission of acetaldehyde (e.g. low light levels or anaerobic conditions due to a densely crowded root system in potted plants). Another possibility would be that processes on the canopy scale (e.g. such as dry deposition) could have increased the loss under field conditions.
We have previously concluded that m/z 61 above forested sites corresponds mostly to acetic acid with minor contri-butions from glycolaldehyde (Karl et al., 2004). Thus, we argue that acetic acid (Fig. 5, panels e and f) is mostly de-posited throughout the canopy during day and night similar to observations in other ecosystems (Kuhn et al., 2002; San-hueza et al., 1989). We inferred mean and net exchange ve-locities of −0.68 cm s−1 and −3.14 cm s−1 during the day and −0.33 cm s−1and −1.3 cm s−1during the night, respec-tively. The exchange velocities close to the ground were small. Field measurements in the past indicated that acetic acid is mostly deposited to the vegetation (e.g. Kesselmeier et al., 1998; Kuhn et al., 2002; Sanhueza et al., 1989; Staudt et al., 2000; Karl et al., 2004). Daytime deposition val-ues during this study (net ev: −3.14 cm s−1) are higher than recent results obtained above a tropical forest (net ev:
−1.9 cm s−1) in Costa Rica, but are within the range ob-served above other ecosystems. Kuhn et al. (2002) calcu-lated deposition velocity on the order of 0.18 to 0.22 cm s−1, but indicated that these might be a lower limit. Com-pared to measurements above a rainforest (mean daytime concentration:∼1 ppb) (Karl et al., 2004), the South Eastern US is more polluted with a mean acetic acid concentration on the order of ∼3.5 ppb. High deposition could be caused by a compensation point driven uptake, which would be ex-pected to be higher under more polluted conditions. On the other hand nighttime uptake is also significant, suggesting that other processes leading to the loss of acetic acid might be important.
For these compounds the dry deposition velocities calcu-lated according to Wesely (1989) would be lower in the range of 0.27 (acetaldehyde) to 0.65 (acetic acid) cm s−1during the day and 0.02 (acetaldehyde) to 0.13 (acetic acid) cm s−1 dur-ing the night.
The 1st generation oxidation products (methyl vinyl ketone (MVK)+methacrolein (MAC)) of isoprene chem-istry are mostly deposited during both the day (net ev:
−0.33 cm s−1) and night (net ev: −2.4 cm s−1). A slightly positive exchange velocity (Fig. 5, panel e) at the top of the canopy could be caused by higher photochemical production above the canopy during the day, similar to acetaldehyde. While daytime deposition of MVK+MAC (−0.33 cm s−1) is significant and comparable to measurements obtained above a tropical rain forest in Costa Rica (net ev: −0.4 cm s−1), it is roughly a factor of ten lower than values reported above a tropical rain forest in Amazˆonia using the relaxed eddy
accu-mulation technique (Andreae et al., 2002).
Gradients of C3+C4carbonyls on m/z 73 are depicted in Fig. 5 (panels e and f), which show a source at the canopy top and in the middle of the canopy during daytime; the ground acts as a sink. If the water cluster contributed a significant part of the signal at m/z 73+, positive exchange velocities would be expected throughout the canopy and negative or smaller exchange velocities would be expected at the canopy top due to a positive daytime latent heat flux. The overall exchange pattern indicates both biogenic and possibly atmo-spheric sources for compounds exhibiting m/z 73+.
4 Conclusion
We observed significant emissions of methanol and ace-tone from a loblolly pine (Pinus taeda) plantation with sweetgum (Liquidambar styraciflua) understory during the CELTIC field experiment. Leaf level measurements sup-ported these findings and were in reasonable agreement with canopy scale fluxes calculated from an Inverse Lagrangian Transport scheme. In summary our measurements support similar findings for emissions of these compounds from pre-vious studies above other ecosystems (Schade and Goldstein, 2001; Kesselmeier and Staudt, 1999; Cojocariu et al., 2004). The exchange of acetaldehyde exhibited a temperature de-pendent compensation point. Leaf level measurements of ac-etaldehyde showed compensation points (>2.2 ppb) compa-rable to a recent study with spruce (Picea abies) needles (Co-jocariu et al., 2004). Older needles had lower compensation points than younger needles, which has also been observed for tropical trees (Rottenberger et al., 2005). Canopy scale gradient measurements on the other hand showed mostly up-take suggesting much lower compensation points (<0.9 ppb). Lower compensation points in the canopy were also found by Rottenberger et al. (2004) under clean and polluted air con-ditions during the wet season in the Amazon. Two reasons could explain this discrepancy: (1) plants grown under lab-oratory conditions have altered their biochemical pathways compared to those grown under field conditions, or (2) dry deposition to surfaces plays an important role under field conditions. Observations by Cojocariu et al. (2004) indicated that leaf level measurements under field and laboratory con-ditions showed similar compensation points for spruce trees and would argue for the latter. Combined canopy and branch scale experiments under field conditions will be needed to resolve the discrepancy observed during the CELTIC exper-iment. These observations suggest that inappropriate com-parison of biogenic OVOC emissions by Singh et al. (2004) could explain part of the variability seen by these authors.
Significant uptake of MVK+MAC and acetic acid dur-ing daytime indicates that photochemical production domi-nates. All oxygenated compounds exhibited a strong noc-turnal loss, and the deposition velocities were much greater than assumed from traditional deposition schemes. Together
T. Karl et al.: Exchange of oxygenated VOCs in the atmosphere 3029
with findings from previous studies this argues that our un-derstanding of deposition is still limited and that the loss of oxygenated compounds is larger than assumed in current models.
The addition of ozone triggered the release of compounds commonly attributed to the oxidation of fatty acids. In addi-tion ions exhibited m/z ratios that would correspond to oxy-genated VOCs identified from ozonolysis at vegetation sur-faces such as acetone, 6-methyl-5-hepten-2-one and geranyl acetone (Fruekilde et al., 1998). Wildt et al. (2003) reported the presence of C6-C10 aldehydes after ozone fumigation; our measurements show mass spectral evidence of the pres-ence of aldehydes over the entire C1-C13range.
Ions corresponding to the oxygenated VOC categories (OX1-OX12) reported by Holzinger et al. (2004) were also detected and to some extent overlapped with compounds as-sociated with ozonolysis of plant tissue. Addition of ozone before and after of the plant cuvette suggested that a substan-tial amount of the OX1-OX12 species originated from the re-action of ozone inside the plant and on plant surfaces (e.g. by cleavage of fatty acids) rather than formation in the air af-ter the release of reactive af-terpenes (e.g. beta caryophellene). Our observations also indicate that certain ions (e.g. m/z 111, 127, 129 and 145) are produced predominantly from the gas phase oxidation of reactive terpenes (e.g. sesquiterpenes) as hypothesized by Holzinger et al. (2004). These oxygenated species likely have multiple sources in a canopy (ozone-plant induced production and atmospheric reactions), which need to be taken into account when calculating potential yields of very reactive compounds. The hypothesized large emission potential of very reactive terpenes (Holzinger et al., 2004) might therefore be an upper limit. While the presence of very reactive terpenes (Went, 1960) has long been recog-nized the quantification remains a challenge. The ozone in-duced production of biogenic oxygenated compounds might increase due to the expected higher ozone levels in the future and might enhance the biogenic contribution to secondary organic aerosol formation.
Acknowledgements. The Duke Forest field study was supported by
the Office of Science (BER), U.S. Department of Energy, Grant No. DE-FG02-95ER62083. The authors thank staff at the Duke FACE site for their assistance and support. We also thank J. Fuentes for helpful discussions. B. Baker and K. Jardine were supported by NSF Grant ATM-0131785. The National Center for Atmospheric Research is sponsored by the National Science Foundation. This work was also funded by EPA. We thank C. Geron as project officer. Edited by: J. Kesselmeier
References
Andreae, M. O., Artaxo, P., Brandao, C., Carswell, F. E., Ciccioli, P., da Costa, A. L., Culf, A. D., Esteves, J. L., Gash, J. H. C., and Grace, J.: Biogeochemical cycling of carbon, water, energy, trace gases, and aerosols in Amazonia: The LBA-EUSTACH
experiments, J. Geophys. Res., 107 (Part 20 Part 20), LBA 33, doi:10.1029/2001JD000524, 2002.
Baldocchi, D.: Flux footprints within and over forest canopies, Boundary-Layer Meteorology, 85(2), 273–292, 1997.
Calogirou, A., Larsen, B., and Kotzias, D.: Gas-phase terpene ox-idation products: a review, Atmos. Environ., 33, 1423–1439, 1999.
Cojocariu, C., Escher, P., Haberle, K. H., Matyssek, R., Rennen-berg, H., and Kreuzwieser, J.: The effect of ozone on the emis-sion of carbonyls from leaves of adult Fagus sylvatica, Plant Cell and Environment, 28(5), 603–611, 2005.
Cojocariu, C., Kreuzwieser, J., and Rennenberg, H.: Correlation of short-chained carbonyls emitted from Picea abies with phys-iological and environmental parameters, New Phytologist, 162, 717–727, 2004.
de Gouw, J., Warneke, C., Karl, T., Eerdekens, G., van der Veen, C., and Fall, R.: Sensitivity and specificity of atmospheric trace gas detection by proton-transfer-reaction mass spectrometry, In-ternational Journal of Mass Spectrometry, 223(1–3), 365–382, 2003a.
de Gouw, J. A., Goldan, P. D., Warneke, C., Kuster, W. C., Roberts, J. M., Marchewka, M., Bertman, S. B., Pszenny, A. A. P., and Keene, W. C.: Validation of proton transfer reaction-mass spec-trometry (PTR-MS) measurements of gas-phase organic com-pounds in the atmosphere during the New England Air Quality Study (NEAQS) in 2002, J. Geophys. Res., 108(D21), 2003b. Fall, R.: Biogenic emissions of volatile organic compounds from
higher plants, in: Reactive hydrocarbons in the atmosphere, edited by: Hewitt, C. N., Academic Press, New York, 41–96, 1999.
Fall, R.: Abundant oxygenates in the atmosphere: A biochemical perspective, Chemical Reviews, 103, 4941–4951, 2003. Fall, R. and Benson, A.: Leaf methanol – the simplest natural
prod-uct from plants, Trends Plant Sci., 1, 296–301, 1996.
Fall, R., Karl, T., Hansel, A., Jordan, A., and Lindinger, W.: Volatile organic compounds emitted after leaf wounding: On-line analy-sis by proton-transfer-reaction mass spectrometry, J. Geophys. Res., 104(D13), 15 963–15 974, 1999.
Farquhar, G. D., Caemmerer, S. V., and Berry, J. A.: A Biochemical-Model of Photosynthetic Co2 Assimilation in Leaves of C-3 Species, Planta, 149(1), 78–90, 1980.
Fruekilde, P., Hjorth, J. N. R., Kotzias, D., and Larsen, B.: Ozonol-ysis at vegetation surfaces: A source of acetone, 4-oxopentanal, 6-methyl-5-hepten-2-one and geranyl acetone, Atmos. Environ., 32(11), 1893–1902, 1998.
Galbally, I. E. and Kirstine, W.: The Production of Methanol by Flowering Plants and the Global Cycle of Methanol, J. Atmos. Chem., 43(3), 35, 2002.
Geron, C., Rasmussen, R., Arnts, R. R., and Guenther, A.: A re-view and synthesis of monoterpene speciation from forests in the United States, Atmos. Environ., 34(11), 1761–1781, 2000. Graus, M., Schnitzler, J. P., Hansel, A., Cojocariu, C.,
Rennen-berg, H., Wisthaler, A., and Kreuzwieser, J.: Transient release of oxygenated volatile organic compounds during light-dark transi-tions in grey poplar leaves, Plant Physiology, 135(4), 1967–1975, 2004.
Guenther, A., Hewitt, C. N., Erickson, D., and Fall, R.: A global model of natural volatile organic compound emissions, J. Geo-phys. Res., 100(D/5), 8873–8892, 1995.