HAL Id: hal-00303222
https://hal.archives-ouvertes.fr/hal-00303222
Submitted on 4 Jan 2008HAL is a multi-disciplinary open access
archive for the deposit and dissemination of sci-entific research documents, whether they are pub-lished or not. The documents may come from teaching and research institutions in France or abroad, or from public or private research centers.
L’archive ouverte pluridisciplinaire HAL, est destinée au dépôt et à la diffusion de documents scientifiques de niveau recherche, publiés ou non, émanant des établissements d’enseignement et de recherche français ou étrangers, des laboratoires publics ou privés.
Measurements of UV radiation on rotating vertical
plane at the ALOMAR Observatory (69° N, 16° E),
Norway, June 2007
P. Sobolewski, J. W. Krzy?cin, J. Jaros?awski, K. Stebel
To cite this version:
P. Sobolewski, J. W. Krzy?cin, J. Jaros?awski, K. Stebel. Measurements of UV radiation on rotating vertical plane at the ALOMAR Observatory (69° N, 16° E), Norway, June 2007. Atmospheric Chem-istry and Physics Discussions, European Geosciences Union, 2008, 8 (1), pp.21-45. �hal-00303222�
ACPD
8, 21–45, 2008 Measurements of UV radiation on rotating vertical plane P. Sobolewski et al. Title Page Abstract Introduction Conclusions References Tables Figures ◭ ◮ ◭ ◮ Back CloseFull Screen / Esc
Printer-friendly Version Interactive Discussion
EGU Atmos. Chem. Phys. Discuss., 8, 21–45, 2008
www.atmos-chem-phys-discuss.net/8/21/2008/ © Author(s) 2008. This work is licensed
under a Creative Commons License.
Atmospheric Chemistry and Physics Discussions
Measurements of UV radiation on rotating
vertical plane at the ALOMAR
Observatory (69
◦
N, 16
◦
E), Norway, June
2007
P. Sobolewski1, J. W. Krzy ´scin1, J. Jarosławski1, and K. Stebel2
1
Institute of Geophysics, Polish Academy of Science, Warsaw, Poland
2
Norwegian Institute for Air Research, Kjeller, Norway
Received: 4 December 2007 – Accepted: 4 December 2007 – Published: 4 January 2008 Correspondence to: J. W. Krzy´scin ([email protected])
ACPD
8, 21–45, 2008 Measurements of UV radiation on rotating vertical plane P. Sobolewski et al. Title Page Abstract Introduction Conclusions References Tables Figures ◭ ◮ ◭ ◮ Back CloseFull Screen / Esc
Printer-friendly Version Interactive Discussion
EGU
Abstract
Erythemaly weighted UV and total UVA irradiance measured at the ALOMAR (Arc-tic Lidar Observatory for Middle Atmosphere Research; 69◦N, 16◦E) in June 2007 by two Kipp & Zonen UV broadband meters type, UV-S-AE-T, are examined. One unit is movable and mounted to rotating vertical plane, and the other is permanently fixed
hor-5
izontally. The UV broadband meters measure simultaneously to allow the comparison of UV irradiances on vertical and horizontal plane. The entire range of relative expo-sure variations during clear-sky conditions over ALOMAR is examined using STAR and Radonic1 model (developed at the Meteorological Institute, Munich) for various action spectra (erythema, UVA, and vitamin D3). It seems that multiplication of the daily mean
10
dose from a standard broadband meter placed horizontally by 0.5 gives reasonable estimation of the daily mean exposure on a vertical plane randomly oriented towards Sun. The extreme value and daily variability of relative exposure are the highest for UVA, next for UVB, then for vitamin D3weighed UV irradiance. The minima of relative exposure (∼0.20–0.30) are almost the same for all weighting functions. Specific cloud
15
configuration could lead to significant enhancement of UV relative exposure of rotating plane being the most pronounced when biometer is in shadow. A statistical model is proposed, that it is able to simulate vitamin D3 weighted UV irradiances on vertical
surface using explanatory variables: erythemal and total UVA irradiance from standard (horizontal) observations by Kipp & Zonen dual band biometer, the orientation of
verti-20
cal plane, solar zenith angle, and column amount of total ozone. Statistical model will allow to reconstruct (or monitor) vitamin D3 weighted UV irradiances using available
past (or actual) data.
1 Introduction
The ozone depletion in the atmosphere over mid and high latitude regions of the globe
25
ACPD
8, 21–45, 2008 Measurements of UV radiation on rotating vertical plane P. Sobolewski et al. Title Page Abstract Introduction Conclusions References Tables Figures ◭ ◮ ◭ ◮ Back CloseFull Screen / Esc
Printer-friendly Version Interactive Discussion
EGU The inverse relation of column amount of ozone (total ozone) with solar UV-B reaching
the Earth’s surface triggered many studies of the ozone and surface UV variability and led to establishing the ozone and UV global observing network. Monitoring of surface UV is of a special importance because of recognized wide adverse effects of excessive doses on human beings (e.g. sunburn, snow blindness, non-melanoma skin
5
cancer, cataracts, suppression of immune system etc.). However, there are relatively few good effects of UV radiation penetrating human body. It is well known that exposure to small amounts of UV-B radiation is essential for synthetizing of vitamin D3 in the skin. It is estimated that approximately 90–95% of human intake of vitamin D3comes
from the solar exposure, Holick et al. (2004). Epidemiological data convince that low
10
blood vitamin D3level is correlated to breast cancer, prostate cancer, multiple sclerosis, diabetes, osteoroporosis, rickets in children, etc., Holick et al. (2004).
The UV irradiance is measured routinely at many places all over the world using broadband instruments and/or spectral radiometers. For public information only UV radiation, which is weighted by the erythemal action spectrum defined by McKinlay
15
and Diffey (1987), is provided in terms of the so-called UV index (WMO, 1994) being integral of biologically weighted UV irradiance measured (or derived from a model) on a horizontal surface. However, such standard does not take into account highly variable orientation of human body relative to solar radiation. Parts of human body may be horizontal (e.g., arm), tilted (face), vertical (ears), and facing the ground (chin). Thus
20
an investigation of UV effects on human needs approach that allows to calculate (or measure) weighted UV irradiance on arbitrarily oriented surfaces.
All routinely measured and model calculated erythemally weighted UV values were reported for horizontal surfaces that assumed also weighting according to the cosine of solar zenith angle (SZA). Measurements of irradiance on tilted surfaces were carried
25
out for only few location during short-period campaigns (Schauberger, 1990, 1992; Mc Kenzie et al., 1997; Wester and Josefsson, 1997; Parisi and Kimlin, 1999; Webb et al., 1999; and Oppenrieder et al., 2004). To have more comprehensive description of bio-logical UV-effects on arbitrarily oriented surfaces, a numerical model was developed at
ACPD
8, 21–45, 2008 Measurements of UV radiation on rotating vertical plane P. Sobolewski et al. Title Page Abstract Introduction Conclusions References Tables Figures ◭ ◮ ◭ ◮ Back CloseFull Screen / Esc
Printer-friendly Version Interactive Discussion
EGU the Meteorological Institute, University of Munich, Mech and Koepke (2004). The model
was validated by comparing the results with earlier measurements by Schauberger (1990), Webb et al. (1999), and Oppenrieder et al. (2004). Koepke and Mech (2005) used the model to examine variability of erythemal weighted solar UV with atmospheric and ground properties.
5
An alternative approach of examination of UV exposure on the human body was application of polysulphone (PS) film badges placed on manikin in an upright position, e.g., Kimlin and Schallhorn (2004), Downs and Parisi (2007). PS film has a response to UV radiation similar to human skin and changes in its absorbency at 330 nm were calibrated to the erythemally weighted doses. Data from selected anatomical location
10
usually were normalized to corresponding exposure for ambient horizontal plane using the approximation of Diffey (1989).
Main objective of this paper is an examination of relative UV exposure on rotating vertical plane (being a crude approximation of human face randomly oriented towards Sun) in the Arctic during polar day. Results of the measurement carried out at the
15
ALOMAR observatory (69◦N, 16◦E, 390 m a.s.l.) in the period 1–15 June 2007 are an-alyzed to find relation between UV irradiances simultaneously measured on horizontal and rotating vertical plane (Sect. 2). Section 3 contains results of simulations of bi-ologically weighted UV irradiance on inclined surfaces for clear-sky conditions at the ALOMAR observatory. Conclusions are presented in Sect. 4.
20
2 Measurements
2.1 Biometer and calibration
The UV measurements at the ALOMAR observatory, located near Andenes (Norway), are carried by two Kipp & Zonen (K&Z) dual band biometers, UV-S-AE-T, in the period 1–15 June 2007. Each sensor measures both UVA and erythemal irradiance with two
25
sta-ACPD
8, 21–45, 2008 Measurements of UV radiation on rotating vertical plane P. Sobolewski et al. Title Page Abstract Introduction Conclusions References Tables Figures ◭ ◮ ◭ ◮ Back CloseFull Screen / Esc
Printer-friendly Version Interactive Discussion
EGU bilized at 25◦C. Figure 1 shows the measuring setup. Rotor system allows to change
position of the biometer placed on vertical plane. The other biometer is permanently fixed horizontally to provide a reference irradiance for the measurements on vertical plane. Scanning is done for 8 prescribed azimuth angles φ=0◦, 45◦, 90◦, 135◦, 180◦,
225◦, 270◦, and 315◦. The vertical plane is moved forward in 45◦ steps starting from
5
φ=0◦ and ending at φ=315◦. For each position there are 3 scans with 1-min interval. Clockwise turning to the next position takes ∼30 s. After measurement at the posi-tion φ=315◦, the vertical biometer starts turning back to the position φ=0◦ that takes ∼6 min. During back rotation 6 scans are done at random azimuth angles.
The instrument mounted on rotating plane has been calibrated at the ultraviolet
cal-10
ibration centre in Davos, Switzerland, in August 2006 (H ¨ulsen and Gr ¨obner, 2007). It was found that our K&Z biometer has almost perfect cosine response. As a result of the calibration a matrix of specific instrument’s values (in (W/m2)/V) is obtained. The matrix elements depend on solar zenith angle (SZA) and the total amount of ozone. To use the calibration matrix for UV measurements at ALOMAR, the position of Sun
15
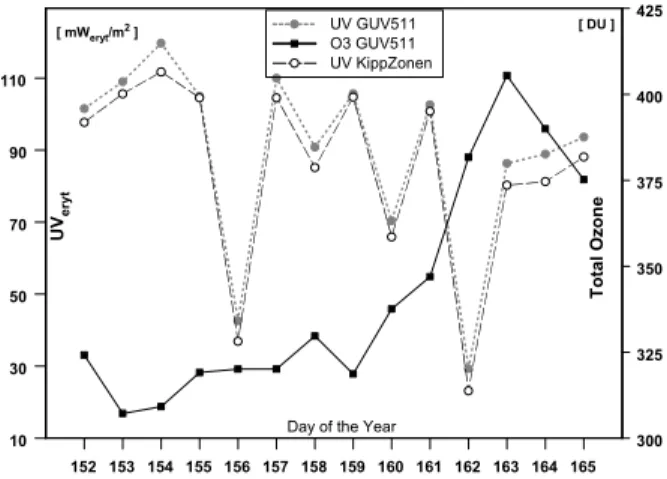
is calculated by an astronomical algorithm and total ozone data are taken from mea-surements by broad-band instrument, GUV511, routinely operated at the ALOMAR observatory. Using SZA at time of observations and measured total ozone (Fig. 2), the values of the calibration matrix are calculated by bi-linearly interpolation between the matrix SZA and total ozone grid elements.
20
The horizontal biometer has been compared with that previously calibrated at the Davos observatory during their simultaneous measurements at Central Geophysical Observatory of the Institute of Geophysics, Polish Academy of Sciences, Belsk (52◦N, 21◦E) Poland, in September 2007. A ratio between output of two K&Z instruments, which is assumed to be a function of SZA, has been calculated and applied to
irra-25
diances measured by the horizontal biometer at the ALOMAR observatory. Figure 2 shows a relation between daily maxima of erythemally weighted irradiances at horizon-tal surface for our K&Z instrument and GUV511 meter routinely collecting UV data at ALOMAR. The mean difference between output of these instruments is ∼6% ±5%. The
ACPD
8, 21–45, 2008 Measurements of UV radiation on rotating vertical plane P. Sobolewski et al. Title Page Abstract Introduction Conclusions References Tables Figures ◭ ◮ ◭ ◮ Back CloseFull Screen / Esc
Printer-friendly Version Interactive Discussion
EGU deviation for high quality measurements with horizontal erythemaly weighted
broad-band instruments were found within 8% (Leszczynski et al., 1995). Thus, it seems that our horizontal unit provides valuable data in spite of lack of its own calibration matrix.
K&Z biometer provides integrated UV irradiance over the wavelength range 320– 400 nm, i.e., integrated UVA part of solar UV spectrum being insensitive to ozone
5
changes. For calculation of UVA irradiance in absolute unit (W/m2) we use the cal-ibration constant provided by the manufacturer. Quality of the UVA measurements by our biometer needs further check with use of a well calibrated spectrophotometer. Thus, results of UVA measurements in absolute units should be treated with caution. However, absolute calibration of the instrument is a minor problem because we are
10
mostly focused on comparison between readings of the horizontal and vertical unit. During the intercomparison of biometers at the Belsk observatory after the ALOMAR campaign, the ratio between UVA output of our biometers has been calculated in de-pendence of SZA. The ratio is used for recalculation of UV irradiances measured by horizontal biometer at the ALOMAR observatory. Figure 3 shows time series of UVA
15
measurements by K&Z biometers, for example, on 10 June (heavy clouds throughout whole day) and on 11 June (broken clouds). Using results of the simultaneous mea-surements of total (over whole solar spectral range, 300–3000 nm) solar irradiance at ALOMAR by a standard pyranometer it can be estimated that during those days inte-grated UVA irradiance at horizontal surface represents ∼5% of total solar irradiance,
20
i.e., close to the well-known value of UVA fraction in total solar radiation. 2.2 Vertical versus horizontal biometer data
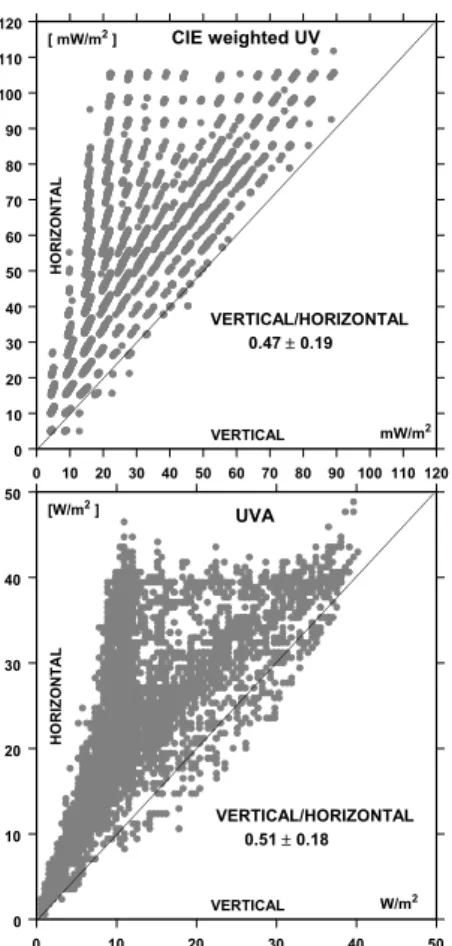
Figure 4 shows a correspondence between irradiances measured by the vertical and horizontal unit for erythemally weighted and integrated UVA irradiance, respectively, for all simultaneous measurements at the ALOMAR observatory in the period 1–15 June,
25
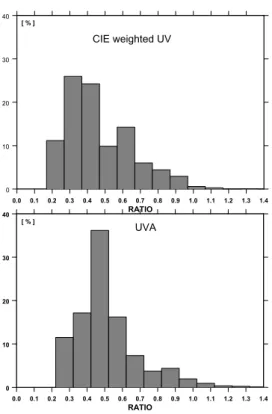
2007. The output by vertical unit is usually smaller than that from horizontal unit. The mean ratio of output by vertical to horizontal unit is 0.47±0.19 (erythemaly weighted UV) and 0.51±0.18 (UVA). Figure 5 illustrates the histogram of relative exposure, i.e.,
ACPD
8, 21–45, 2008 Measurements of UV radiation on rotating vertical plane P. Sobolewski et al. Title Page Abstract Introduction Conclusions References Tables Figures ◭ ◮ ◭ ◮ Back CloseFull Screen / Esc
Printer-friendly Version Interactive Discussion
EGU ratio between irradiance on vertical plane to corresponding irradiance on horizontal
surface. The distribution of the relative exposures differs for the erythemal and inte-grated UVA irradiance. The UVA relative exposure has a narrow peak around 50% and long tail (up to 130%) towards high relative exposures.
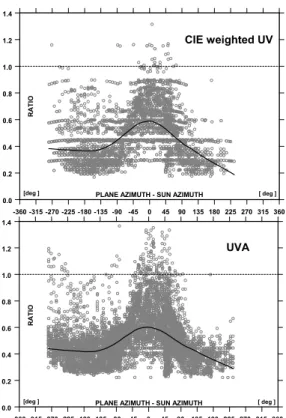
Figure 6 presents a dependence of the relative exposure on relative azimuth, i.e.,
5
difference between plane azimuth φplaneand Sun azimuth φSun. Large negative values
of the relative azimuth are, for example, when the vertical unit is faced towards the north or north/east (φplane=0◦ or 45◦) and Sun azimuth is φ
Sun=315◦ (west/north). Large
positive values of the relative differences are, for example, when the vertical unit is faced towards the west/north direction (φplane=315◦ ) and Sun azimuth is φSun=45◦.
10
Cases when Sun azimuth is ∼0◦ are not considered because of too low solar intensity
and thus not reliable readings of the biometers. We assume a threshold of 5 mW/m2for erythemal irradiance on the horizontal plane corresponding to exposure at SZA ≈80◦– 85◦. It is seen that large values of the relative exposure appear when rotating plane is directed towards Sun and Sun is not obscured by clouds.
15
For overcast conditions with dense clouds (opaque Sun disk), the relative exposure is close to values found when the rotating plane is in shadow. The variability of irradi-ance measured on vertical plane is nearly independent of its azimuth because the UV radiation consists of diffuse radiation being close to homogeneous during overcast con-ditions. Similar findings concerning variability of erythemally weighted UV over inclined
20
surface were discussed by Oppenrieder et al. (2004).
The mean pattern of the relative exposure (see solid curves in Fig. 6) is not symmet-ric against the line of relative azimuth, φplane− φSun, equal to 0. It is because a case
with large negative relative azimuth comprises conditions when the plane is illuminated by the direct sun radiation (e.g. φplane=0◦and φSun>270◦). Sometimes large
enhance-25
ment of UV exposure appears when the rotating biometer is in shadow. It is possible that the relative exposure of rotating biometer being in shadow, i.e., absolute value of relative azimuth of vertical plane exceeds 90◦, is about twice as much as that measured under clear-sky and overcast conditions (∼0.5). This effect is most pronounced for the
ACPD
8, 21–45, 2008 Measurements of UV radiation on rotating vertical plane P. Sobolewski et al. Title Page Abstract Introduction Conclusions References Tables Figures ◭ ◮ ◭ ◮ Back CloseFull Screen / Esc
Printer-friendly Version Interactive Discussion
EGU UVA measurements. It is probably cause by a specific cloud configuration yielding
in-coming of additional portion of sky radiance on the vertical plane due to multireflections of direct sun radiation by clouds.
3 Model results
3.1 Radiative transfer model
5
The irradiance on a plane with arbitrarily orientation is modeled by integration of ra-diances weighted according to the cosine of the angle between direction of every in-coming radiance and the plane normal. This is done by Rodonic1 model developed by Mech and Koepke (2004). The radiances are modeled with STAR, System for Transfer of Atmospheric Radiation (Ruggaber et al., 1994; Schwander et al., 2000), which is
10
known to be of high quality (Koepke et al., 1998). The quality of the model irradiances on vertical surfaces has been corroborated by an automatic measuring system, Angle SCAanning RAdiometer for determination of erythemally weighted irradiance on TIlted Surfaces (ASCARATIS), that was developed by the Meteorological Institute and the Institute of Outpatient Clinic for Occupational and Environmental Medicine in Munich
15
(Oppenrieder et al., 2004; Mech and Koepke, 2004).
The ratio between clear-sky irradiance on vertical and normal plane, and horizontal surface is calculated for two days; 21 March and 21 June 2007 with time step of 20-min. Selected azimuths for the model calculations on vertical plane correspond to those programmed for the rotor working at the ALOMAR observatory, i.e., φplane= 0◦,
20
45◦, 90◦,135◦, 180◦, 225◦, 270◦, and 315◦. For each orientation of a hypothetical plane: vertical, normal (plane normal towards Sun position, i.e., such plane moves like typical sun tracker), and horizontal, the model is run for the column ozone amounts varying from 200 DU to 550 DU with step 25 DU. Climatological values for the pressure levels, temperature, humidity, and ozone profile are selected. Continental averaged aerosol
25
ACPD
8, 21–45, 2008 Measurements of UV radiation on rotating vertical plane P. Sobolewski et al. Title Page Abstract Introduction Conclusions References Tables Figures ◭ ◮ ◭ ◮ Back CloseFull Screen / Esc
Printer-friendly Version Interactive Discussion
EGU The surface albedo of 0.03 is also assumed. Erythemal action spectrum (McKinlay and
Diffey, 1987), vit. D3action spectrum (CIE, 2007), and integrated UVA irradiance (320–
400 nm) are considered. Figure 7 shows the pattern of the UV weighting functions used.
Table 1 summarizes statistical characteristics of the relative exposure on
in-5
clined surfaces during clear-sky condition for erythema, vit. D3, and UVA (UVA=1 if
320<λ<400 nm and 0 elsewhere) weighting functions. The highest maxima and vari-ability of relative exposure (in terms of a distance between maximum and minimum) are for UVA, next for UVB, then for vit. D3 weighted irradiance. The minima (∼0.20–0.30)
are almost the same. If the most significant part of action spectrum is more shifted
10
towards longer wavelengths then there is a larger chance for appearance of relative exposure >1 under clear-sky conditions.
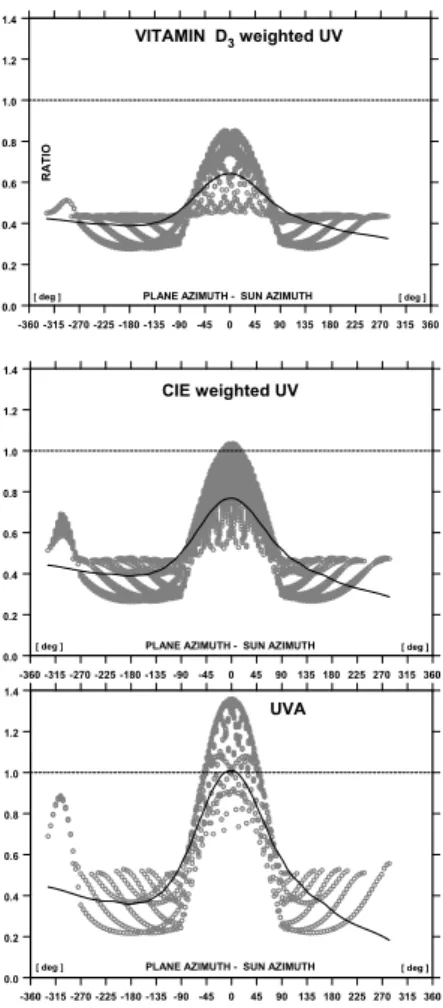
Figure 8 illustrates the modeled erythema, vit. D3, and UVA weighted irradiances
on vertical surface normalized by the irradiances calculated on horizontal surface as a function of relative azimuth. The relative exposure decreases with increasing angle
15
relative to the Sun azimuth. The secondary maximum around the relative azimuth of about −300◦ corresponds to illumination of vertical plane directed northward by the
solar disc located somewhere between the northern and western direction. Vit. D3
weighted UV on vertical surface never exceeds value measured on horizontal surface and reaches ∼0.8 at maximum. The relative exposure exceeding 1 are most frequent
20
for the integrated UVA irradiance. It is worth noting that the model does not yield enhancements during clear-sky conditions when the rotating plane is in shadow. Thus the enhancements seen in Fig. 6 are probably results of the cloud reflection.
3.2 Statistical model
Standard UV irradiance measurements are carried out by broadband instruments
25
(biometers) and spectrophotometers mounted on horizontal surface. At numerous sites biometers have started monitoring of erythemaly weighted UV since early 1990s (WMO, 2007). It is possible to weight UV irradiance by any action spectrum using
spec-ACPD
8, 21–45, 2008 Measurements of UV radiation on rotating vertical plane P. Sobolewski et al. Title Page Abstract Introduction Conclusions References Tables Figures ◭ ◮ ◭ ◮ Back CloseFull Screen / Esc
Printer-friendly Version Interactive Discussion
EGU tral measurements but such instrument are much expensive, thus less frequent in the
UV observing network. To estimate more precisely risk of UV overexposure (causing, for example, harmful sunburn) or underexposure (leading to lack of vit. D3 in human
body) we need information of weighted UV irradiance on arbitrarily oriented surfaces because of highly variable orientation of human body relative to solar radiation. There
5
are case studies or short campaigns focusing on insolation over various parts of hu-man body that is inferred from PS badges attached to hu-manikin (e.g., Downs and Parisi, 2007) or human beings (e.g., Siani et al., 2007). Monitoring of human UV exposure over longer periods and over many sites is complex issue. There is possibility to es-timate weighted UV irradiance on inclined surfaces using the radiative transfer model
10
as it is discussed in previous section. However, the model is based on rather time con-suming procedures and required detailed input data that are sometimes unavailable, for example, ozone profile, albedo, aerosol properties, etc. Based on results shown in Sect. 2 (Figs. 3 and 4) and Sect. 3 (Table 1) we can assume, as a first approximation, that the daily mean of erythemaly weighted and integrated UVA irradiance for randomly
15
oriented vertical plane is half of that measured on horizontal surface.
A question arises if irradiance collected at rotating vertical plane has something to do with real erythemal exposure of the human face. Recently Downs and Parisi (2007) developed a three dimensional computer model of the human face based on the PS dosimeter measurements on a manikin headform. The headform was placed on a
20
rotating platform (two revolutions every min) in a vertical position. Averaging relative erythemal exposures measured on selected locations throughout the whole manikin face, which were shown in their Table 2, we estimate that the daily mean of relative erythemal exposure is ∼0.49, i.e., close to our estimate. Thus, daily average of ery-themal exposure measured on a rotating plane provides reasonable estimate of daily
25
exposure of the human face randomly oriented towards Sun.
Presently there are a lot of concern about healthy level of UV exposure, i.e., enough to get proper level of vit. D3but without risk of overexposure leading to serious skin
ACPD
8, 21–45, 2008 Measurements of UV radiation on rotating vertical plane P. Sobolewski et al. Title Page Abstract Introduction Conclusions References Tables Figures ◭ ◮ ◭ ◮ Back CloseFull Screen / Esc
Printer-friendly Version Interactive Discussion
EGU weighted irradiances on vertical plane from standard measurements by broadband
in-struments placed on a horizontal orientation. Here we examine if a statistical model is able to estimate vit. D3weighted UV on vertical plane using following input
parame-ters (model explanatory variables): erythemal UV and integrated UVA on a horizontal surface, total ozone, relative azimuth, SZA. First two variables can be obtained from
5
standard measurements by K&Z dual band biometer. Global distribution of total ozone is provided by satellite observations. Sun azimuth and SZA are calculated by standard astronomical formulas.
A statistical model of vit. D3 weighted irradiance on vertical plane as a function of
above mentioned input variables is proposed. The model is trained using results of
10
numerical simulations described in Sect. 3.1. Optimal combination of input variables is selected using two-way interaction version of multivariate adaptive regression splines (MARS) technique (Friedman, 1979). We apply the data-mining approach testing as many potential explanatory time series. Finally MARS chooses only input variables ex-plaining most of the model variance. MARS technique appeared very successful when
15
searching for a variability of the global ozone long-term pattern over the period 1978– 2003, Krzy´scin (2006). The model explains ∼94% of the variance of the predicted variable, i.e., vit. D3 weighted UV on vertical surface calculated from radiative transfer
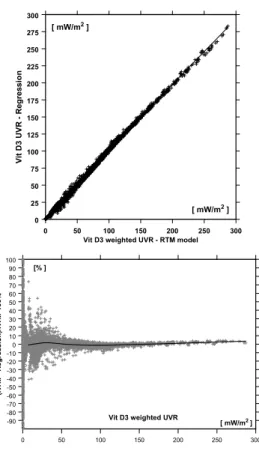
model (RTM) simulations under clear-sky conditions. Figure 9 (top) represents a scat-ter plot of vit. D3weighted UV irradiance from MARS regression versus corresponding
20
RTM calculation. Figure 9 (bottom) shows relative differences between RTM and statis-tical model values in percent of RTM values. The mean value of the relative differences is 0.02. For vit. D3weighted UV almost all relative differences are within ±10% range if we consider sample with exposure exceeding 5 mW/m2. Thus, it is possible to esti-mate vit. D3weighted irradiance on vertical plane from standard measurement by K&Z
25
dual band biometer if SZA does not exceed ∼80◦. The statistical model is much more
accurate if erythemal UV and integrated UVA exposures on vertical surface, instead of those measured on horizontal surface, are taken as the model regressors. In such case all relative differences are within ±5% range. For heavy clouds obscuring Solar
ACPD
8, 21–45, 2008 Measurements of UV radiation on rotating vertical plane P. Sobolewski et al. Title Page Abstract Introduction Conclusions References Tables Figures ◭ ◮ ◭ ◮ Back CloseFull Screen / Esc
Printer-friendly Version Interactive Discussion
EGU disk it seems reasonable that vit. D3 weighted irradiance on vertical plane is roughly
50% of that measured on horizontal surface.
4 Conclusions
The results presented here corroborate previous finding that for determination risk of both UV overexposure and underexposure one needs to consider not only weighted UV
5
irradiance measured on a horizontal surface (ambient UV) but also UV variability on in-clined surfaces. Recently, erythemal and vit. D3 weighted UV irradiance have been
considered with regard to anatomical distribution of solar exposure. Here we examine also integrated UVA irradiance and focus on differences in variability of UV irradiance on rotating vertical plane due to different biological weighting of UV irradiation. The
10
daily sum of relative exposures from all measurements on rotating vertical plane seems to approximate the mean relative exposure of a human face randomly oriented towards Sun. Multiplication of the daily mean dose from standard broadband and spectropho-tometer measurements on a horizontal plane by 0.5 gives reasonable estimation of the daily mean exposure of a vertical plane randomly oriented towards Sun. The highest
15
exposures and daily variability of relative exposure (in terms of distance between max-imum and minmax-imum ) are for UVA, next for UVB, then for vit. D3weighting. The minima of relative exposure (∼0.20–0.30) are almost the same for all weighting functions. If the most significant part of action spectrum is more shifted towards longer wavelengths, then there is larger chance for appearance of relative exposure exceeding 1.
Spe-20
cific cloud configuration could lead to significant enhancement of relative exposure of rotating plane, up to ∼200% when the rotating biometer is in shadow.
The results of statistical model to simulate vit. D3 weighted UV on vertical surface from erythemal and integrated UVA measurements (output of K&Z dual band biometr) on horizontal plane support that K&Z instrument is able to provide also vit. D3weighted
25
data on a vertical plane for any azimuth angle. The conversion from the erythemal to vit. D3weighted irradiances is much better if we use the biometer data from
measure-ACPD
8, 21–45, 2008 Measurements of UV radiation on rotating vertical plane P. Sobolewski et al. Title Page Abstract Introduction Conclusions References Tables Figures ◭ ◮ ◭ ◮ Back CloseFull Screen / Esc
Printer-friendly Version Interactive Discussion
EGU ments taken at vertical plane as the statistical model input. Thus, there is possibility
to reconstruct backward in time (or monitor) vit. D3 weighted irradiance on a rotating vertical plane based on past (or actual) observations by standard biometer. Recog-nizing importance of the measurements on inclined surfaces we decide to set up at Belsk, Poland, in August 2007, all year round observations of relative exposure, using
5
the same system of the biometers as that operated at the ALOMAR Observatory.
Acknowledgements. Access to the ALOMAR Observatory facilities has been provided under
the project ,,ALOMAR eARI (contract number RITA-CT -2003-506208). This project received research funding from the European Community’s 6th Framework Programme. This study is also financed by a project grant N30700531/04952 awarded by the Polish Ministry of Sciences
10
and Higher Education as a support to COST-726 project. We also thank the Meteorological Institute, Ludwigs Maximilians-Universitet, Munich (P. Koepke and M. Mech) for source codes of radiative transfers models (STAR and Radonic1).
References
CIE (Commision Internationalle de L’Eclairage): Technical report: Action spectrum for the
pro-15
duction of previtamin D3in human skin, CIE 174:2006, 1–12, 2006.
Diffey, B. L.: Ultraviolet radiation dosimetry with polysulphone film, Radiation measurements in Photobiology, edited by Diffey, B. L., 135–159, Academic Press, London, 1989.
Downs, N. and Parisi, A.: Three dimensional visualization of solar UV exposure to the human face, Photochem. Photobiol. Sci., 6, 90–98, 2007.
20
Friedman, J. H.: Multivariate adaptive regression splines, The Annals of Statistics, 19, 1–50, 1991.
Holick, M. F.: Sunlight and vitamin D for bone health and prevention of autoimmune diseases, cancers, and cardiovascular disease, Am. J. Clin. Nutr., 80, 1678S–1688S, 2004.
H ¨ulsen, G. and Gr ¨obner, J.: Results from the PMOD/WRC-COST726 broadband
intercompar-25
ison campaign, Proceedings of the UV conference “One century of UV radiation research”, edited by Gr ¨obner J., Davos, Switzerland, 61–62, 2007.
Kimlin, M. G. and Schallhorn, K. A.: Estimation of human vitamin D UV exposure in the USA, Photochem. Photobiol. Sci., 3, 1067–1070, 2004.
ACPD
8, 21–45, 2008 Measurements of UV radiation on rotating vertical plane P. Sobolewski et al. Title Page Abstract Introduction Conclusions References Tables Figures ◭ ◮ ◭ ◮ Back CloseFull Screen / Esc
Printer-friendly Version Interactive Discussion
EGU
Koepke, P., Bais, A., Buchwitz, D.B.M., Backer, H.D., Cabo, X.D., Eckert, P., Eriksen, P., Gillotay D., Heikkilae, A., Koskela, T., apeta, B., Lityska, Z., Lorente, J., Mayer, B., Renaud, A., Ruggaber, A., Schauberger, G., Seckmeyer, G., Seifert, P., Schmalwieser, A., Schwander, H., Vanicek, K., and Weber, M.: Comparison of models used for UV index calculations, Photoch. Photobio., 67(6), 657–662, 1998.
5
Koepke, P. and Mech, M.: UV irradiance on arbitrarily oriented surfaces: variations with atmo-spheric and ground properties, Theor. Appl. Climatol.,81, 25–32, 2005.
Krzy´scin, J. W.: Change in ozone depletion rates beginning in the mid 1990s: trend analyses of the TOMS/SBUV merged total ozone data, 1978–2003, Ann. Geophys., 24, 493–502, 2006,
http://www.ann-geophys.net/24/493/2006/.
10
Leszczynski, K., Jokela, K., Ylianttila, L., Visuri, R., and Blumthaler, M.: Report of the WMO/STUK intercomparison of erythemally-weighted solar UV radiometers, Rep. 112, World Metorological Organization, Helsinki, Finland, 1995.
McKenzie, R. L., Paulin K. J., and Kotkamp, M.: Erythemal UV irradiance at Lauder, New Zealand: relationship between horizontal and normal incidence, Photochem. Photobiol.,
15
60(5), 683–689, 1997.
McKenzie, R. L.: UV radiation climatology and trends, Proceedings of the UV conference “One century of UV radiation research”, edited by Gr ¨obner, J., Davos, Switzerland, 13–14, 2007. McKinlay, A. F. and Diffey, B. L.: A reference action spectrum for ultraviolet induced erythema
in human skin, CIE Journal, 6(1),17–22, 1987.
20
Mech, M. and Koepke, P.: Model for UV irradiance on arbitrarily oriented surfaces, Theor. Appl. Climatol., 77, 151–158, 2004.
Oppenrieder, A., Hoeppe, P., and Koepke, P.: Routine measurements of erythemally effective ultraviolet irradiance on inclined surface, J. Photoch. Photobio. B, 74, 85–94, 2004.
Parisi, A. V. and Kimlin, M. G.: Horizontal and sun-normal spectral biologically effective
ultravi-25
olet irradiances, J. Photoch. Photobio. B, 70–74, 1999.
Ruggaber, A., Dlugi, R., and Nakajima, T.: Modelling radiation quantities and photolysis fre-quencies in the troposphere, 18, 171–210, 1994.
Schauberger, G.: Model for the global irradiance of the solar biologically effective ultraviolet radiation on inclined surfaces, Photoch. Photobio., 52(5), 1029–1032, 1990.
30
Schauberger, G.: Anisotropic model for diffusive biologically effective irradiance of solar UV radiation on inclined surfaces, Theor. Appl. Climatol., 46, 45–51, 1992.
Sys-ACPD
8, 21–45, 2008 Measurements of UV radiation on rotating vertical plane P. Sobolewski et al. Title Page Abstract Introduction Conclusions References Tables Figures ◭ ◮ ◭ ◮ Back CloseFull Screen / Esc
Printer-friendly Version Interactive Discussion
EGU
tem for transfer of atmospheric radiation STAR- version 2000, available athttp://www.meteo.
physik.uni-muenchen.de/strahlung/uvrad/Star/STARinfo.htm, 2000.
Siani, A. M., Casale, G. R., Di ´emoz, H., Agnesod, G., Borra, M., Militello, A., Kimlin, M. G., Lang, C. A., and Colosimo, A.: UV exposure on ski-field at an Alpine site, Proceedings of the UV conference “One century of UV radiation research”, edited by Gr ¨obner, J., Davos,
5
Switzerland, 129–130, 2007
Webb, A. R., Weihs, P., and Blumthaler, M.: Spectral UV irradiance on vertical surfaces: a case study, Photoch. Photobio., 69(4), 464–470, 1999.
Wester, U. and Josefsson, W.: UV-index and influence of action spectrum and surface inclina-tion, Rep. 127, World Meteorological Organizainclina-tion, Les Diablerets, Switzerland, 1997.
10
WMO (World Meteorological Organization): Report on the WMO meeting of experts on UVB measurements, data quality and standardization of UV indices, Report 95, WMO, Geneva, Switzerland, Les Diablerets, 1994.
WMO (World Meteorological Organization): Scientific assessment of ozone depletion: 2006, Global Ozone Research and Monitoring Project, Rep.50, Geneva Switzerland, 2007.
ACPD
8, 21–45, 2008 Measurements of UV radiation on rotating vertical plane P. Sobolewski et al. Title Page Abstract Introduction Conclusions References Tables Figures ◭ ◮ ◭ ◮ Back CloseFull Screen / Esc
Printer-friendly Version Interactive Discussion
EGU
Table 1. Statistical characteristics of relative exposures calculated from radiative model
simu-lation of UV irradiance on inclined surfaces for various action spectra.
Erythema UVA Vitamin D3 vertical normal vertical normal vertical normal Mean 0.462 1.081 0.616 1.394 0.488 0.928 Max 1.034 1.245 1.358 1.532 0.852 1.145 Min 0.262 0.579 0.216 0.778 0.274 0.509 Std Dev. 0.200 0.137 0.340 0.129 0.144 0.191 No. 9312 1164 9312 1164 9312 1164
ACPD
8, 21–45, 2008 Measurements of UV radiation on rotating vertical plane P. Sobolewski et al. Title Page Abstract Introduction Conclusions References Tables Figures ◭ ◮ ◭ ◮ Back CloseFull Screen / Esc
Printer-friendly Version Interactive Discussion
EGU
Fig. 1. The measuring system, movable vertically placed and horizontally fixed Kipp & Zonen
ACPD
8, 21–45, 2008 Measurements of UV radiation on rotating vertical plane P. Sobolewski et al. Title Page Abstract Introduction Conclusions References Tables Figures ◭ ◮ ◭ ◮ Back CloseFull Screen / Esc
Printer-friendly Version Interactive Discussion
EGU
152 153 154 155 156 157 158 159 160 161 162 163 164 165
Day of the Year
10 30 50 70 90 110 U Ve ry t 300 325 350 375 400 425 T o ta l O z o n e UV GUV511 O3 GUV511 UV KippZonen [ mWeryt/m2 ] [ DU ]
Fig. 2. Daily maxima of erythemally weighted irradiances at horizontal surface by horizontal
Kipp & Zonen dual band biometer and GUV511 (instrument for routine measurements at the ALOMAR observatory) in the period 1.–15 June 2007. Superposed is total ozone time series that is derived from GUV511 measurements.
ACPD
8, 21–45, 2008 Measurements of UV radiation on rotating vertical plane P. Sobolewski et al. Title Page Abstract Introduction Conclusions References Tables Figures ◭ ◮ ◭ ◮ Back CloseFull Screen / Esc
Printer-friendly Version Interactive Discussion EGU 0 5 10 15 20 25 30 35 40 45 50 0 5 10 15 20 25 30 35 40 45 50 U VA 162.0 162.5 163.0 163.5 Time Vertical plane Horizontal plane W/m2 W/m2
Fig. 3. UVA measurements by Kipp & Zonen dual band biometers at the ALOMAR observatory
ACPD
8, 21–45, 2008 Measurements of UV radiation on rotating vertical plane P. Sobolewski et al. Title Page Abstract Introduction Conclusions References Tables Figures ◭ ◮ ◭ ◮ Back CloseFull Screen / Esc
Printer-friendly Version Interactive Discussion EGU 0 10 20 30 40 50 60 70 80 90 100 110 120 VERTICAL 0 10 20 30 40 50 60 70 80 90 100 110 120 H O R IZ O N T A L VERTICAL/HORIZONTAL 0.47 ± 0.19 [ mW/m2 ] mW/m2 CIE weighted UV 0 10 20 30 40 50 VERTICAL 0 10 20 30 40 50 H O R IZ O N T A L VERTICAL/HORIZONTAL 0.51 ± 0.18 [W/m2 ] W/m2 UVA
Fig. 4. Scatter plot of biologically weighted UV irradiance measured at the ALOMAR
observa-tory in the period 1–15 June 2007 at horizontal surface versus that simultaneously measured on rotating vertical plane: erythemal data – top, integrated UVA data – bottom.
ACPD
8, 21–45, 2008 Measurements of UV radiation on rotating vertical plane P. Sobolewski et al. Title Page Abstract Introduction Conclusions References Tables Figures ◭ ◮ ◭ ◮ Back CloseFull Screen / Esc
Printer-friendly Version Interactive Discussion EGU 0.0 0.1 0.2 0.3 0.4 0.5 0.6 0.7 0.8 0.9 1.0 1.1 1.2 1.3 1.4 RATIO 0 10 20 30 40 [ % ] CIE weighted UV 0.0 0.1 0.2 0.3 0.4 0.5 0.6 0.7 0.8 0.9 1.0 1.1 1.2 1.3 1.4 RATIO 0 10 20 30 40 [ % ] UVA
Fig. 5. Histogram of relative (normalized by irradiance measured by horizontally fixed Kipp &
Zonen biometer) biologically weighted UV irradiance measured at the ALOMAR observatory in the period 1–15 June 2007, for various action spectra; erythemal data – top, integrated UVA data – bottom.
ACPD
8, 21–45, 2008 Measurements of UV radiation on rotating vertical plane P. Sobolewski et al. Title Page Abstract Introduction Conclusions References Tables Figures ◭ ◮ ◭ ◮ Back CloseFull Screen / Esc
Printer-friendly Version Interactive Discussion
EGU
-360 -315 -270 -225 -180 -135 -90 -45 0 45 90 135 180 225 270 315 360
PLANE AZIMUTH - SUN AZIMUTH 0.0 0.2 0.4 0.6 0.8 1.0 1.2 1.4 R A T IO [ deg ] [deg ] CIE weighted UV -360 -315 -270 -225 -180 -135 -90 -45 0 45 90 135 180 225 270 315 360
PLANE AZIMUTH - SUN AZIMUTH 0.0 0.2 0.4 0.6 0.8 1.0 1.2 1.4 R A T IO [ deg ] [deg ] UVA
Fig. 6. Relative biologically weighted UV irradiance on rotating vertical plane measured at the
ALOMAR observatory in the period 1–15 June 2007, for various configurations of the plane and action spectra : erythemal data – top, integrated UVA data – bottom.
ACPD
8, 21–45, 2008 Measurements of UV radiation on rotating vertical plane P. Sobolewski et al. Title Page Abstract Introduction Conclusions References Tables Figures ◭ ◮ ◭ ◮ Back CloseFull Screen / Esc
Printer-friendly Version Interactive Discussion
EGU
Fig. 7. Functions used for weighting UV irradiance derived from the radiative model simulations
ACPD
8, 21–45, 2008 Measurements of UV radiation on rotating vertical plane P. Sobolewski et al. Title Page Abstract Introduction Conclusions References Tables Figures ◭ ◮ ◭ ◮ Back CloseFull Screen / Esc
Printer-friendly Version Interactive Discussion
EGU
-360 -315 -270 -225 -180 -135 -90 -45 0 45 90135 180 225 270 315 360
PLANE AZIMUTH - SUN AZIMUTH 0.0 0.2 0.4 0.6 0.8 1.0 1.2 1.4 R A T IO VITAMIN D3 weighted UV [ deg ] [ deg ] -360 -315 -270 -225 -180 -135 -90-45 0 45 90135 180 225 270 315 360
PLANE AZIMUTH - SUN AZIMUTH 0.0 0.2 0.4 0.6 0.8 1.0 1.2 1.4 CIE weighted UV [ deg ] [ deg ] -360 -315 -270 -225 -180 -135 -90-45 0 45 90135 180 225 270 315 360
PLANE AZIMUTH - SUN AZIMUTH 0.0 0.2 0.4 0.6 0.8 1.0 1.2 1.4 UVA [ deg ] [ deg ]
Fig. 8. The same as Fig. 6 but the data are from the radiative model simulation for cloudless
conditions for 21 March 2007 and 21 June 2007 with artificial total ozone changing between 200–550 DU with 25 DU step for various action spectra: vit. D3– top, erythema – middle, UVA – bottom.
ACPD
8, 21–45, 2008 Measurements of UV radiation on rotating vertical plane P. Sobolewski et al. Title Page Abstract Introduction Conclusions References Tables Figures ◭ ◮ ◭ ◮ Back CloseFull Screen / Esc
Printer-friendly Version Interactive Discussion
EGU
0 50 100 150 200 250 300
Vit D3 weighted UVR - RTM model 0 25 50 75 100 125 150 175 200 225 250 275 300 V it D 3 U V R - R e g re s s io n [ mW/m2 ] [ mW/m2 ] 0 50 100 150 200 250 300
Vit D3 weighted UVR
-90 -80 -70 -60 -50 -40 -30 -20 -10 0 10 20 30 40 50 60 70 80 90 100 (R T M - R e g re s s io n )/ R T M* 1 0 0 % [% ] [ mW/m2 ]
Fig. 9. Vitamin D3 weighted UV irradiance on vertical surface from statistical model versus
that derived by radiative transfer model, RTM, (top). Relative differences (in percent of RTM irradiances) between statistical and RTM values (bottom).